DIFFERENTIAL IMPEDANCE ANALYSIS OF CONDUCTIVITY AND ...
DIFFERENTIAL IMPEDANCE ANALYSIS OF CONDUCTIVITY AND ...
DIFFERENTIAL IMPEDANCE ANALYSIS OF CONDUCTIVITY AND ...

You also want an ePaper? Increase the reach of your titles
YUMPU automatically turns print PDFs into web optimized ePapers that Google loves.
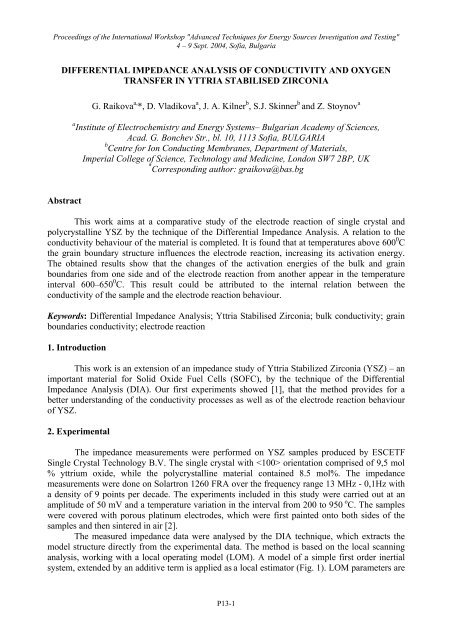
Proceedings of the International Workshop "Advanced Techniques for Energy Sources Investigation and Testing"<br />
4 – 9 Sept. 2004, Sofia, Bulgaria<br />
<strong>DIFFERENTIAL</strong> <strong>IMPEDANCE</strong> <strong>ANALYSIS</strong> <strong>OF</strong> <strong>CONDUCTIVITY</strong> <strong>AND</strong> OXYGEN<br />
TRANSFER IN YTTRIA STABILISED ZIRCONIA<br />
G. Raikova a, *, D. Vladikova a , J. A. Kilner b , S.J. Skinner b and Z. Stoynov a<br />
a Institute of Electrochemistry and Energy Systems– Bulgarian Academy of Sciences,<br />
Acad. G. Bonchev Str., bl. 10, 1113 Sofia, BULGARIA<br />
b Centre for Ion Conducting Membranes, Department of Materials,<br />
Imperial College of Science, Technology and Medicine, London SW7 2BP, UK<br />
* Corresponding author: graikova@bas.bg<br />
Abstract<br />
This work aims at a comparative study of the electrode reaction of single crystal and<br />
polycrystalline YSZ by the technique of the Differential Impedance Analysis. A relation to the<br />
conductivity behaviour of the material is completed. It is found that at temperatures above 600 0 C<br />
the grain boundary structure influences the electrode reaction, increasing its activation energy.<br />
The obtained results show that the changes of the activation energies of the bulk and grain<br />
boundaries from one side and of the electrode reaction from another appear in the temperature<br />
interval 600–650 0 C. This result could be attributed to the internal relation between the<br />
conductivity of the sample and the electrode reaction behaviour.<br />
Keywords: Differential Impedance Analysis; Yttria Stabilised Zirconia; bulk conductivity; grain<br />
boundaries conductivity; electrode reaction<br />
1. Introduction<br />
This work is an extension of an impedance study of Yttria Stabilized Zirconia (YSZ) – an<br />
important material for Solid Oxide Fuel Cells (S<strong>OF</strong>C), by the technique of the Differential<br />
Impedance Analysis (DIA). Our first experiments showed [1], that the method provides for a<br />
better understanding of the conductivity processes as well as of the electrode reaction behaviour<br />
of YSZ.<br />
2. Experimental<br />
The impedance measurements were performed on YSZ samples produced by ESCETF<br />
Single Crystal Technology B.V. The single crystal with orientation comprised of 9,5 mol<br />
% yttrium oxide, while the polycrystalline material contained 8.5 mol%. The impedance<br />
measurements were done on Solartron 1260 FRA over the frequency range 13 MHz - 0,1Hz with<br />
a density of 9 points per decade. The experiments included in this study were carried out at an<br />
amplitude of 50 mV and a temperature variation in the interval from 200 to 950 o C. The samples<br />
were covered with porous platinum electrodes, which were first painted onto both sides of the<br />
samples and then sintered in air [2].<br />
The measured impedance data were analysed by the DIA technique, which extracts the<br />
model structure directly from the experimental data. The method is based on the local scanning<br />
analysis, working with a local operating model (LOM). A model of a simple first order inertial<br />
system, extended by an additive term is applied as a local estimator (Fig. 1). LOM parameters are<br />
P13-1
the effective resistances R 1 and R 2 , the effective capacitance C and the effective time-constant T =<br />
CR 2 . More detailed information on the principle of DIA can be found in [3-6].<br />
The frequency dependence of the LOM parameters’ estimates ˆP LOM<br />
is an important step of<br />
the analysis, termed temporal analysis, since it provides information for the model structure:<br />
lg ˆP LOM = F (lgT f ), (1)<br />
where T f = 1/f is the sinusoidal period and f is the frequency. For convenience Eqn. (1) is<br />
expressed in a logarithmic form.<br />
R 2<br />
R 1<br />
-Im / Ω<br />
C<br />
Re / Ω<br />
Fig. 1. Local operating model (LOM) – first order inertial system: equivalent circuitry<br />
and impedance diagram<br />
When the structure of the LOM corresponds to that of the impedance object in a given<br />
frequency range, the parameters’ estimates have a constant behaviour, i.e. they are presented as<br />
plateaus (Fig.2b). The number of the plateaus yields the number of the time-constants in the<br />
model. For better visualisation of the results obtained by the temporal analysis, a spectral form of<br />
presentation is introduced [4]. Fig. 2c presents the effective time-constant spectrum. The rest of<br />
the parameters’ estimates have the similar spectra.<br />
- Im / Ω<br />
200<br />
a)<br />
0.1Hz<br />
100<br />
10Hz<br />
10mHz<br />
100Hz 1Hz<br />
1mHz<br />
0<br />
0 100 200 300 400<br />
Re / Ω<br />
lg P^<br />
4<br />
2<br />
0<br />
-2<br />
-4<br />
I III II<br />
^<br />
T / s<br />
^<br />
C / F<br />
b)<br />
-3 -2 -1 0 1 2 3<br />
lg (T / Hz -1 )<br />
F<br />
^<br />
R 2 / Ω<br />
Intensity / dB<br />
45<br />
30<br />
15<br />
I<br />
III<br />
c)<br />
0<br />
-6 -4 -2 0 2 4 6<br />
lg T^<br />
II<br />
Fig. 2. DIA of synthetic model of two steps Faradic reaction: a) impedance diagram;<br />
b) temporal plots; c) effective time-constant spectrum.<br />
The regions where the LOM parameters’ estimates are frequency dependent (segment III<br />
in Figs.2b,c) need an additional examination with the so-called Secondary Differential Impedance<br />
Analysis [7-10]. It works with the derivatives of the LOM parameters’ estimates with respect to<br />
the frequency:<br />
P13-2
δ = dlg ˆP /dlgTf = Φ ˆ (lg Tf). (2)<br />
ˆP LOM<br />
LOM<br />
That analysis recognises frequency dependent elements with CPE behaviour when the<br />
following relations are valid:<br />
δ = n, δ = 1 – n, δ = 1, (3)<br />
Rˆ<br />
2<br />
Ĉ<br />
where n is the CPE coefficient.<br />
For simplicity from here on the ˆR 2 is marked only with Rˆ . In this study mainly the<br />
estimates of the effective resistance are presented since they are used for quantitative evaluations.<br />
3. Results and Discussion<br />
A procedure for correction of the parasitic inductance of the cell and cabling was<br />
performed preceding the DIA analysis. This was possible due to the implemented preliminary<br />
short circuit calibration measurements at different temperatures in the same frequency range.<br />
Thus even at the highest temperatures the part of the first semicircle corresponding to the bulk<br />
properties is visible (Fig. 3).<br />
Tˆ<br />
20<br />
a)<br />
4<br />
2<br />
b)<br />
- Im / Ω<br />
20 40<br />
- Im / Ω<br />
-2 2 4 6 8<br />
-2<br />
-4<br />
-20<br />
-28<br />
Re / Ω<br />
Re / Ω<br />
Fig. 3. Impedance diagram of YSZ single crystal at 838 0 C (a); zoomed high frequency part (b);<br />
(●) before the correction of the parasitic inductance and (○) after the correction.<br />
The impedance diagrams for single crystal and polycrystalline YSZ are presented in Figs.<br />
4 and 5. They are similar and it is easy to separate two regions (region I and region II),<br />
corresponding respectively to the bulk properties and to the electrode reaction [11-13]. The<br />
semicircle in Fig. 4a (segment I) presents the bulk [12,13], while that in Fig. 4b characterises the<br />
bulk and the grain boundary behaviour [2]. The tails (segment II) are reflecting the electrode<br />
reaction, which is observed as a depressed semicircle at temperatures above 450 0 C (Fig. 5).<br />
P13-3
100<br />
295 0 C<br />
a)<br />
40<br />
330 0 C<br />
b)<br />
-Im / kΩ<br />
50<br />
II<br />
-Im / kΩ<br />
20<br />
II<br />
I<br />
I<br />
0<br />
0 50 100<br />
Re / kΩ<br />
0<br />
0 20 40<br />
Re / kΩ<br />
Fig. 4. Impedance diagrams of YZS single crystal (a) and YSZ polycrystalline sample (b) at low temperatures.<br />
30<br />
900 0 C<br />
a)<br />
15<br />
906 0 C<br />
b)<br />
-Im / Ω<br />
15<br />
II<br />
-Im / Ω<br />
10<br />
5<br />
II<br />
I<br />
I<br />
0<br />
0 15 30<br />
Re / Ω<br />
0<br />
0 5 10 15<br />
Re / Ω<br />
Fig. 5. Impedance diagrams of YZS single crystal (a) and YSZ polycrystalline sample (b) at high temperatures.<br />
Since the conductivity of the electrolyte and the electrode reaction have a response in<br />
different frequency regions, the DIA is preceded by frequency segmentation in the Rˆ temporal<br />
plot, where the separation of the phenomena is well visible. Fig. 6a presents the Rˆ temporal plot<br />
corresponding to segment I in Fig. 4a at different temperatures. It can be seen that for the<br />
polycrystalline sample an additional segment IA, due to the grain boundaries conductivity,<br />
appears in the temporal plot (Fig. 6b).<br />
The temporal analysis of segment I for YSZ single crystal and of segments I and IA for<br />
the polycrystalline sample (Fig. 6) inform for correspondence between the object and the LOM,<br />
i.e. a model of one step reaction (parallel connection of R and C) is recognised for every one of<br />
the segments. The more distributed behaviour of the bulk segment I in both samples is discussed<br />
in [1].<br />
P13-4
a)<br />
b)<br />
^<br />
lg(R / Ω)<br />
5<br />
4<br />
3<br />
2<br />
1<br />
452 0 C<br />
I<br />
395 0 C<br />
295 0 C<br />
^<br />
lg(R / Ω)<br />
6<br />
5<br />
4<br />
3<br />
2<br />
1<br />
I<br />
457 0 C<br />
IA<br />
252 0 C<br />
330 0 C<br />
0<br />
-7 -6 -5 -4<br />
lg (T f<br />
/ Hz -1 )<br />
0<br />
-7 -6 -5 -4 -3<br />
lg (T f<br />
/ Hz -1 )<br />
Fig. 6. Segment of<br />
Rˆ<br />
temporal plots of YSZ single crystal (a) and YSZ polycrystalline sample (b) at low<br />
temperatures.<br />
From the estimates of the bulk ˆR and grain boundaries ˆR resistances the<br />
b<br />
corresponding Ahrrenius plots are built. They show a kink for both the single crystal and the<br />
polycrystalline sample at about 650<br />
o C [1]. The calculated activation energies of the bulk<br />
resistances for both materials are similar (Table 1). There is also a coincidence between the bulk<br />
and grain boundaries activation energies, which is typical for YSZ [11].<br />
gb<br />
Table 1. Activation energies in eV of single crystal and polycrystalline YSZ.<br />
YSZ single crystal<br />
Polycrystalline YSZ<br />
bulk<br />
(eV)<br />
Above 650 0 C Below 650 0 C Above 650 0 C Above 600 0 C Below 650 0 C Below 600 0 C<br />
electrode<br />
reaction<br />
(eV)<br />
bulk<br />
(eV)<br />
electrode<br />
reaction<br />
(eV)<br />
bulk<br />
(eV)<br />
grain<br />
boundary<br />
(eV)<br />
electrode<br />
reaction<br />
(eV)<br />
bulk<br />
(eV)<br />
grain<br />
boundary<br />
(eV)<br />
electrode<br />
reaction<br />
(eV)<br />
0.4 1.21 1.14 0.66 0.31 0.29 1.60 1.10 1.13 0.52<br />
ˆ<br />
The R temporal plots corresponding to segment II in Figs.4,5, i.e. to the electrode<br />
reaction, are presented for different temperatures in Figs. 7, 8. Since they exhibit a dispersion, a<br />
Secondary DIA was applied for their further investigation. It has been found [1] that up to 450<br />
0 C<br />
the behaviour of the single crystal corresponds to a Warburg impedance (semi-infinite diffusion).<br />
In this study the same mechanism is confirmed for the polycrystalline sample, which also obeys<br />
the requirements of Eqn. (3) (Fig.9).<br />
P13-5
a)<br />
b)<br />
7<br />
6<br />
^<br />
lg(R / Ω)<br />
6<br />
5<br />
4<br />
II<br />
295 0 C<br />
395 0 C<br />
452 0 C<br />
^<br />
lg(R / Ω)<br />
5<br />
4<br />
II<br />
330 0 C<br />
407 0 C<br />
457 0 C<br />
3<br />
3<br />
2<br />
2<br />
1<br />
-3 -2 -1 0<br />
lg (T f<br />
/ Hz -1 )<br />
1<br />
-3 -2 -1 0<br />
lg (T f<br />
/ Hz -1 )<br />
Fig. 7. Segment of<br />
Rˆ<br />
temporal plots of YSZ single crystal (a) and YSZ polycrystalline sample (b)<br />
at temperatures below 500 0 C.<br />
At temperatures above 450 0 C for the single crystal DIA recognises a model corresponding<br />
to a single time constant with CPE behaviour of the capacitance (R in parallel with CPE). At<br />
650 0 C the CPE coefficient jumps from 0.5 to 0.8 [1].<br />
^<br />
lg(R / Ω)<br />
3<br />
2<br />
1<br />
0<br />
-1<br />
IIA<br />
IIB<br />
-2<br />
-6 -5 -4 -3 -2 -1<br />
lg (T f<br />
/ Hz -1 )<br />
a)<br />
647 0 C<br />
744 0 C<br />
793 0 C<br />
949 0 C<br />
^<br />
lg(R / Ω)<br />
4<br />
3<br />
2<br />
1<br />
0<br />
-1<br />
IIA<br />
IIB<br />
-2<br />
-6 -5 -4 -3 -2 -1<br />
lg (T f<br />
/ Hz -1 )<br />
b)<br />
605 0 C<br />
706 0 C<br />
810 0 C<br />
906 0 C<br />
Fig. 8. Segment of<br />
Rˆ<br />
temporal plots of YSZ single crystal (a) and YSZ polycrystalline sample (b)<br />
at high temperatures.<br />
The performance of Secondary DIA for the polycrystalline sample confirms the same<br />
model in the same temperature range. The procedure for the recognition of a time constant with<br />
CPE capacitance is described in [1,8,10]. The value of the plateau between segments IIA and IIB<br />
in the Rˆ temporal plots (Fig. 8b) determines the estimates of the electrode reaction polarisation<br />
resistance [1,8,10]. They are used for the construction of the Ahrrenius plot, which is<br />
characterised with a kink at about 600<br />
0 C(Fig. 10). The calculated activation energy is presented<br />
in Table 1. It follows the same tendency as that for the single crystal – its value is higher at higher<br />
temperatures (Table 1).<br />
P13-6
4<br />
2<br />
0.5<br />
^<br />
R / Ω<br />
^<br />
lgP<br />
0<br />
-2<br />
-4<br />
-6<br />
-8<br />
1.0<br />
0.5<br />
^<br />
T / s<br />
^<br />
C / F<br />
-10<br />
-3 -2 -1 0<br />
lg (T f<br />
/ Hz -1 )<br />
Fig. 9. Slopes of<br />
ˆR , Ĉ,<br />
and Tˆ temporal plots for segment II of YSZ polycrystalline sample at 457 0 C.<br />
The obtained results are in agreement with SIMS experiments for the surface exchange<br />
coefficient of YSZ single crystal – at higher temperatures larger activation energy is registered<br />
[2,14]. The observed change in the CPE coefficient for the polycrystalline sample from 0.5 to 0.8<br />
occurs at about 600 0 C [2,14]. We suppose that the increase of the CPE exponent at higher<br />
temperatures is due to an increased surface accumulation of oxygen species combined with<br />
higher concentration of oxygen free vacancies in the bulk [1,2]. This situation tolerates the<br />
conclusion for a slower dissociation/charge transfer and quick bulk incorporation [1,2].<br />
It is interesting to note that the activation energy of the electrode reaction for<br />
polycrystalline and single crystal YSZ at lower temperatures is approximately the same, while<br />
above the kink that of the polycrystalline material is higher (Table 1.). This result shows that the<br />
grain boundaries do not influence the transport mechanism, which is a dominating stage at lower<br />
temperatures, while at higher temperatures they hamper the surface exchange.<br />
5<br />
4<br />
lg (ρ / Ωcm)<br />
3<br />
2<br />
1<br />
0<br />
0,6 0,8 1,0 1,2 1,4 1,6<br />
1000T -1 / K -1<br />
Fig. 10. Ahrrenius plots for the electrode reaction of single crystal (▼) and polycrystalline YSZ (■) samples.<br />
The change in the activation energies of the electrolyte (bulk and grain boundary) and<br />
electrode reaction resistances within the same temperature range (600-650 0 C) indicates some<br />
correlation between the bulk and surface properties for both single crystal and polycrystalline<br />
YSZ, which confirms the importance of their common investigation.<br />
P13-7
4. Acknowledgements<br />
The authors acknowledge the European Community (specific programme “Energy,<br />
Environment and Sustainable Development – Part B: Energy program”, contract No<br />
NNE5/2002/18) and the Royal Society for the partial support and the possibility to present this<br />
paper in the International Workshop “Advanced Techniques for Energy Sources Investigation<br />
and Testing”, September 2004, Sofia, Bulgaria.<br />
5. References<br />
1. D. Vladikova, J. A. Kilner, S.J. Skinner, G. Raikova, Z. Stoynov, ”Differential Impedance<br />
Analysis of Single Crystal and Polycrystalline Yttria Stabilized Zirconia”, to be published.<br />
2. P. S. Manning, J. D. Sirman, R. A. De Souza, J. A. Kilner, Solid State Ionics 100 (1997) 1.<br />
3. Z. Stoynov, Polish J. Chem., 71 (1997) 1204.<br />
4. Z. Stoynov, in: C. Julien, Z. Stoynov (Eds.), Materials for Lithium-Ion Batteries, Kluwer<br />
Academic Publishers, 3/85 (2000) 371.<br />
5. D. Vladikova, P. Zoltowski, E. Makowska, Z. Stoynov, Electrochim. Acta 47 (2002) 2943.<br />
6. D. Vladikova, Z. Stoynov, M. Viviani, J. Europ. Ceram. Soc. 24 (2004) 1121.<br />
7. D. Vladikova, G. Raikova, Z. Stoynov, in: E. Balabanova, I. Dragieva (Eds.), Nanoscience<br />
and Nanotechnology ‘02, Heron Press Science Series, Sofia, 2002, p.66.<br />
8. D. Vladikova, Z. Stoynov, J. Electroanal. Chem. 572 (2004) 377.<br />
9. G. Raikova, D. Vladikova, Z. Stoynov, http://accessimpedance.iusi.bas.bg, Imp. Contribut.<br />
Online, 1 (2003) P8-1; Bulg. Chem. Commun. 36 (2004) 66.<br />
10. D. Vladikova, G. Raikova, Z. Stoynov, H. Takenouti, J. Kilner, S.Skinner, ”Differential<br />
Impedance Analysis of Solid Oxide Materials”, to be published.<br />
11. E. Shouler, G. Giroud, M. Kleitz, J. Chim. Phys. 70 (1973) 1039.<br />
12. H. J. de Bruin, A. D. Franklin, J. Electroanal. Chem. 118 (1981) 405.<br />
13. C. Gabrielli, Identification of Electrochemical Processes by Frequency Response Analysis,<br />
Farnborrnough, 1980.<br />
14. P. S. Manning, J. D. Sirman, J. A. Kilner, Solid State Ionics 93 (1997) 125.<br />
P13-8