+1% - Sherwin Williams
+1% - Sherwin Williams
+1% - Sherwin Williams

You also want an ePaper? Increase the reach of your titles
YUMPU automatically turns print PDFs into web optimized ePapers that Google loves.
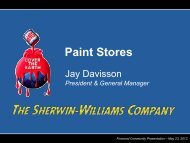
Investor Presentation<br />
Financial Community Presentation – Thursday, May 12, 2011
Forward-Looking Statements<br />
This presentation today will contain certain “forward-looking statements” , as defined<br />
under U.S. federal securities laws, with respect to sales, earnings and other matters.<br />
These forward-looking statements are based upon management’s current expectations,<br />
estimates, assumptions and beliefs concerning future events and conditions. Forwardlooking<br />
statements are necessarily subject to risks, uncertainties and other factors,<br />
many of which h are outside the control of the Company, that t could cause actual results<br />
to differ materially from such statements and from the Company’s historical results and<br />
experience. These risks, uncertainties and other factors include such things as:<br />
general business conditions, strengths of retail and manufacturing economies and the<br />
growth in the coatings industry; changes in the Company’s relationships with customers<br />
and suppliers; changes in raw material availability and pricing; unusual weather<br />
conditions; and other risks, uncertainties and other factors described from time to time<br />
in the Company’s reports filed with the Securities and Exchange Commission. Since it<br />
is not possible to predict or identify all of the risks, uncertainties and other factors that<br />
may affect future results, the above list should not be considered a complete list. Any<br />
forward-looking statement speaks only as of the date on which such statement is<br />
made, and the Company undertakes no obligation to update or revise any forwardlooking<br />
statement, whether as a result of new information, future events or otherwise.<br />
Financial Community<br />
The<br />
Presentation<br />
<strong>Sherwin</strong>-<strong>Williams</strong><br />
– Thursday,<br />
Company -May 2 nd Quarter<br />
12, 2011<br />
2012
Discussion Outline<br />
• Coatings Market Overview<br />
• <strong>Sherwin</strong>-<strong>Williams</strong> Overview<br />
– Paint Stores Group<br />
– Consumer Group<br />
– Latin America Coatings Group<br />
– Global l Finishes i Group<br />
• <strong>Sherwin</strong>-<strong>Williams</strong> Financial Overview<br />
Financial Community<br />
The<br />
Presentation<br />
<strong>Sherwin</strong>-<strong>Williams</strong><br />
– Thursday,<br />
Company -May 2 nd Quarter<br />
12, 2011<br />
2012
2011 Coatings Industry<br />
Global Mix by Category<br />
Architectural<br />
41%<br />
Special<br />
Purpose<br />
21%<br />
OEM Product<br />
Finishes<br />
38%<br />
Total Coatings<br />
2011<br />
74Billion 7.4 Gallons (+5%)<br />
~99 Billion Dollars (+5%)<br />
Source: Kusumgar, Nerlfi & Growney; Segment Percents Based on Dollars<br />
Financial Community<br />
The<br />
Presentation<br />
<strong>Sherwin</strong>-<strong>Williams</strong><br />
– Thursday,<br />
Company -May 2 nd Quarter<br />
12, 2011<br />
2012
2011 Coatings Industry<br />
Global Demand (US$)<br />
Europe<br />
29%<br />
29%<br />
Americas<br />
28%<br />
33%<br />
Asia‐Pacific<br />
40%<br />
36%<br />
All Coatings<br />
Architectural Coatings<br />
Rest of World<br />
3%<br />
2%<br />
Financial Community<br />
The<br />
Presentation<br />
<strong>Sherwin</strong>-<strong>Williams</strong><br />
– Thursday,<br />
Company -May 2 nd Quarter<br />
12, 2011<br />
2012
Coatings Industry<br />
Top Global Manufacturers - 2011<br />
• Top 10 suppliers<br />
account for ~57%<br />
global share<br />
• More than 15,000<br />
companies make<br />
up the balance<br />
All Others<br />
(>15,000 firms)<br />
Source: Kusumgar, Nerlfi & Growney, Company Data<br />
Financial Community<br />
The<br />
Presentation<br />
<strong>Sherwin</strong>-<strong>Williams</strong><br />
– Thursday,<br />
Company -May 2 nd Quarter<br />
12, 2011<br />
2012
U.S. Coatings Industry<br />
Sales ($) Mix by Category<br />
Architectural<br />
58%<br />
Special<br />
Purpose<br />
16%<br />
OEM Product<br />
Finishes<br />
26%<br />
Total Coatings<br />
2011<br />
1.04 Billion Gallons (<strong>+1%</strong>)<br />
18.66 Billion Dollars (+5.3%)<br />
Source: U.S. Department of Commerce; Segment Percents Based on Dollars<br />
Financial Community<br />
The<br />
Presentation<br />
<strong>Sherwin</strong>-<strong>Williams</strong><br />
– Thursday,<br />
Company -May 2 nd Quarter<br />
12, 2011<br />
2012
U.S. Coatings Industry<br />
Architectural Coatings Gallons (Millions)<br />
900<br />
Mill lions of Gal llons<br />
800<br />
700<br />
600<br />
~803<br />
>185 Million<br />
Gallons Lost<br />
~ 615<br />
500<br />
1998 1999 2000 2001 2002 2003 2004 2005 2006 2007 2008 2009 2010 2011<br />
Source: U.S. Department of Commerce MA325F Report<br />
Financial Community<br />
The<br />
Presentation<br />
<strong>Sherwin</strong>-<strong>Williams</strong><br />
– Thursday,<br />
Company -May 2 nd Quarter<br />
12, 2011<br />
2012
Favorable Customer Mix<br />
DIY Contractor Shift will Continue<br />
59%<br />
44%<br />
41%<br />
56%<br />
Contractor<br />
DIY<br />
Source: U.S. Dept of Commerce/Company Estimates<br />
Financial Community<br />
The<br />
Presentation<br />
<strong>Sherwin</strong>-<strong>Williams</strong><br />
– Thursday,<br />
Company -May 2 nd Quarter<br />
12, 2011<br />
2012
DIY Channel Share, U.S.<br />
Most Recent Purchase by Store Type<br />
Home Centers<br />
61%<br />
Mass<br />
Merchants<br />
14%<br />
Lumber/<br />
Building Supply<br />
2%<br />
Hardware<br />
9%<br />
Paint Stores<br />
15%<br />
Source: PCRP 2011<br />
Financial Community<br />
The<br />
Presentation<br />
<strong>Sherwin</strong>-<strong>Williams</strong><br />
– Thursday,<br />
Company -May 2 nd Quarter<br />
12, 2011<br />
2012
Contractor Channel Share, U.S.<br />
Primary Outlet by Store Type<br />
Paint<br />
Stores<br />
90.2% Hardware<br />
1.6%<br />
Home<br />
Centers<br />
6.3%<br />
Discount /<br />
Other<br />
1.9%<br />
Source: S‐W Marketing: 2011<br />
Financial Community<br />
The<br />
Presentation<br />
<strong>Sherwin</strong>-<strong>Williams</strong><br />
– Thursday,<br />
Company -May 2 nd Quarter<br />
12, 2011<br />
2012
Company Overview<br />
Financial Highlights<br />
2011 2010 % Chg.<br />
Net Sales $8.77M $7.78M 12.7%<br />
EBITDA $965M $924M 4.4%<br />
Income $442M* $462M (4.3%)<br />
% Sales 5.0% 5.9%<br />
Earnings Per Share $4.14 14* $4.21 (1.7%)<br />
Net Operating Cash $736M** $707M 4.1%<br />
Dividend Per Share $1.46 $1.44<br />
Return on Assets 8.4% 8.9%<br />
Return on Equity 27.5% 31.0%<br />
* Includes IRS Settlement of $75M or Approximately $.70 per Diluted Common Share<br />
** Includes $70M Increase in Cash Taxes from IRS Settlement<br />
Financial Community<br />
The<br />
Presentation<br />
<strong>Sherwin</strong>-<strong>Williams</strong><br />
– Thursday,<br />
Company -May 2 nd Quarter<br />
12, 2011<br />
2012
Company Overview<br />
Adjusted Earnings & Net Operating Cash<br />
2011 2010 % Chg.<br />
Net Sales $8.77M $7.78M 12.7%<br />
EBITDA $965M $924M 4.4%<br />
Income $517M $462M 11.9%<br />
% Sales 5.9% 5.9%<br />
Earnings Per Share $4.84 $4.21 15.0%<br />
Net Operating Cash $806M $707M 14.0%<br />
Dividend Per Share $1.46 $1.44<br />
Return on Assets 8.4% 8.9%<br />
Return on Equity 27.5% 31.0%<br />
Financial Community<br />
The<br />
Presentation<br />
<strong>Sherwin</strong>-<strong>Williams</strong><br />
– Thursday,<br />
Company -May 2 nd Quarter<br />
12, 2011<br />
2012
Company Overview<br />
Financial Highlights 1H-2012 vs 1H-2011<br />
1H-12 1H-11 % Chg.<br />
Net Sales $4.71B $4.21B 11.9%<br />
EBITDA $579M $462M 25.3%<br />
Income $328M $247M 32.6%<br />
% Sales 7.0% 5.9%<br />
Earnings Per Share $3.13 $2.29 36.7%<br />
Financial Community<br />
The<br />
Presentation<br />
<strong>Sherwin</strong>-<strong>Williams</strong><br />
– Thursday,<br />
Company -May 2 nd Quarter<br />
12, 2011<br />
2012
Company Overview<br />
Revenue & Profit by Segment - 2011<br />
Paint Stores<br />
Sales: $4.78 Billion<br />
Profit: $645.7 Million<br />
Profit %: 13.5<br />
Sales: $1.88 Billion<br />
Profit: $90.3 Million<br />
Profit %: 4.8<br />
Global<br />
Sales: $.828 Billion<br />
Profit: $75.5 Million<br />
Profit %: 9.1<br />
Sales: $1.27 Billion<br />
Profit: $173.7 7 Million<br />
Profit %: 13.6<br />
Consumer<br />
Latin America<br />
Controlled Distribution Accounts for 75% of Sales<br />
Financial Community<br />
The<br />
Presentation<br />
<strong>Sherwin</strong>-<strong>Williams</strong><br />
– Thursday,<br />
Company -May 2 nd Quarter<br />
12, 2011<br />
2012
Paint Stores Group<br />
Top 10 Paint Store Chains – North America<br />
Count<br />
YE 2011 Est.<br />
1 Yr Change<br />
3,450 +60<br />
Akzo Nobel/ICI/Glidden 558 +4<br />
PPG 393 +2<br />
Comex/Pro Paint, Inc. 317 ‐21<br />
Kelly‐Moore 154 ‐9<br />
Dunn Edwards 109 1,831 +1 ‐26<br />
Cloverdale/Rodda 104 +2<br />
Diamond Vogel 67 ‐11<br />
Benjamin Moore 84 0<br />
Vista 45 ‐4<br />
Gap: +1,619 +86<br />
Source: Independent Research, Company Websites, Rauch Guide, Chain Store Guide<br />
Financial Community<br />
The<br />
Presentation<br />
<strong>Sherwin</strong>-<strong>Williams</strong><br />
– Thursday,<br />
Company -May 2 nd Quarter<br />
12, 2011<br />
2012
Paint Stores Group<br />
Store Penetration<br />
Financial Community<br />
The<br />
Presentation<br />
<strong>Sherwin</strong>-<strong>Williams</strong><br />
– Thursday,<br />
Company -May 2 nd Quarter<br />
12, 2011<br />
2012
Paint Stores Group<br />
Voluntary Turnover<br />
Manager 4.2%<br />
Assistant Mgr. 89% 8.9%<br />
Sales Rep 4.0%<br />
Financial Community<br />
The<br />
Presentation<br />
<strong>Sherwin</strong>-<strong>Williams</strong><br />
– Thursday,<br />
Company -May 2 nd Quarter<br />
12, 2011<br />
2012
Consumer Group<br />
End to End Supply Chain<br />
• 32 Manufacturing Sites<br />
• 7 Distribution Service Centers<br />
• 400 Tractors / 1,200 Trailers<br />
• More than 6,000 Employees<br />
Financial Community<br />
The<br />
Presentation<br />
<strong>Sherwin</strong>-<strong>Williams</strong><br />
– Thursday,<br />
Company -May 2 nd Quarter<br />
12, 2011<br />
2012
Consumer Group<br />
Raw Material Breakdown<br />
Containers (14%)<br />
Metal or Plastic<br />
Solvents (12%)<br />
Resins/Latex (36%)<br />
Acrylic (Latex Paints)<br />
Alkyd (Oil Paints)<br />
Epoxy (Epoxy Paints)<br />
Pigments (29%)<br />
Titanium Dioxide<br />
Pigments<br />
Paint Fillers<br />
Extenders<br />
Additives (9%)<br />
Financial Community<br />
The<br />
Presentation<br />
<strong>Sherwin</strong>-<strong>Williams</strong><br />
– Thursday,<br />
Company -May 2 nd Quarter<br />
12, 2011<br />
2012
Brand Power<br />
Leading U.S. Brand Awareness<br />
#1 Architectural Paint Brand<br />
#1 Stain & Protective ti Finish i Brand<br />
#1 Aerosol Paint Brand<br />
#1 Auto Specialty Paint Brand<br />
#1 Painting Tool Brand<br />
#1 Wood Sealer Brand<br />
Financial Community<br />
The<br />
Presentation<br />
<strong>Sherwin</strong>-<strong>Williams</strong><br />
– Thursday,<br />
Company -May 2 nd Quarter<br />
12, 2011<br />
2012
Consumer Group<br />
U.S. Outlet Penetration<br />
56,000<br />
Total U.S. Paint &<br />
Coatings Outlets<br />
38,000<br />
Consumer Segment<br />
Customers<br />
3,450<br />
<strong>Sherwin</strong>-<strong>Williams</strong> Stores<br />
Financial Community<br />
The<br />
Presentation<br />
<strong>Sherwin</strong>-<strong>Williams</strong><br />
– Thursday,<br />
Company -May 2 nd Quarter<br />
12, 2011<br />
2012
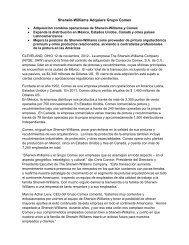
Mexico<br />
Latin America Coatings<br />
El Salvador<br />
Venezuela<br />
Ecuador<br />
Perú<br />
Brazil<br />
Chile<br />
Uruguay<br />
Argentina<br />
S-W Operations<br />
S-W Licensees<br />
Financial Community<br />
The<br />
Presentation<br />
<strong>Sherwin</strong>-<strong>Williams</strong><br />
– Thursday,<br />
Company -May 2 nd Quarter<br />
12, 2011<br />
2012
Latin America Coatings<br />
Architectural Protective & Marine Product Finishes<br />
S-W Stores Dealers Home Centers/Mass<br />
Financial Community<br />
The<br />
Presentation<br />
<strong>Sherwin</strong>-<strong>Williams</strong><br />
– Thursday,<br />
Company -May 2 nd Quarter<br />
12, 2011<br />
2012
Latin America Coatings<br />
Controlled Distribution & Dedicated Dealers<br />
255 Company-operated operated<br />
stores throughout the Region<br />
Dedicated Dealers<br />
in Mexico & Argentina<br />
Financial Community<br />
The<br />
Presentation<br />
<strong>Sherwin</strong>-<strong>Williams</strong><br />
– Thursday,<br />
Company -May 2 nd Quarter<br />
12, 2011<br />
2012
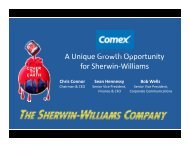
Global Finishes Group<br />
Automotive<br />
Aerospace<br />
Protective<br />
Marine<br />
OEM Finishes<br />
Financial Community<br />
The<br />
Presentation<br />
<strong>Sherwin</strong>-<strong>Williams</strong><br />
– Thursday,<br />
Company -May 2 nd Quarter<br />
12, 2011<br />
2012
Global Finishes Group<br />
Expanding Global Platform<br />
• Protective & Marine<br />
• OEM Product Finish<br />
• Automotive<br />
• Aerospace<br />
• Protective & Marine<br />
• OEM Product Finish<br />
• Automotive<br />
• Automotive<br />
• OEM Product Finish<br />
• Architectural<br />
• Industrial Wood Coatings<br />
• Protective & Marine<br />
• OEM Product Finish<br />
• Automotive<br />
ti<br />
• Protective & Marine<br />
• OEM Product Finish<br />
• Automotive<br />
Financial Community<br />
The<br />
Presentation<br />
<strong>Sherwin</strong>-<strong>Williams</strong><br />
– Thursday,<br />
Company -May 2 nd Quarter<br />
12, 2011<br />
2012
Consolidated Gross Profit<br />
$ Millions<br />
4,000<br />
3,500<br />
3,000<br />
2,500<br />
2,000<br />
1,500<br />
$ Gross Profit<br />
% of Sales<br />
3,413<br />
3,598<br />
3,499<br />
3,080<br />
2,701<br />
44.2<br />
42.8 43.7<br />
44.9 43.8<br />
3,263<br />
46.0<br />
3,481<br />
44.8<br />
3,745<br />
42.7<br />
1,000<br />
500<br />
0<br />
2004 2005 2006 2007 2008 2009 2010 2011<br />
Financial Community<br />
The<br />
Presentation<br />
<strong>Sherwin</strong>-<strong>Williams</strong><br />
– Thursday,<br />
Company -May 2 nd Quarter<br />
12, 2011<br />
2012
Consolidated Gross Profit<br />
$ Millions<br />
4,000<br />
3,500<br />
3,000<br />
2,500<br />
2,000<br />
1,500<br />
1,000<br />
500<br />
0<br />
$ Gross Profit<br />
% of Sales<br />
Raw Material Index<br />
3,745<br />
3,598<br />
3,413<br />
3,499<br />
3,481<br />
3,263<br />
3,080<br />
2,701<br />
1.8<br />
44.2<br />
46.0<br />
44.9 42.8 43.7<br />
43.8<br />
44.8<br />
42.7<br />
1.6<br />
1.4<br />
1.2<br />
1.0<br />
2004 2005 2006 2007 2008 2009 2010 2011<br />
Financial Community<br />
The<br />
Presentation<br />
<strong>Sherwin</strong>-<strong>Williams</strong><br />
– Thursday,<br />
Company -May 2 nd Quarter<br />
12, 2011<br />
2012
Selling, General & Admin Expense<br />
3,000<br />
2,500<br />
$ SG&A<br />
% of Sales<br />
2,326<br />
2,069<br />
2,513 2,597 2,644<br />
2,535<br />
2,728<br />
2,961<br />
$ Millions<br />
2,000<br />
1,500<br />
1,000<br />
33.8<br />
32.4 32.2 32.4 33.1<br />
35.7 35.1<br />
33.8<br />
500<br />
0<br />
2004 2005 2006 2007 2008 2009 2010 2011<br />
Financial Community<br />
The<br />
Presentation<br />
<strong>Sherwin</strong>-<strong>Williams</strong><br />
– Thursday,<br />
Company -May 2 nd Quarter<br />
12, 2011<br />
2012
Working Capital Ratio<br />
(Accounts Receivable + Inventory – Payables)/Sales<br />
20%<br />
13.8% 15% 12.5% 12.7%<br />
11.7% 11.5% 11.9% 10.7% 10.9%<br />
10%<br />
5%<br />
0%<br />
2004 2005 2006 2007 2008 2009 2010 2011<br />
Financial Community<br />
The<br />
Presentation<br />
<strong>Sherwin</strong>-<strong>Williams</strong><br />
– Thursday,<br />
Company -May 2 nd Quarter<br />
12, 2011<br />
2012
Uses of Cash<br />
2007-2011 ($ Millions)<br />
5-Year Net Operating Cash: $4,052.4<br />
4<br />
Capital Expenditures<br />
$653.4<br />
Treasury Stock<br />
Purchases<br />
$2,529.4<br />
$799.9<br />
Cash Dividendsid d<br />
$709.1<br />
Acquisitions<br />
Financial Community<br />
The<br />
Presentation<br />
<strong>Sherwin</strong>-<strong>Williams</strong><br />
– Thursday,<br />
Company -May 2 nd Quarter<br />
12, 2011<br />
2012
Stock Repurchase<br />
14.00<br />
13.20<br />
Millions of Shares<br />
12.00<br />
10.00<br />
800 8.00 660 6.60<br />
6.00<br />
4.00<br />
8.10<br />
5.60<br />
7.25<br />
9.00<br />
5.00 4.70<br />
2.00<br />
0.00<br />
2004 2005 2006 2007 2008 2009 2010 2011<br />
Avg. Common<br />
Shares Outstanding 144.7 141.1 137.3 130.9 119.3 115.4 108.2 103.4<br />
Avg. Price/Share $40.00 00 $44.14 $54.49 49 $65.39 $54.28 $58.93 $75.14 $78.16<br />
Financial Community<br />
The<br />
Presentation<br />
<strong>Sherwin</strong>-<strong>Williams</strong><br />
– Thursday,<br />
Company -May 2 nd Quarter<br />
12, 2011<br />
2012
Total Debt : EBITDA Ratio<br />
($ in Millions)<br />
1200<br />
1000<br />
800<br />
600<br />
400<br />
965<br />
84% 88% 98% 113% 103%<br />
1148<br />
946<br />
834 818<br />
834<br />
924 965<br />
1045 993<br />
200<br />
0<br />
2007 2008 2009 2010 2011<br />
Total Debt<br />
EBITDA<br />
Financial Community<br />
The<br />
Presentation<br />
<strong>Sherwin</strong>-<strong>Williams</strong><br />
– Thursday,<br />
Company -May 2 nd Quarter<br />
12, 2011<br />
2012
$1.60<br />
$1.40<br />
$1.20<br />
Dividends Per Share<br />
1979 – 2012<br />
1.56<br />
1.42 1.441.46<br />
1.40<br />
1.26<br />
$1.00<br />
$0.80<br />
$0.60<br />
$0.40<br />
$0.20<br />
$0.00<br />
.82<br />
.62 .68 .58 .60<br />
.54<br />
.45<br />
.48<br />
.40<br />
.32<br />
.35 .21 .22<br />
.25<br />
.28<br />
.01 .04 .05 .06 .08 .10 .12 .13 .14 .16 .18 .19<br />
100 1.00<br />
1<br />
1<br />
1<br />
1<br />
1<br />
1<br />
1<br />
1<br />
1<br />
1<br />
1<br />
1<br />
1<br />
1<br />
1<br />
1<br />
1<br />
1<br />
1<br />
1<br />
1<br />
979<br />
980<br />
981<br />
982<br />
983<br />
984<br />
985<br />
986<br />
987<br />
988<br />
989<br />
990<br />
991<br />
992<br />
993<br />
994<br />
995<br />
996<br />
997<br />
998<br />
999<br />
2000<br />
2001<br />
2002<br />
2003<br />
2004<br />
2005<br />
2006<br />
2007<br />
2008<br />
2009<br />
2010<br />
2011<br />
2012<br />
Financial Community<br />
The<br />
Presentation<br />
<strong>Sherwin</strong>-<strong>Williams</strong><br />
– Thursday,<br />
Company -May 2 nd Quarter<br />
12, 2011<br />
2012