Ruling of the IUCN Red List Standards and Petitions Working Group ...
Ruling of the IUCN Red List Standards and Petitions Working Group ...
Ruling of the IUCN Red List Standards and Petitions Working Group ...

Create successful ePaper yourself
Turn your PDF publications into a flip-book with our unique Google optimized e-Paper software.
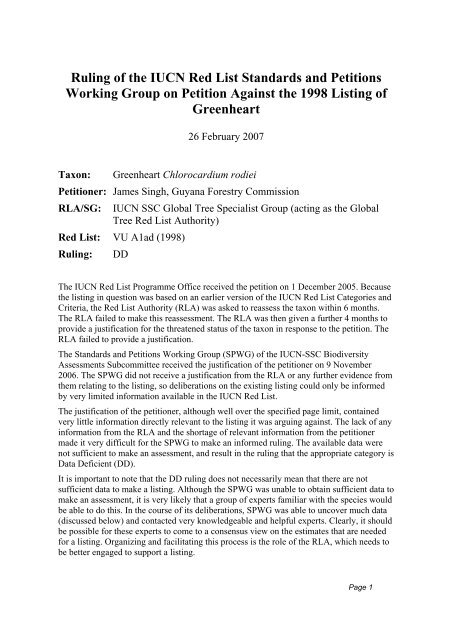
<strong>Ruling</strong> <strong>of</strong> <strong>the</strong> <strong>IUCN</strong> <strong>Red</strong> <strong>List</strong> <strong>St<strong>and</strong>ards</strong> <strong>and</strong> <strong>Petitions</strong><br />
<strong>Working</strong> <strong>Group</strong> on Petition Against <strong>the</strong> 1998 <strong>List</strong>ing <strong>of</strong><br />
Greenheart<br />
26 February 2007<br />
Taxon:<br />
Greenheart Chlorocardium rodiei<br />
Petitioner: James Singh, Guyana Forestry Commission<br />
RLA/SG:<br />
<strong>IUCN</strong> SSC Global Tree Specialist <strong>Group</strong> (acting as <strong>the</strong> Global<br />
Tree <strong>Red</strong> <strong>List</strong> Authority)<br />
<strong>Red</strong> <strong>List</strong>: VU A1ad (1998)<br />
<strong>Ruling</strong>:<br />
DD<br />
The <strong>IUCN</strong> <strong>Red</strong> <strong>List</strong> Programme Office received <strong>the</strong> petition on 1 December 2005. Because<br />
<strong>the</strong> listing in question was based on an earlier version <strong>of</strong> <strong>the</strong> <strong>IUCN</strong> <strong>Red</strong> <strong>List</strong> Categories <strong>and</strong><br />
Criteria, <strong>the</strong> <strong>Red</strong> <strong>List</strong> Authority (RLA) was asked to reassess <strong>the</strong> taxon within 6 months.<br />
The RLA failed to make this reassessment. The RLA was <strong>the</strong>n given a fur<strong>the</strong>r 4 months to<br />
provide a justification for <strong>the</strong> threatened status <strong>of</strong> <strong>the</strong> taxon in response to <strong>the</strong> petition. The<br />
RLA failed to provide a justification.<br />
The <strong>St<strong>and</strong>ards</strong> <strong>and</strong> <strong>Petitions</strong> <strong>Working</strong> <strong>Group</strong> (SPWG) <strong>of</strong> <strong>the</strong> <strong>IUCN</strong>-SSC Biodiversity<br />
Assessments Subcommittee received <strong>the</strong> justification <strong>of</strong> <strong>the</strong> petitioner on 9 November<br />
2006. The SPWG did not receive a justification from <strong>the</strong> RLA or any fur<strong>the</strong>r evidence from<br />
<strong>the</strong>m relating to <strong>the</strong> listing, so deliberations on <strong>the</strong> existing listing could only be informed<br />
by very limited information available in <strong>the</strong> <strong>IUCN</strong> <strong>Red</strong> <strong>List</strong>.<br />
The justification <strong>of</strong> <strong>the</strong> petitioner, although well over <strong>the</strong> specified page limit, contained<br />
very little information directly relevant to <strong>the</strong> listing it was arguing against. The lack <strong>of</strong> any<br />
information from <strong>the</strong> RLA <strong>and</strong> <strong>the</strong> shortage <strong>of</strong> relevant information from <strong>the</strong> petitioner<br />
made it very difficult for <strong>the</strong> SPWG to make an informed ruling. The available data were<br />
not sufficient to make an assessment, <strong>and</strong> result in <strong>the</strong> ruling that <strong>the</strong> appropriate category is<br />
Data Deficient (DD).<br />
It is important to note that <strong>the</strong> DD ruling does not necessarily mean that <strong>the</strong>re are not<br />
sufficient data to make a listing. Although <strong>the</strong> SPWG was unable to obtain sufficient data to<br />
make an assessment, it is very likely that a group <strong>of</strong> experts familiar with <strong>the</strong> species would<br />
be able to do this. In <strong>the</strong> course <strong>of</strong> its deliberations, SPWG was able to uncover much data<br />
(discussed below) <strong>and</strong> contacted very knowledgeable <strong>and</strong> helpful experts. Clearly, it should<br />
be possible for <strong>the</strong>se experts to come to a consensus view on <strong>the</strong> estimates that are needed<br />
for a listing. Organizing <strong>and</strong> facilitating this process is <strong>the</strong> role <strong>of</strong> <strong>the</strong> RLA, which needs to<br />
be better engaged to support a listing.<br />
Page 1
SPWG takes <strong>the</strong> view that this appeal should have been resolved through earlier actions by<br />
<strong>the</strong> RLA to work with experts on <strong>the</strong> species <strong>and</strong> <strong>the</strong> criteria to agree on a listing. The<br />
involvement <strong>of</strong> SPWG at this stage, before any detailed discussions have taken place, has<br />
not been helpful in resolving <strong>the</strong> matter.<br />
The rest <strong>of</strong> this document is a brief discussion <strong>of</strong> some <strong>of</strong> <strong>the</strong> technical issues that need to<br />
be addressed in <strong>the</strong> course <strong>of</strong> providing a listing for this species.<br />
1. <strong>Red</strong>uction vs. Harvest<br />
The listing <strong>of</strong> <strong>the</strong> taxon on <strong>the</strong> 2006 <strong>IUCN</strong> <strong>Red</strong> <strong>List</strong> provided <strong>the</strong> following justification<br />
(ARW 1998).<br />
An appeal against <strong>the</strong> listing <strong>of</strong> this species was submitted to <strong>the</strong> World<br />
Conservation Monitoring Centre by Dr. David Hammond in 1999. Dr.<br />
Hammond's submission provided corrections to <strong>the</strong> distribution <strong>of</strong> <strong>the</strong> species<br />
<strong>and</strong> some excellent additional documentation. The matter was referred to<br />
colleagues at TROPENBOS for comment as <strong>the</strong>y have a programme in Guyana<br />
looking at this <strong>and</strong> o<strong>the</strong>r species. The conclusion after considering <strong>the</strong> case,<br />
which was also backed up by data from Dr. Hammond, was that <strong>the</strong> species<br />
merits a Vulnerable status as between 15.1 <strong>and</strong> 28.6% <strong>of</strong> <strong>the</strong> original<br />
population has been harvested to date. Harvesting as a commercial timber<br />
began in <strong>the</strong> late 1700s, but most <strong>of</strong> <strong>the</strong> harvesting has only taken place since<br />
<strong>the</strong> introduction <strong>of</strong> chainsaws, etc. in 1967. It is <strong>the</strong>refore reasonable to infer a<br />
20% decline over <strong>the</strong> past three generations.<br />
Thus, 20% reduction was inferred from an estimate that between 15.1 <strong>and</strong> 28.6% <strong>of</strong> <strong>the</strong><br />
original population has been harvested until 1999. More recent calculations by D.<br />
Hammond (pers. comm.) suggest that about 38% <strong>of</strong> <strong>the</strong> original volume <strong>of</strong> harvestable trees<br />
has been harvested until <strong>the</strong> end <strong>of</strong> 2004. Due to uncertainty in <strong>the</strong> size <strong>of</strong> an average<br />
harvested tree, <strong>the</strong> proportion <strong>of</strong> <strong>the</strong> original tree population that is harvested has a large<br />
range (20% to 69%).<br />
However, <strong>the</strong> proportion <strong>of</strong> original population harvested does not lead to a direct estimate<br />
<strong>of</strong> population reduction. Depending on recruitment, this proportion <strong>of</strong> original population<br />
harvested during a 150-year period may lead to a population reduction during that period <strong>of</strong><br />
less than 20% (leading to an LC listing), more than 30% (leading to a VU listing), or even<br />
more.<br />
Population reduction in this case can be calculated in several ways. Some <strong>of</strong> <strong>the</strong>se<br />
approaches are discussed below.<br />
2. Calculating Past <strong>Red</strong>uction<br />
The most straightforward way <strong>of</strong> calculating past reduction would be to estimate past <strong>and</strong><br />
current population sizes. The informal petition <strong>of</strong> 1999 mentioned above included an<br />
estimate <strong>of</strong> past population size <strong>and</strong> an estimate <strong>of</strong> <strong>the</strong> cumulative amount <strong>of</strong> harvest since<br />
<strong>the</strong> beginning <strong>of</strong> <strong>the</strong> commercial harvest <strong>of</strong> this species in <strong>the</strong> mid 19 th century. If this<br />
calculation can be confirmed, it could be used in an assessment, which would also require<br />
an estimate <strong>of</strong> current population size. Although such an estimate is not currently available,<br />
it should be much easier to obtain an estimate <strong>of</strong> current population size than an estimate <strong>of</strong><br />
<strong>the</strong> population size over 150 years ago.<br />
The only region for which population reduction (ra<strong>the</strong>r than just harvest) is calculated is <strong>the</strong><br />
Bartica Triangle (Steege et al. 2002), where <strong>the</strong> density <strong>of</strong> Chlorocardium trees declined by<br />
Page 2
about 80% from 1924 to 1999 (based on <strong>the</strong> ratio <strong>of</strong> estimated densities in 1999 <strong>and</strong> 1924).<br />
This is a very substantial decline, but applies only to a very small part <strong>of</strong> <strong>the</strong> species range;<br />
<strong>the</strong> percentage <strong>of</strong> total population located in <strong>the</strong> Bartica Triangle 150 years ago was, very<br />
roughly, close to 5 or 6% (R. Zagt, pers. comm.). However, <strong>the</strong> methods used in this study<br />
can be applied to o<strong>the</strong>r parts <strong>of</strong> <strong>the</strong> range to estimate reductions based on historical <strong>and</strong><br />
recent surveys. These estimates can <strong>the</strong>n be combined to calculate <strong>the</strong> overall reduction,<br />
following <strong>the</strong> guidelines given in SPWG (2006).<br />
3. Criterion A2 vs. Criterion A4<br />
The generation length <strong>of</strong> <strong>the</strong> species is estimated to be around 300 years (Zagt 1997). Thus,<br />
<strong>the</strong> period since <strong>the</strong> start <strong>of</strong> commercial harvest represents only about half a generation <strong>of</strong><br />
this species. There are some indications that <strong>the</strong> current levels <strong>of</strong> harvest may not be<br />
sustainable. For example, although <strong>the</strong> rotation period was recently increased to 60 years,<br />
Steege et al. (2002) estimate that it should be 100 years to achieve sustainable harvest.<br />
Thus, combining an estimate <strong>of</strong> past reduction with an estimate <strong>of</strong> future reduction for a<br />
listing under Criterion A4 may provide a better assessment <strong>of</strong> <strong>the</strong> taxon's status.<br />
However, predicting future reduction presents several additional issues that must be<br />
addressed. Future reduction can be inferred from recent population trends, but this requires<br />
a higher temporal resolution than simply calculating <strong>the</strong> overall reduction since <strong>the</strong> 1850s.<br />
Depending on when, <strong>and</strong> in which parts <strong>of</strong> <strong>the</strong> species' range, additional surveys were done,<br />
it may be possible to infer future reduction based on an extrapolation <strong>of</strong> recent trends,<br />
modified by o<strong>the</strong>r relevant information that is available on harvest trends in different areas.<br />
4. Future reduction based on population models<br />
Ano<strong>the</strong>r possible approach to projecting future reduction is to use population dynamics<br />
information. The population dynamics <strong>of</strong> Greenheart was well studied by Zagt (1997), who<br />
estimated stage-based transition matrices for exploited <strong>and</strong> unexploited (undisturbed)<br />
st<strong>and</strong>s. The matrix for <strong>the</strong> undisturbed st<strong>and</strong> showed a slight decline (lambda=0.9978). The<br />
"exploited" st<strong>and</strong>, which was last harvested about 5 years prior to <strong>the</strong> study, showed a slight<br />
increase (lambda=1.0029). This may indicate density dependence, <strong>and</strong> <strong>the</strong>re is also<br />
increased individual (diametrical) growth at increased light levels. Zagt (1997) concluded<br />
based on <strong>the</strong>se that exploited st<strong>and</strong>s may recover, but <strong>the</strong>re are two caveats: <strong>the</strong> growth is<br />
very slow (<strong>and</strong> <strong>the</strong> difference between <strong>the</strong> growth rates <strong>of</strong> <strong>the</strong> two st<strong>and</strong>s is small); <strong>and</strong><br />
o<strong>the</strong>r co-occurring species respond more to increased light levels (Greenheart is more<br />
shade-tolerant).<br />
In principle, it should be possible to use <strong>the</strong> stage matrices estimated by Zagt (1997), add<br />
<strong>the</strong> actual levels <strong>of</strong> harvest in <strong>the</strong> past, start from <strong>the</strong> estimated 1850 population, <strong>and</strong><br />
simulate <strong>the</strong> population dynamics to estimate <strong>the</strong> past population reduction. If this approach<br />
leads to estimates similar to those based on surveys (as discussed above), <strong>the</strong>n it would be<br />
possible to use <strong>the</strong> same models to predict future dynamics, by starting from <strong>the</strong> estimated<br />
current population, adding <strong>the</strong> current levels <strong>of</strong> harvest, assuming that <strong>the</strong>y remain roughly<br />
constant into <strong>the</strong> future, <strong>and</strong> simulating <strong>the</strong> population dynamics to see what <strong>the</strong> population<br />
reduction is likely to be in <strong>the</strong> next 100 years. Combining this with past reduction would<br />
allow listing under Criterion A4.<br />
However, estimating population reduction based on simulations <strong>of</strong> population dynamics is<br />
difficult because density dependence complicates <strong>the</strong> dynamics in two ways. First, density<br />
dependence implies that <strong>the</strong> stage matrix should change in exploited st<strong>and</strong>s, as a function <strong>of</strong><br />
Page 3
time since harvest. But <strong>the</strong>re are only two estimated matrices, <strong>and</strong> many transitions are<br />
different between <strong>the</strong>m. In o<strong>the</strong>r words, <strong>the</strong>re is not just one change (or a few simple<br />
changes), which might be combined with a linearity assumption to come up with a density<br />
dependence function. Second, density dependence acts within st<strong>and</strong>s; it may not be correct<br />
to apply one simple density dependence function to <strong>the</strong> whole range. At any one time, <strong>the</strong><br />
parts <strong>of</strong> <strong>the</strong> range that remain unexploited presumably are at an equilibrium, <strong>and</strong> <strong>the</strong>re is<br />
increased growth in recently exploited st<strong>and</strong>s. So, it may not be realistic to assume an<br />
"average" or overall density dependence function; it may be necessary to simulate<br />
subpopulations in smaller areas. If <strong>the</strong>se difficulties can be overcome, future population<br />
reduction can be predicted based on <strong>the</strong> population dynamics <strong>of</strong> <strong>the</strong> species.<br />
References<br />
ARW 1998; Americas Regional Workshop (Conservation & Sustainable Management <strong>of</strong><br />
Trees, Costa Rica) 1998. Chlorocardium rodiei. In: <strong>IUCN</strong> 2006. 2006 <strong>IUCN</strong> <strong>Red</strong> <strong>List</strong><br />
<strong>of</strong> Threatened Species. . Downloaded on 20 February 2007.<br />
SPWG 2006; <strong>St<strong>and</strong>ards</strong> <strong>and</strong> <strong>Petitions</strong> <strong>Working</strong> <strong>Group</strong>. 2006. Guidelines for Using <strong>the</strong><br />
<strong>IUCN</strong> <strong>Red</strong> <strong>List</strong> Categories <strong>and</strong> Criteria. Version 6.2. Prepared by <strong>the</strong> <strong>St<strong>and</strong>ards</strong> <strong>and</strong><br />
<strong>Petitions</strong> <strong>Working</strong> <strong>Group</strong> <strong>of</strong> <strong>the</strong> <strong>IUCN</strong> SSC Biodiversity Assessments Sub-<br />
Committee in December 2006. Downloadable from<br />
http://app.iucn.org/webfiles/doc/SSC/<strong>Red</strong><strong>List</strong>/<strong>Red</strong><strong>List</strong>Guidelines.pdf.<br />
Steege, H. t., I. Welch, <strong>and</strong> R. Zagt. 2002. Long-term effect <strong>of</strong> timber harvesting in <strong>the</strong><br />
Bartica Triangle, Central Guyana. Forest Ecology <strong>and</strong> Management 170:127-144.<br />
Zagt, R. J. 1997. Tree demography in <strong>the</strong> tropical rain forest <strong>of</strong> Guyana. Tropenbos -<br />
Guyana Series 3. Tropenbos-Guyana Programme, Georgetown, Guyana.<br />
Page 4