Westside Parking Study Final Report - City Of Ventura
Westside Parking Study Final Report - City Of Ventura
Westside Parking Study Final Report - City Of Ventura

You also want an ePaper? Increase the reach of your titles
YUMPU automatically turns print PDFs into web optimized ePapers that Google loves.
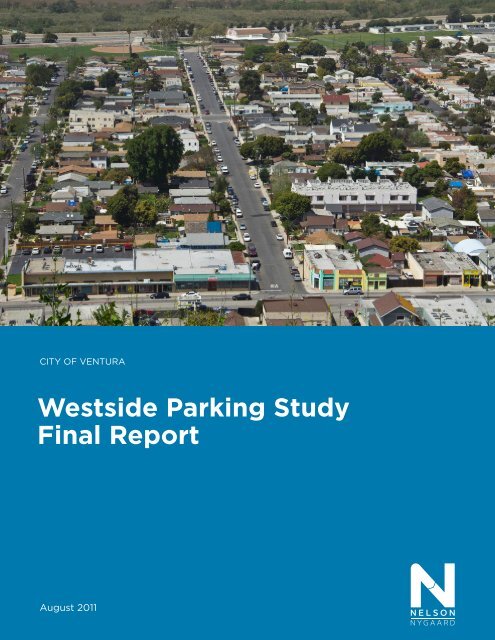
CITY OF VENTURA<br />
<strong>Westside</strong> <strong>Parking</strong> <strong>Study</strong><br />
<strong>Final</strong> <strong>Report</strong><br />
August 2011
<strong>Westside</strong> <strong>Parking</strong> <strong>Study</strong> • F inal <strong>Report</strong><br />
<strong>City</strong> of <strong>Ventura</strong><br />
Table of Contents<br />
Page<br />
Executive Summary ............................................................................................................................... ES-1<br />
Overview ............................................................................................................................................................... ES-1<br />
<strong>Parking</strong> Management Planning Approach ............................................................................................................ ES-2<br />
Purpose of the <strong>Parking</strong> <strong>Study</strong> <strong>Report</strong> ................................................................................................................... ES-2<br />
Existing <strong>Parking</strong> Conditions .................................................................................................................................. ES-2<br />
Summary of <strong>Parking</strong> Management Plan Recommendations ................................................................................ ES-9<br />
Chapter by Chapter ............................................................................................................................................ ES-14<br />
Chapter 1. Existing Conditions ................................................................................................................ 1-1<br />
Current Demographics and Travel Characteristics ................................................................................................. 1-5<br />
<strong>Parking</strong> Inventory and Regulations ........................................................................................................................1-10<br />
<strong>Parking</strong> Utilization and Turnover ............................................................................................................................1-16<br />
Chapter 2. Current and Future <strong>Parking</strong> Demand .................................................................................... 2-1<br />
Inventory, Occupancy, and Oversupply .................................................................................................................. 2-1<br />
Peak Demand in <strong>Study</strong> Area .................................................................................................................................. 2-2<br />
Minimum <strong>Parking</strong> Requirements ............................................................................................................................. 2-5<br />
Chapter 3. <strong>Parking</strong> Management Plan ..................................................................................................... 3-1<br />
Principles of Effective <strong>Parking</strong> Management .......................................................................................................... 3-1<br />
Recommendations .................................................................................................................................................. 3-2<br />
Appendix A. Best Practices in <strong>Parking</strong> Management ........................................................................... A-1<br />
Case <strong>Study</strong> 1 - Old Pasadena, California ............................................................................................................... A-1<br />
Case <strong>Study</strong> 2 - Petaluma, California SmartCode.................................................................................................... A-3<br />
Case <strong>Study</strong> 3 - Boulder, Colorado .......................................................................................................................... A-5<br />
Page i • Nelson\Nygaard Consulting Associates Inc.
<strong>Westside</strong> <strong>Parking</strong> <strong>Study</strong> • F inal <strong>Report</strong><br />
<strong>City</strong> of <strong>Ventura</strong><br />
Table of Figures<br />
Page<br />
Figure ES-1 <strong>Ventura</strong> <strong>Westside</strong> <strong>Parking</strong> <strong>Study</strong> Area ........................................................................................... ES-5<br />
Figure ES-2 Peak Hour Utilization, Thursday 6 PM ............................................................................................ ES-6<br />
Figure ES-3 Utilization by Zone at <strong>Study</strong> Area Peak Period, 6 PM ..................................................................... ES-7<br />
Figure ES-4 <strong>Parking</strong> Demand – Mixed Land Use to Built Supply ....................................................................... ES-8<br />
Figure ES-5 Proposed <strong>Parking</strong> Requirements for Selected Land Uses ............................................................ ES-11<br />
Figure 1-1 <strong>Ventura</strong> <strong>Westside</strong> <strong>Parking</strong> <strong>Study</strong> Area .............................................................................................. 1-3<br />
Figure 1-2 Race/Ethnicity, <strong>Study</strong> Area vs. <strong>City</strong> of <strong>Ventura</strong> (2010) ...................................................................... 1-5<br />
Figure 1-3 Race/Ethnicity in <strong>Study</strong> Area (2000 vs. 2010) ................................................................................... 1-6<br />
Figure 1-4 Resident Journey to Work, <strong>Study</strong> Area vs. <strong>City</strong> of <strong>Ventura</strong> ............................................................... 1-7<br />
Figure 1-5 Non-resident Journey to Work, <strong>Study</strong> Area vs. <strong>City</strong> of <strong>Ventura</strong> (2000).............................................. 1-7<br />
Figure 1-6 Vehicles per Household, <strong>Study</strong> Area vs. <strong>City</strong> of <strong>Ventura</strong> ................................................................... 1-8<br />
Figure 1-7 Housing Tenure, <strong>Study</strong> Area vs. <strong>City</strong> of <strong>Ventura</strong> (2000).................................................................... 1-9<br />
Figure 1-8 Vehicle Ownership by Household Income, <strong>Study</strong> Area (1999 dollars) ............................................ 1-10<br />
Figure 1-9 On-street <strong>Parking</strong> Regulations ......................................................................................................... 1-13<br />
Figure 1-10 <strong>Study</strong> Area <strong>Parking</strong> Facilities, by Type ............................................................................................ 1-15<br />
Figure 1-11 <strong>Study</strong> Area <strong>Parking</strong> Facilities, by Zone ............................................................................................ 1-15<br />
Figure 1-12 Utilization Rates, Overall <strong>Study</strong> Area ............................................................................................... 1-17<br />
Figure 1-13 Utilization Rates by Facility Type, Thursday .................................................................................... 1-18<br />
Figure 1-14 Utilization Rates by Facility Type, Saturday .................................................................................... 1-18<br />
Figure 1-15 Peak Hour Utilization, Thursday 6 PM ............................................................................................. 1-21<br />
Figure 1-16 Peak Hour Utilization, Saturday 6 PM ............................................................................................. 1-22<br />
Figure 1-17 Utilization Rates, Thursday 1 PM .................................................................................................... 1-23<br />
Figure 1-18 Utilization Rates, Saturday 1 PM ..................................................................................................... 1-24<br />
Figure 1-19 Utilization Rates by Zone, Thursday ................................................................................................ 1-25<br />
Figure 1-20 Utilization Rates by Zone, Saturday ................................................................................................ 1-26<br />
Figure 1-21 Utilization by Zone at <strong>Study</strong> Area Peak Period, 6 PM ...................................................................... 1-26<br />
Figure 1-22 Average Vehicle Duration, by Zone ................................................................................................. 1-27<br />
Figure 1-23 Utilization Rates, North <strong>Ventura</strong> Avenue ......................................................................................... 1-27<br />
Figure 2-1 Occupancy, Inventory, and Oversupply – Thursday 6 PM ................................................................. 2-1<br />
Figure 2-2 Occupancy, Inventory, and Oversupply – Saturday 6 PM ................................................................. 2-2<br />
Figure 2-3 <strong>Parking</strong> Demand – Mixed Land Use to Built Supply .......................................................................... 2-3<br />
Figure 2-4 Built <strong>Parking</strong> Supply and Actual Demand, Selected Cities ................................................................ 2-4<br />
Page ii • Nelson\Nygaard Consulting Associates Inc.
<strong>Westside</strong> <strong>Parking</strong> <strong>Study</strong> • F inal <strong>Report</strong><br />
<strong>City</strong> of <strong>Ventura</strong><br />
Figure 2-5 Existing Municipal Minimum <strong>Of</strong>f-street <strong>Parking</strong> Requirements ......................................................... 2-5<br />
Figure 2-6 Existing Minimum <strong>Parking</strong> Requirements vs. Building Square Footage ........................................... 2-6<br />
Figure 3-1 Recommended Revised <strong>Parking</strong> Requirements for Selected Land Uses ......................................... 3-6<br />
Figure 3-2 Average Vehicle Duration on North <strong>Ventura</strong> Avenue .......................................................................3-14<br />
Figure A-1 <strong>Of</strong>f-Street <strong>Parking</strong> Facilities in Old Pasadena ................................................................................... A-2<br />
Figure A-2 Boulder Neighborhood Permit <strong>Parking</strong> Program Revenue and Expenditure, 2009 ........................... A-6<br />
Page iii • Nelson\Nygaard Consulting Associates Inc.
<strong>Westside</strong> <strong>Parking</strong> <strong>Study</strong> • F inal <strong>Report</strong><br />
<strong>City</strong> of <strong>Ventura</strong><br />
Executive Summary<br />
Overview<br />
The <strong>Westside</strong> Community of <strong>Ventura</strong> is one of the <strong>City</strong>’s oldest and most diverse areas – a<br />
working class neighborhood once defined by <strong>Ventura</strong>’s oil industry. With the decline of the oil<br />
business, the <strong>Westside</strong> area is reshaping itself to be a more livable community for its residents<br />
and transforming itself to include more cultural amenities as well as commercial and green<br />
industrial jobs development to stimulate growth.<br />
These revitalization efforts have taken many forms in recent years, emphasizing a communitydriven<br />
process that seeks to capitalize on the area’s existing assets. These efforts include the<br />
<strong>Westside</strong> Urban Design Plan (1999), <strong>Westside</strong> Revitalization Strategy (2002), <strong>Westside</strong><br />
Economic Development Strategy (2006), <strong>City</strong> of <strong>Ventura</strong> Economic Development Strategy (2005-<br />
10), and <strong>Westside</strong> Historic Context and Survey <strong>Report</strong> (2011). In addition, the <strong>City</strong> is also<br />
exploring the development of the <strong>Westside</strong> Redevelopment Area Project (WRAP) 1 .<br />
These plans have recently coalesced into the <strong>Westside</strong> Community Planning Project, which will<br />
ultimately result in the development of a final <strong>Westside</strong> Community Plan and Development Code.<br />
A draft of the Plan and Code was released in April 2011. It articulates a vision for a revitalized<br />
<strong>Westside</strong> Community that seeks to preserve its neighborhood heritage while enhancing multimodal<br />
travel options. The plan’s community vision states its intent:<br />
“To create an interconnected, revitalized <strong>Westside</strong> community that improves over<br />
time by preserving neighborhood heritage, supporting and expanding the vibrant<br />
arts community, requiring well designed development, increasing urban plazas and<br />
green spaces, enhancing multi-modal travel options, and expanding jobs, with an<br />
emphasis on green technology and high tech sector opportunities.”<br />
The Plan also underscores the need to improve both the mobility and accessibility to, from and<br />
within the <strong>Westside</strong> Community. As one way to meet that objective, the <strong>City</strong> has identified a<br />
specific goal related to improving parking management not just on <strong>Ventura</strong> Avenue, but<br />
throughout the adjacent neighborhood. The <strong>City</strong> of <strong>Ventura</strong> has realized that striking the proper<br />
balance between parking supply, demand, and availability is necessary to achieving the <strong>City</strong>’s<br />
economic, environmental, and quality-of-life goals for the <strong>Westside</strong> Community.<br />
It is essential to continue the <strong>Westside</strong>’s ongoing revitalization and to restore and enhance this<br />
area as a vibrant social and economic center for the <strong>City</strong>. To advance this process, the <strong>City</strong> of<br />
<strong>Ventura</strong> seeks to develop a clear parking management plan to help the <strong>Westside</strong> Community<br />
accomplish the following goals, policies, and actions steps, as defined by the Draft <strong>Westside</strong><br />
Community Plan:<br />
• Goal: Encourage various modes of travel by providing infrastructure for buses, bikes and<br />
pedestrians as well as cars and improved connections from the <strong>Ventura</strong> River Trail to<br />
neighborhoods to the hillsides.<br />
• Goal: Improve parking along <strong>Ventura</strong> Avenue for commercial business customers.<br />
• Policy 12 U: Reduce dependence on the automobile in the <strong>Westside</strong> Community.<br />
1 The elimination of redevelopment agencies in California was recently approved as part of the 2011-12 California State<br />
Budget. However, it is likely that issues related to redevelopment will ultimately be decided as part of future legal<br />
decisions.<br />
Nelson\Nygaard Consulting Associates Inc. • Page ES-1
<strong>Westside</strong> <strong>Parking</strong> <strong>Study</strong> • F inal <strong>Report</strong><br />
<strong>City</strong> of <strong>Ventura</strong><br />
• Action 12.4.17: Prepare a <strong>Westside</strong> <strong>Parking</strong> <strong>Study</strong> to assess supply and demand and<br />
recommend revised parking standards for the <strong>Westside</strong>.<br />
• Action 12.4.18: Provide for shared parking and transportation improvements.<br />
• Action 12.4.19: Require all new development to contribute toward a Transportation<br />
Demand Management (TDM) fund to be used to develop community, <strong>City</strong>, and regional<br />
transportation programs that reduce transportation related air pollutants.<br />
This parking management plan is intended to function as a “blueprint” that will allow <strong>City</strong> staff to<br />
manage parking to achieve the dynamic vision called for in the <strong>Westside</strong> Community Plan.<br />
<strong>Parking</strong> Management Planning Approach<br />
Nelson\Nygaard’s approach in undertaking this work was as follows:<br />
• Analyzed transportation and parking opportunities and challenges in the <strong>Westside</strong><br />
Community, including a review of existing documents, plans, data, and policies, combined<br />
with several site visits.<br />
• Completed an original data collection effort that assessed existing parking conditions for<br />
on- and off-street facilities throughout the study area.<br />
• Conducted a parking demand analysis that examined current land uses and future<br />
development potential in the <strong>Westside</strong> Community.<br />
• Completed a comprehensive review of best practices in transportation and parking<br />
management, with special emphasis on communities comparable to <strong>Ventura</strong> and the<br />
potential use of strategies applicable to the <strong>Westside</strong> Community (see Appendix A).<br />
• Developed cost-effective strategies and program recommendations designed to:<br />
o<br />
o<br />
Make the most efficient use of the existing parking supply.<br />
Plan for future parking demand in accommodating economic growth.<br />
Purpose of the <strong>Parking</strong> <strong>Study</strong> <strong>Report</strong><br />
The <strong>City</strong>’s Draft <strong>Westside</strong> Community Planning Project establishes a clear vision for the future of<br />
the <strong>Westside</strong> Community. This parking study is the result of the planning approach described<br />
above and presents Nelson\Nygaard’s recommendations for the most cost-effective strategies for<br />
meeting the <strong>Westside</strong> Community’s goals.<br />
The recommendations in this parking study are established on the premise that parking and<br />
transportation are not ends in themselves, but means to achieve broader community goals.<br />
These recommendations leverage the <strong>Westside</strong>’s existing assets, respond to its challenges, and<br />
will further the overall vision for the area.<br />
Existing <strong>Parking</strong> Conditions<br />
Inventory, Utilization, and Turnover<br />
<strong>Parking</strong> supply and utilization was analyzed for the <strong>Westside</strong> as a whole and separately within<br />
four zones (see Figure ES-1). A total of 3,311 parking stalls are located within the study zone:<br />
2,611 on-street and 700 off-street. To evaluate parking occupancy, parking occupancy counts<br />
Nelson\Nygaard Consulting Associates Inc. • Page ES-2
<strong>Westside</strong> <strong>Parking</strong> <strong>Study</strong> • F inal <strong>Report</strong><br />
<strong>City</strong> of <strong>Ventura</strong><br />
were taken from 8 AM to 6 PM on Thursday, June 16 and Saturday, June 18, 2011. The counted<br />
parking supply included accessible on-street and off-street, public and private spaces; spaces<br />
obstructed by construction or physical barriers such as fences were excluded in the counts.<br />
Total occupancy counts show that at the busiest period (Thursday, 6 PM – 7 PM), just 43%<br />
of the area’s parking supply was occupied, with on and off-street spaces showing<br />
significantly different occupancy rates (48% and 25% respectively). At this peak hour,<br />
1,880 of the 3,311 spaces in the parking supply were vacant. Peak occupancy counts during<br />
the mid-day (Thursday, 1 PM – 2 PM) revealed lower occupancy rates with a total demand of<br />
40% with both on and off-street spaces showing roughly the same percentages of spaces<br />
occupied (41% and 40% respectively).<br />
The utilization rates are far below target rates. Target occupancy rates of 85% and 90% are<br />
effective industry-standards for analyzing the demand for on- and off-street spaces, respectively.<br />
In other words, maintaining 15% and 10% vacancy rates for corresponding on- and off-street<br />
stalls help to ensure an “effective parking supply.” It is at these standard occupancy levels that<br />
roughly one space per block is available, making searching or “cruising” for parking unnecessary,<br />
and off-street lots maintain adequate maneuverability. Utilization rates much below these targets<br />
indicate a diminished economic return on investment in parking facilities.<br />
Based on the occupancy data for the study area, a number of observations can be made. First,<br />
the amount of retail/commercial activity or jobs in the study area does not result in dramatic<br />
overall fluctuations of parking demand (although off-street occupancies do increase). One<br />
possibility is that any influx of people into the study area during the weekday is offset by residents<br />
leaving to go to work. Second, the peak hour of 6 PM on both Thursday and Saturday is reflective<br />
of a residential neighborhood that experiences a spike in parking occupancy when residents<br />
return home from work. <strong>Final</strong>ly, activity in private off-street lots at businesses is far lower on<br />
Saturdays than on Thursdays.<br />
Figure ES-2 shows the peak hour occupancy map of the study area (Thursday, 6 PM). The map<br />
shows the occupancy level for each individual block face and each individual lot during the peak<br />
hour of parking demand. The map reveals that there are some limited “pockets” of high demand<br />
on a few blocks and in some lots in the study area. For example, several of the streets<br />
surrounding De Anza Middle School and Harry A. Lyon Park had occupancies above 75% on<br />
Thursday.<br />
Another area of high demand is around the Red Barn Market at North <strong>Ventura</strong> Avenue and West<br />
Warner Street. The Red Barn Market parking lot experiences some of the highest occupancy<br />
rates of any lot in the study area. In addition, it is likely that the nearby streets are also used by<br />
Red Barn customers. However, it appears that this parking “spillover” is limited to only one or two<br />
blocks, and numerous nearby block faces or lots within walking distance to the Red Barn Market<br />
are underutilized. As a result of these trends, overall parking demand remains very low for the<br />
study area as a whole.<br />
Nelson\Nygaard Consulting Associates Inc. • Page ES-3
<strong>Westside</strong> <strong>Parking</strong> <strong>Study</strong> • F inal <strong>Report</strong><br />
<strong>City</strong> of <strong>Ventura</strong><br />
This page intentionally left blank.<br />
Nelson\Nygaard Consulting Associates Inc. • Page ES-4
<strong>Westside</strong> <strong>Parking</strong> <strong>Study</strong> • F inal <strong>Report</strong><br />
<strong>City</strong> of <strong>Ventura</strong><br />
Figure ES-1 <strong>Ventura</strong> <strong>Westside</strong> <strong>Parking</strong> <strong>Study</strong> Area<br />
Nelson\Nygaard Consulting Associates Inc. • Page ES-5
<strong>Westside</strong> <strong>Parking</strong> <strong>Study</strong> • F inal <strong>Report</strong><br />
<strong>City</strong> of <strong>Ventura</strong><br />
Figure ES-2 Peak Hour Utilization, Thursday 6 PM<br />
Nelson\Nygaard Consulting Associates Inc. • Page ES-6
<strong>Westside</strong> <strong>Parking</strong> <strong>Study</strong> • F inal <strong>Report</strong><br />
<strong>City</strong> of <strong>Ventura</strong><br />
Zonal occupancy rates fluctuate somewhat based on the type of parking (on- or off-street) and<br />
day of week. Figure ES-3 summarizes the utilization rates by zone during the peak period of<br />
demand on both Thursday (6 PM) and Saturday (6 PM). On each day Zones 1 and 2 had the<br />
highest occupancy levels, while Zones 3 and 4 experienced substantially less demand. Once<br />
again, however, all of these zones had parking demand far below that of the 85% to 90% target<br />
levels, indicating that there is an ample supply of parking in the study area.<br />
Figure ES-3 Utilization by Zone at <strong>Study</strong> Area Peak Period, 6 PM<br />
On & <strong>Of</strong>f-Street<br />
On-street<br />
<strong>Of</strong>f-street<br />
Zone<br />
Combined<br />
Thursday Saturday Thursday Saturday Thursday Saturday<br />
Zone 1 49% 50% 31% 28% 45% 45%<br />
Zone 2 49% 50% 38% 35% 47% 47%<br />
Zone 3 50% 44% 25% 4% 36% 31%<br />
Zone 4 38% 37% 0% 3% 32% 31%<br />
Utilization rates were also calculated specifically along North <strong>Ventura</strong> Avenue only (which<br />
stretches through all four zones). <strong>Parking</strong> demand peaked on North <strong>Ventura</strong> Avenue on Thursday<br />
at 10 AM with 42% of on-street spaces occupied. It is also evident that utilization of on-street<br />
spaces on North <strong>Ventura</strong> Avenue is higher on Thursday than on Saturday with utilization rates<br />
reaching their lowest at 8 AM in the morning. Given the lower occupancy rates at the beginning<br />
and end of the counting periods, it is clear that residents in the study area do not typically park<br />
along North <strong>Ventura</strong> Avenue over night and this corridor becomes more occupied throughout the<br />
day as people visit businesses or other destinations in the study area.<br />
In addition to analyzing parking utilization, parking duration data for on-street spaces was also<br />
collected to gauge how often each space experiences “turnover.” This data was collected at the<br />
same time as the occupancy survey and involved surveyors noting the last 4 digits of each<br />
license plate, which can be used to identify vehicles without collecting any personal information.<br />
For the study area, turnover was similar for both Thursday and Saturday. On Thursday, it was<br />
estimated that vehicles stayed for an average of 3.38 hours. Average vehicle duration on<br />
Saturday was estimated to be slightly less at 3.30 hours. On North <strong>Ventura</strong> Avenue, the average<br />
duration for a given vehicle was 2.91 hours and 1.52 hours on Thursday and Saturday,<br />
respectively. The duration of these stays is lower than for the study area as a whole, most likely<br />
due to North <strong>Ventura</strong> Avenue being one of the few streets to have any time restrictions for its onstreet<br />
spaces.<br />
The key conclusion that we draw from these occupancy counts is that there is a<br />
significant amount of vacant parking in every zone analyzed in the study area at peak<br />
hour. Although there are pockets of high demand near the De Anza Middle School and<br />
Red Barn Market, there are more parking spaces vacant than occupied. As such, any new<br />
development has a large amount of vacant parking supply to draw from prior to the<br />
construction of new spaces, provided that residential neighborhood spillover does not<br />
occur. Turnover rates indicate that vehicles are remaining longer than time restrictions<br />
allow on North <strong>Ventura</strong> Avenue, but due to the very low occupancy rates, this does not<br />
appear to be a significant issue.<br />
Nelson\Nygaard Consulting Associates Inc. • Page ES-7
<strong>Westside</strong> <strong>Parking</strong> <strong>Study</strong> • F inal <strong>Report</strong><br />
<strong>City</strong> of <strong>Ventura</strong><br />
Existing and Future <strong>Parking</strong> Demand Ratios<br />
Utilizing the data gathered during the parking inventory as well as an inventory of existing land<br />
use and projected land uses, existing parking demand ratios were calculated, and these parking<br />
ratios were then used to estimate future parking demand.<br />
• Built Stalls to Built Land Use Ratio. This represents the total number of existing parking<br />
stalls correlated to total existing land use square footage (occupied or vacant) within the<br />
study area. According to data provided by the <strong>City</strong>, there is approximately 1,153,392 gross<br />
square feet (GSF) of land uses 2 in the study zone. At this time, about 2.87 parking stalls<br />
per 1,000 GSF of built land use have been developed/provided within the study area<br />
(combining the on and off-street parking supplies).<br />
• Combined Peak Demand to Occupied Land Use Ratio. This represents peak hour<br />
occupancy within the entire study area combining the on and off-street supply. As such,<br />
actual parked vehicles were correlated with actual occupied building area (approximately<br />
1,133,458 GSF). From this perspective, current peak hour demand stands at a ratio of<br />
approximately 1.26 occupied parking stalls per 1,000 GSF of built land use.<br />
Figure ES-4 summarizes the analysis used to determine the built ratio of parking to built land use<br />
(i.e., Column D), which is based on the correlation between total built land use of 1,153,392 GSF<br />
(Column A – Built) and 3,311 stalls of “built” parking supply (i.e., Column C). As such, the built<br />
ratio of parking is 2.87 stalls per 1,000 GSF of commercial/retail building area.<br />
Figure ES-4 also demonstrates that the actual demand for parking is approximately 1.26<br />
occupied stalls per 1,000 GSF (Column F). This number is derived by correlating actual occupied<br />
building area of 1,139,118 GSF (Column B) to the 1,431 vehicles actually parked in the peak hour<br />
(Column E).<br />
Figure ES-5 also breaks out this data by zone, and reveals that Zones 1 and 2 have the highest<br />
peak demand ratios (1.39 per 1,000 GSF), while Zone 3 (.98) and Zone 4 (.87) have considerably<br />
lower demand during the peak period.<br />
Figure ES-4 <strong>Parking</strong> Demand – Mixed Land Use to Built Supply 3<br />
A B C D E F<br />
Geographic<br />
Area<br />
GSF (Built)<br />
GSF<br />
(Occupied) 4<br />
Total Supply<br />
Inventoried<br />
in <strong>Study</strong> Area<br />
Built Ratio of<br />
<strong>Parking</strong> (per<br />
1,000 GSF)<br />
Total<br />
Occupied<br />
Spaces in<br />
Peak Hour<br />
Actual Ratio<br />
of <strong>Parking</strong><br />
Demand (per<br />
1,000 GSF)<br />
<strong>Study</strong> Area 1,153,392 1,133,458 3,311 2.87 1,431 1.26<br />
Zone 1 407,301 400,530 1,235 3.03 558 1.39<br />
Zone 2 426,526 418,186 1,230 2.88 580 1.39<br />
Zone 3 186,045 182,033 489 2.63 178 0.98<br />
Zone 4 133,520 132,710 357 2.67 115 0.87<br />
2 Includes four general land use categories: residential, commercial, industrial, and civic.<br />
3 <strong>Study</strong> area peak utilization – Thursday, 6 PM<br />
4 Assumes the following vacancy rates: Retail (2%), <strong>Of</strong>fice (12.5%), Civic (0%), Residential (0%), and Industrial (4.6%)<br />
Nelson\Nygaard Consulting Associates Inc. • Page ES-8
<strong>Westside</strong> <strong>Parking</strong> <strong>Study</strong> • F inal <strong>Report</strong><br />
<strong>City</strong> of <strong>Ventura</strong><br />
If in the future parking were provided at the rate of actual demand absorption (1.26), overall peak<br />
hour occupancies would near 100% only if parking remained free and close to 1.5 million square<br />
feet of new development were constructed in the area. Put another way, there is currently 1.1<br />
million square feet of occupied built space resulting in 1,431 occupied parking spaces. In order to<br />
fill the remaining 1,880 vacant spaces in the area, up to another 1.5 million square feet could be<br />
added without any new parking being constructed. If any level of parking pricing were to be<br />
instituted in the future, peak hour occupancies would be less than 100%, particularly if prices<br />
were set to recommended levels to ensure a 15% vacancy rate.<br />
To date, parking has been built at an average rate of 2.87 stalls per 1,000 GSF of development in<br />
the <strong>Westside</strong> study area. This rate appears to have provided surplus parking with significant<br />
availability in both existing on and off-street facilities, especially given that land uses in the study<br />
area only generate parking demand ratios of 1.26 stalls per 1,000 GSF. According to this<br />
analysis, approximately 1,880 stalls are empty and available at the peak of the peak hour (1,358<br />
on-street and 522 off-street). This surplus of parking allows for future development to make use<br />
of existing spaces prior to the construction of new parking.<br />
Summary of <strong>Parking</strong> Management Plan<br />
Recommendations<br />
The <strong>Parking</strong> Management Plan’s recommendations, described in full in Chapter 3, are designed<br />
to meet several community goals. Historically, “solving the parking problem” almost always<br />
meant increasing supply. Unfortunately, constantly increasing parking supply simply encourages<br />
more auto use, as people are encouraged to drive to places that offer “plenty of free parking.”<br />
While providing adequate parking is still important, it is only one tool available for managing both<br />
demand and supply. The goal of “parking demand management” is to provide the optimal amount<br />
of parking to meet parking needs while reducing traffic congestion, encouraging alternate<br />
transportation and accommodating new development and a variety of land uses.<br />
Managing parking has been shown to be the single most effective tool for managing congestion,<br />
even when densities are relatively low and major investments in other modes have not been<br />
made. <strong>Parking</strong> management can also have a significant impact on commute mode choice, which<br />
translates directly to reductions in auto congestion and improved livability of commercial districts<br />
and adjacent neighborhoods.<br />
As the <strong>Westside</strong> Community continues to grow and evolve its parking needs will change as well,<br />
and this <strong>Parking</strong> Management Plan recommends techniques to both address current challenges<br />
and adjust to future needs. Above all else, the <strong>Parking</strong> Management Plan proposes a parking<br />
management approach that utilizes policies and programs that will enable more efficient<br />
utilization of existing supply, while alleviating parking congestion in certain areas.<br />
In recognition of these considerations, the following principles informed the development of<br />
parking management recommendations for the <strong>Westside</strong> Community:<br />
• Set clear parking priorities based on the <strong>Westside</strong> Community’s strengths and vision for<br />
the future.<br />
• Manage the entire parking supply as part of an integrated system.<br />
• Manage parking facilities with a focus on maintaining availability, not simply increasing<br />
supply.<br />
Nelson\Nygaard Consulting Associates Inc. • Page ES-9
<strong>Westside</strong> <strong>Parking</strong> <strong>Study</strong> • F inal <strong>Report</strong><br />
<strong>City</strong> of <strong>Ventura</strong><br />
• Optimize investment in parking by making most efficient use of all public and private<br />
parking facilities and encouraging use of viable alternative mode options, before<br />
constructing new parking.<br />
• Use any potential parking revenue to fund programs that maintain adequate parking<br />
supply and support use of transportation options.<br />
• Use of residential permit districts to address spillover concerns in neighborhoods where<br />
supported by local residents.<br />
• Encourage economic revitalization and remove barriers to development and adaptive<br />
reuse projects by adopting parking standards that are tailored to the unique parking<br />
demand of a mixed-use, complete street community.<br />
• Ensure flexibility for developers by providing a variety of tools to meet and/or reduce<br />
parking requirements when deemed appropriate by a parking analysis of the project.<br />
• Provide flexibility to local decision makers and <strong>City</strong> staff to adapt to future changes in<br />
parking demand and travel patterns.<br />
This plan recommends seven measures to address these principles, manage the <strong>Westside</strong><br />
community’s transportation system and stimulate economic activity.<br />
Recommendation 1: Pursue a Consolidated <strong>Parking</strong> Strategy<br />
The <strong>Westside</strong> Community should officially adopt and implement a consolidated parking policy,<br />
where all parking is managed as an integrated system. The primary impetus for this<br />
recommendation is that current demand (or new construction of up to 1.5 million square feet) in<br />
the <strong>Westside</strong> area does not warrant the provision of additional supply. Chapter 1 highlights the<br />
low parking utilization rates in the study with no zone approaching target rates. Furthermore,<br />
while there may be one or two hour periods or small areas with higher demand, available on- or<br />
off-street spaces are never more than one or two blocks away. The fundamental goal of a<br />
consolidated parking policy is to make efficient use of the existing parking supply by including as<br />
many spaces as possible in a common pool of shared, publicly available spaces.<br />
The key management strategies for a consolidated parking district will include:<br />
• Continue to encourage all existing and new private parking facilities to be made available<br />
to the public when not needed by its principal user (Recommendation 1.A).<br />
• Continue to encourage shared parking between uses in all existing and new private<br />
parking facilities wherever feasible (Recommendation 1.B).<br />
• Develop new parking supply only as needed by maximizing the use of existing off-street<br />
parking and/or first purchasing or leasing existing private parking lots from willing sellers<br />
(Recommendation 1.C).<br />
Recommendation 2: Revise <strong>Parking</strong> Standards<br />
As discussed in Chapter 2, the <strong>City</strong> of <strong>Ventura</strong>’s existing minimum parking requirements are<br />
incompatible with existing parking demand in the <strong>Westside</strong> Community. In short, the existing<br />
minimums require far more parking spaces than is currently needed. More specifically, the<br />
utilization study found that the built ratio of parking was 2.87 parking stalls per 1,000 GSF of<br />
development. However, based on the utilization study it was found that the actual ratio of parking<br />
demand was 1.26 parking stalls per 1,000 GSF of occupied space. In addition, current minimum<br />
parking requirements for the <strong>Westside</strong> Community often require more than one square foot of<br />
Nelson\Nygaard Consulting Associates Inc. • Page ES-10
<strong>Westside</strong> <strong>Parking</strong> <strong>Study</strong> • F inal <strong>Report</strong><br />
<strong>City</strong> of <strong>Ventura</strong><br />
parking area for every square foot of building. These requirements are especially prohibitive for<br />
any type of adaptive reuse project, as it severely restricts how developers meet parking<br />
requirements on-site.<br />
Therefore, as the <strong>City</strong> moves forward with developing its <strong>Westside</strong> Development Code, it is<br />
recommended that the <strong>City</strong> adjust its minimum parking requirements for the <strong>Westside</strong><br />
Community. Figure ES-5 shows proposed parking requirements for selected land uses and<br />
zones. It includes revised minimum requirements and also proposes a maximum parking<br />
requirement for non-residential uses in the T5.5 (Urban Center Zone) zone at 4 spaces per 1,000<br />
square feet. A parking “maximum” estimates the greatest number of spaces that should be<br />
needed as reserved spaces without unduly burdening the on-street or locally shared-parking<br />
supply, or threatening the development potential of the site.<br />
Figure ES-5 Proposed <strong>Parking</strong> Requirements for Selected Land Uses 5<br />
Land Use Category<br />
Metric<br />
Proposed T3.6<br />
Existing T3.6<br />
Proposed T3.5<br />
Existing T3.5<br />
Proposed T4.11<br />
Existing T4.11<br />
Proposed T5.5<br />
Existing T5.5<br />
Proposed SD1<br />
Existing SD1<br />
(-) Use not permitted<br />
Single-<br />
Family Multi-Family Live-Work<br />
Non-<br />
Residential<br />
Industrial/<br />
Warehouse<br />
1 BDR 2 BDR 3+ BDR<br />
Unit Unit Unit Unit Unit 1,000 SF 1,000 SF<br />
Min 2 - - - - - -<br />
Max None - - - - - -<br />
Min 2 1 2 + 1/4 guest space/unit - 3.33 3.33<br />
Max None None None - None None<br />
Min 2 1 1.5 2 - 1 -<br />
Max<br />
None None None None - None -<br />
Min 2 - - - - - -<br />
Max<br />
None - - - - - -<br />
Min 2 1 1.5 2 - 1 -<br />
Max None None None None - None -<br />
Min 2 1 2 + 1/4 guest space/unit - 2 2<br />
Max None None None - None None<br />
Min - 1 1 1 - None -<br />
Max - None None None - 4 -<br />
Min 1 1 1 1 - 2 2<br />
Max None None None None - None None<br />
Min - - - - 1 1 0.5<br />
Max - - - - None None None<br />
Min 2 3.33 1-2*<br />
Max None None None<br />
* For industrial uses, 2 parking spaces/1000SF or 1 parking space/1000SF when providing alternative transportation facilities. For<br />
warehouse uses, 1 parking space/1000SF<br />
5 See Preliminary Draft <strong>Westside</strong> Development Code for more detailed information on each zone.<br />
Nelson\Nygaard Consulting Associates Inc. • Page ES-11
<strong>Westside</strong> <strong>Parking</strong> <strong>Study</strong> • F inal <strong>Report</strong><br />
<strong>City</strong> of <strong>Ventura</strong><br />
Recommendation 3: Create Flexibility to Meet/Reduce <strong>Parking</strong> Requirements<br />
One of the primary challenges associated with minimum parking requirements is that they force<br />
developers to provide expensive parking spaces even if the amount of parking required is not<br />
consistent with actual demand. The end result is a more expensive project or the allocation of<br />
land to provide parking that could potentially limit the amount and scale of development, or make<br />
a project infeasible altogether. While minimum parking standards in the <strong>Westside</strong> Community are<br />
only recommended to be adjusted in targeted ways, this <strong>Parking</strong> Management Plan strongly<br />
suggests expanding opportunities for developers to comply with minimum parking requirements<br />
through allowing a variety of “state of the practice” parking management techniques.<br />
These techniques would not reduce parking minimums themselves, but provide a toolkit that<br />
allows a developer to meet their requirement in the most efficient way possible. By providing<br />
developers with the option and flexibility to meet parking standards, the <strong>City</strong> can promote an<br />
environment that is both friendly to development and supportive of multimodal and sustainable<br />
growth. These options include:<br />
• Allow for lower minimums by right if the proposed project can demonstrate a long-term<br />
Transportation Demand Management (TDM) program that has self-sufficient funding<br />
(Recommendation 3.A).<br />
• Allow shared on- and off-street spaces to count towards parking minimums<br />
(Recommendation 3.B).<br />
• Allow for parking exemptions for commercial/retail changes of use smaller than 5,000<br />
square feet (Recommendation 3.C).<br />
Recommendation 4: Establish guidelines for a future residential permit program (RPP)<br />
in the <strong>Westside</strong> Community. Explore potential for a residential parking benefit district.<br />
Residential permit programs (RPP) are one of the most effective tools at managing spillover into<br />
residential neighborhoods. The <strong>City</strong> of <strong>Ventura</strong> currently has a Downtown <strong>Parking</strong> Permit<br />
Program, Medical District and School Area Permit Programs that can also be similarly applied to<br />
the project area. Like most RPPs these programs operate by exempting permitted vehicles from<br />
the parking restrictions and time limits within a geographically defined area. Permit holders are<br />
able to park their vehicle on the street for up to 36 hours, although holding a permit does not<br />
guarantee the availability of a parking space.<br />
RPPs work best and can protect residential neighborhoods that are impacted by spillover from<br />
other uses, particularly competing demand from employees at nearby businesses or at large<br />
institutions such as hospitals, schools, or colleges. RPPs are also commonly used in<br />
neighborhoods that are impacted by regional commuters who might want to drive and park in a<br />
neighborhood that has convenient access to a transit node, such as a rail station or major<br />
express bus line.<br />
Residential <strong>Parking</strong> Benefit Districts (PBD) are similar to residential parking permit districts in that<br />
a certain number of parking permits are issued to residents, which allow them to park within the<br />
neighborhood. However, PBDs also allow a limited number of non-resident parkers to pay to use<br />
surplus on-street parking spaces in residential areas, and return the resulting revenues to the<br />
neighborhood to fund public improvements.<br />
Currently, the <strong>Westside</strong> Community has more than adequate supply of parking – the peak<br />
occupancy for on- and off-street parking is 43%, meaning that even at the busiest times<br />
approximately 1,880 on- and off-street parking spaces are available. Nevertheless, a few<br />
localized parking challenges exist, as some businesses, land uses, and residential streets<br />
Nelson\Nygaard Consulting Associates Inc. • Page ES-12
<strong>Westside</strong> <strong>Parking</strong> <strong>Study</strong> • F inal <strong>Report</strong><br />
<strong>City</strong> of <strong>Ventura</strong><br />
generate more parking demand than others. These localized inefficiencies can contribute to<br />
imbalances between supply and demand, as well as exacerbate the perception that “parking is a<br />
problem” in the <strong>Westside</strong> Community. Residents can become particularly impacted by spillover<br />
parking, especially if they live on a block that consistently has higher demand and they are unable<br />
to park close to their residences. Such experiences can contribute to the belief that there is a<br />
parking “shortage” in the <strong>Westside</strong> area.<br />
While the current levels of demand likely do not warrant a residential permit district in the<br />
<strong>Westside</strong> at this time, it is recommended that the <strong>City</strong> establish guidelines and policies for the<br />
formation of future districts.<br />
Recommendation 5: Establish an in-lieu fee that is reflective of parking conditions in<br />
the <strong>Westside</strong> Community<br />
An in-lieu parking fee gives developers the option to pay a fee in-lieu of providing some portion of<br />
the number of parking spaces ordinarily required by the city’s zoning ordinance. The fee could be<br />
structured as either a fixed one-time fee per space or an annual fee per space. The fees collected<br />
can then be used to build public parking spaces, purchase private spaces for public use, or to<br />
support TDM strategies and/or improve overall mobility. In-lieu fees are particularly appropriate<br />
for adaptive reuse redevelopment projects that would not be financially or architecturally feasible<br />
if forced to provide all required minimum spaces on-site. An in-lieu fee can encourage new<br />
development of the highest architectural and urban design quality as well as the redevelopment<br />
of vacant, underutilized, historic, and/or dilapidated buildings.<br />
The <strong>City</strong> of <strong>Ventura</strong> currently has an in-lieu fee as part of its Downtown <strong>Parking</strong> Management<br />
Plan. The fee is a one-time fee priced at $24,896 per space (adjusted annually for inflation).<br />
These fees are unique to <strong>Ventura</strong>’s downtown and are set to account for the high costs of<br />
building structured parking garages. As a result, the current in-lieu fee for <strong>Ventura</strong>’s downtown<br />
would likely not be appropriate for the <strong>Westside</strong> Community, given both its mix of land uses and<br />
current parking conditions.<br />
Therefore, it is recommended that any in-lieu fee program for the <strong>Westside</strong> Community be more<br />
appropriately structured to fit the local context. More specifically, the in-lieu fee should be an<br />
amount that is roughly equivalent to the cost and longevity of a surface space, given the lack of<br />
structured parking in the <strong>Westside</strong>. In addition, an annual fee is recommended for the <strong>Westside</strong><br />
Community because it can reduce the risk to developers who do not want to pay a larger up-front<br />
fee while their project has yet to be fully financed or constructed. It is also recommended that any<br />
developer be allowed to forgo 100% of its minimum parking requirement by paying the in-lieu fee.<br />
Recommendation 6: Revise time restrictions on North <strong>Ventura</strong> Avenue from 1-hour to<br />
2-hour parking<br />
As detailed in Chapter 2, North <strong>Ventura</strong> Avenue is one of the few streets in the study area that<br />
has time restrictions. From Park Row Avenue north to Lewis Street / Sunnyway Drive, most block<br />
faces have a 1-hour time limit. These restrictions have been established as a means to<br />
encourage turnover so that customers can access businesses more easily. Based on the turnover<br />
study conducted, it appears that these restrictions are encouraging more vehicle turnover than at<br />
unrestricted spaces. Vehicles, however, are staying on average almost two hours longer than the<br />
posted 1-hour time limit. It is probable that some of these vehicles are owned by employees<br />
working in the area and parking all day long while at work. It is also possible that some customers<br />
need more than one hour to complete their errands in the study area. Nevertheless, it appears<br />
that the 1-hour time restriction is being violated on a consistent basis.<br />
Nelson\Nygaard Consulting Associates Inc. • Page ES-13
<strong>Westside</strong> <strong>Parking</strong> <strong>Study</strong> • F inal <strong>Report</strong><br />
<strong>City</strong> of <strong>Ventura</strong><br />
It is recommended that the <strong>City</strong> address this issue in two ways. First, lengthen the 1-hour<br />
restriction to two hours. Based on the existing low utilization rates, it appears that there is limited<br />
need for a “tighter” time limit of one hour. A 2-hour time limit would provide additional flexibility for<br />
motorists while helping to ensure that there is still adequate turnover of spaces for North <strong>Ventura</strong><br />
Avenue businesses.<br />
Second, the <strong>City</strong> should prioritize better enforcement of these restrictions because they are only<br />
as effective as their enforcement. Based on the turnover study, it does not appear that motorists<br />
are particularly mindful of the time restrictions, potentially due to limited enforcement. If<br />
availability of spaces on North <strong>Ventura</strong> Avenue becomes a challenge in the future, the first<br />
remedy would be to increase parking enforcement in these areas, with particular attention paid to<br />
the time restricted spaces on North <strong>Ventura</strong> Avenue.<br />
Recommendation 7: If future utilization studies warrant it, authorize staff to set time<br />
limits and if necessary, install parking meters to manage future parking demand<br />
Based on current demand and utilization rates, pricing of on-street spaces is not currently needed<br />
in the study area. In short, demand is currently too low to necessitate the implementation of<br />
parking meters. However, should future demand warrant it, pricing of parking remains the most<br />
effective strategy in a city’s “toolbox” to manage demand and ensure that parking supports the<br />
overall goals of an integrated transportation system.<br />
Therefore, if parking demand increases beyond an 85% utilization in areas without time limits, the<br />
city should implement time limits in those areas. If parking demand is still greater than 85%<br />
utilization it is recommended that the <strong>City</strong> authorize staff to replace time limits and implement an<br />
on-street pricing management strategy for the <strong>Westside</strong> Community. The metering of streets<br />
should be considered a potential long-term solution only if time limits do not manage parking<br />
demand. The <strong>City</strong> of <strong>Ventura</strong> parking meter rate is set by the <strong>City</strong> Council. During a fiscal year,<br />
the <strong>City</strong> Transportation Manager may adjust pay station and meter rates up or down 50 cents per<br />
hour in 25 cent increments based on average occupancy rates to achieve a target occupancy rate<br />
of 85% utilization.<br />
Chapter by Chapter<br />
This <strong>Parking</strong> Management Plan contains a large amount of information for policy makers. In order<br />
to make full use of the document, it is important to be able to quickly refer to relevant sections of<br />
interest. The chapters and appendices of this report are summarized as follows:<br />
Chapter 1: Existing Conditions – Describes the existing demographics and travel<br />
characteristics of the study area in relation to the <strong>City</strong> as a whole. Summarizes the study area’s<br />
existing parking conditions as they relate to inventory, regulations, utilization rates, and vehicle<br />
turnover.<br />
Chapter 2: Current and Future <strong>Parking</strong> Demand – Provides a detailed analysis of existing<br />
parking demand as it relates to current and future land uses. The analysis also includes an<br />
examination of corresponding parking code requirements in relation to observed demand.<br />
Chapter 3: <strong>Parking</strong> Management Plan – Summarizes the key points of the study’s analysis and<br />
offers preliminary recommendations for parking management.<br />
Appendix A: Best Practices in <strong>Parking</strong> Management – Highlights three cities with exceptional<br />
and innovative parking policies in the field of parking management<br />
.<br />
Nelson\Nygaard Consulting Associates Inc. • Page ES-14
<strong>Westside</strong> <strong>Parking</strong> <strong>Study</strong> • F inal <strong>Report</strong><br />
<strong>City</strong> of <strong>Ventura</strong><br />
Chapter 1. Existing Conditions<br />
The <strong>Westside</strong> Community is in transition as it responds to evolving demographics, a volatile<br />
economic climate, and various planning processes that are seeking to revitalize and transform the<br />
area. Effective management of the area’s transportation system is integral to ensuring ultimate<br />
success for the <strong>Westside</strong> Community. By examining demographics, travel trends, and existing<br />
parking conditions, this chapter facilitates a better understanding of how people are utilizing the<br />
current parking facilities, highlights parking challenges and inefficiencies, and provides a<br />
framework for developing a targeted parking management plan.<br />
As shown in Figure 1-1, the <strong>Westside</strong> parking study area is bounded by Cedar Street and<br />
Cameron Street to the east, North Olive Street to the west, Park Row Avenue on the south, and<br />
Ottawa Street on the north. North <strong>Ventura</strong> Avenue runs through the center of the study area and<br />
serves as the primary commercial and travel corridor. The study area was also divided into four<br />
distinct “zones” in order to facilitate a more focused data analysis and assess parking conditions<br />
based on a logical walking and parking search time “shed.”<br />
Nelson\Nygaard Consulting Associates Inc. • Page 1-1
<strong>Westside</strong> <strong>Parking</strong> <strong>Study</strong> • F inal <strong>Report</strong><br />
<strong>City</strong> of <strong>Ventura</strong><br />
This page intentionally left blank.<br />
Nelson\Nygaard Consulting Associates Inc. • Page 1-2
<strong>Westside</strong> <strong>Parking</strong> <strong>Study</strong> • F inal <strong>Report</strong><br />
<strong>City</strong> of <strong>Ventura</strong><br />
Figure 1-1<br />
<strong>Ventura</strong> <strong>Westside</strong> <strong>Parking</strong> <strong>Study</strong> Area<br />
Nelson\Nygaard Consulting Associates Inc. • Page 1-3
<strong>Westside</strong> <strong>Parking</strong> <strong>Study</strong> • F inal <strong>Report</strong><br />
<strong>City</strong> of <strong>Ventura</strong><br />
Current Demographics and Travel Characteristics<br />
The <strong>Westside</strong> Community’s current demographics and travel characteristics offer important<br />
background information concerning existing baseline conditions. This information can be used to<br />
set performance measures and can be updated at each new release of data. Mode split and<br />
vehicle ownership are two of the key measures presented here for both the <strong>Westside</strong> study area<br />
and <strong>City</strong> of <strong>Ventura</strong>.<br />
Race and Ethnicity<br />
According to the 2010 U.S. Census, the <strong>Westside</strong> parking study area 6 is home to<br />
approximately 10,500 people, of which more than 60% is Hispanic or Latino. As shown in<br />
Figure 1-2, Whites comprise the second largest racial group in the study area at 33%. In<br />
comparison to the <strong>City</strong> as a whole, the <strong>Westside</strong> area has a substantially larger Hispanic<br />
and Latino population, as Whites are the most common racial group in the <strong>City</strong> as a<br />
whole at 60%. It is also important to note that the percentage of Hispanic and Latino<br />
people in the <strong>Westside</strong> area has grown substantially in the past ten years, from 54% in<br />
2000 to 61% in 2010 (see Figure 1-2).<br />
Figure 1-2 Race/Ethnicity, <strong>Study</strong> Area vs. <strong>City</strong> of <strong>Ventura</strong> (2010)<br />
70%<br />
<strong>Study</strong> Area<br />
<strong>City</strong> of <strong>Ventura</strong><br />
60%<br />
Percent of Population<br />
50%<br />
40%<br />
30%<br />
20%<br />
10%<br />
0%<br />
Hispanic /<br />
Latino<br />
White Other Asian Black American Indian<br />
Source: U.S. Census, 2010<br />
6 For purposes of data analysis, the <strong>Westside</strong> parking study area was approximated using U.S. Census block groups.<br />
For 2000 data, those block groups include 22.1, 22.2, 23.1, and 23.3. For 2010 data, those block groups include: 22.1,<br />
22.2, 22.3, 23.1, and 23.3.<br />
Nelson\Nygaard Consulting Associates Inc. • Page 1-5
<strong>Westside</strong> <strong>Parking</strong> <strong>Study</strong> • F inal <strong>Report</strong><br />
<strong>City</strong> of <strong>Ventura</strong><br />
Figure 1-3 Race/Ethnicity in <strong>Study</strong> Area (2000 vs. 2010)<br />
70%<br />
<strong>Study</strong> Area (2000) <strong>Study</strong> Area (2010)<br />
60%<br />
Percent of Population<br />
50%<br />
40%<br />
30%<br />
20%<br />
10%<br />
0%<br />
Hispanic /<br />
Latino<br />
White Other American Indian Black Asian<br />
Source: U.S. Census, 2000 and 2010<br />
Journey to Work<br />
Figure 1-4 shows the commute mode share for residents within the study area, as well as for the<br />
<strong>City</strong> of <strong>Ventura</strong> as a whole. 7 There is a higher drive alone mode split in the <strong>City</strong> when compared<br />
with the study area, while more people carpool in the study area. In 2000, approximately 79% of<br />
people in the <strong>City</strong> drove alone to work, while just more than 11% carpooled to work. By contrast,<br />
69% of people in the study area drove alone to work and about 17% carpooled. Meanwhile,<br />
transit trips in the study area comprise only 2.9% of commute trips. This is an important<br />
relationship as it demonstrates that the lower drive alone rate in the study area is mainly being<br />
funneled into carpool trips rather than transit, most likely because of limited transit service<br />
through the corridor. 8 Biking and walking also comprise a small percentage of commute trips,<br />
which is likely reflective of the limited amount of infrastructure dedicated to these modes.<br />
Figure 1-5 shows commute mode splits for non-resident employees. Once again, drive alone is<br />
the most dominant commute mode and carpooling is the second most common mode. For nonresidents,<br />
the commute mode splits for the study area and the <strong>City</strong> as a whole are more similar<br />
than those for residents.<br />
7 For the <strong>City</strong> of <strong>Ventura</strong> data has been included from both the 2000 U.S. Census and the 2009 American Community<br />
Survey (ACS). Due to sample size, block group data is not available as part of the American Community Survey. As a<br />
result, the study area could not be analyzed for journey to work any later than 2000 data.<br />
8 Gold Coast Transit Routes 6 (10-15 minute peak, 25-40 minute off-peak frequencies) and 16 (60 minute frequencies)<br />
travel through the study area on North <strong>Ventura</strong> Boulevard.<br />
Nelson\Nygaard Consulting Associates Inc. • Page 1-6
<strong>Westside</strong> <strong>Parking</strong> <strong>Study</strong> • F inal <strong>Report</strong><br />
<strong>City</strong> of <strong>Ventura</strong><br />
Figure 1-4<br />
Resident Journey to Work, <strong>Study</strong> Area vs. <strong>City</strong> of <strong>Ventura</strong><br />
<strong>Study</strong> Area (2000) <strong>City</strong> of <strong>Ventura</strong> (2000) <strong>City</strong> of <strong>Ventura</strong> (2009)<br />
90%<br />
80%<br />
70%<br />
Commute Mode Share<br />
60%<br />
50%<br />
40%<br />
30%<br />
20%<br />
10%<br />
0%<br />
Drive Alone Carpool Public Transit Bicycle Walk Worked at<br />
home<br />
Other<br />
Source: U.S. Census, 2000; ACS 2005-09<br />
Figure 1-5 Non-resident Journey to Work, <strong>Study</strong> Area vs. <strong>City</strong> of <strong>Ventura</strong> (2000)<br />
90%<br />
80%<br />
70%<br />
<strong>Study</strong> Area<br />
<strong>City</strong> of <strong>Ventura</strong><br />
Commute Mode Share<br />
60%<br />
50%<br />
40%<br />
30%<br />
20%<br />
10%<br />
0%<br />
Drive Alone Carpool Worked at<br />
Home<br />
Walk Transit Other Bicycle<br />
Source: CTPP, 2000<br />
Nelson\Nygaard Consulting Associates Inc. • Page 1-7
<strong>Westside</strong> <strong>Parking</strong> <strong>Study</strong> • F inal <strong>Report</strong><br />
<strong>City</strong> of <strong>Ventura</strong><br />
Vehicle Ownership<br />
Figure 1-6 and Figure 1-7 highlight vehicle ownership and housing tenure and a number of key<br />
observations can be made. First, vehicle ownership (average number of vehicles per housing<br />
unit) is higher for owner-occupied units than renter-occupied units. In the study area, owner<br />
occupied units had 1.96 vehicles per household, while in renter-occupied units the number of<br />
vehicles per household dropped to 1.33. Overall, the study area has about 1.62 vehicles per<br />
housing unit. Second, the study area has less vehicle ownership per household than in <strong>Ventura</strong><br />
as a whole. In 2000, the <strong>City</strong> of <strong>Ventura</strong> had 1.75 vehicles per household, compared with the<br />
study area’s rate of 1.62.<br />
In addition, Figure 1-7 shows that there are a higher percentage of renter-occupied units in the<br />
study area (54%) than in the <strong>City</strong> as a whole (41%), further reinforcing the fact that the study area<br />
has lower vehicle ownership rates. Moving forward, this information provides a framework for a<br />
parking management plan that not only addresses parking supply, but also emphasizes<br />
alternative strategies that reflect lower vehicle ownership rates and drive alone rates in the study<br />
area.<br />
Figure 1-6<br />
2.25<br />
2.00<br />
Vehicles per Household, <strong>Study</strong> Area vs. <strong>City</strong> of <strong>Ventura</strong><br />
Owner Occupied Renter Occupied All Households<br />
Average Vehicles / Household<br />
1.75<br />
1.50<br />
1.25<br />
1.00<br />
0.75<br />
0.50<br />
0.25<br />
0.00<br />
<strong>Study</strong> Area (2000) <strong>City</strong> of <strong>Ventura</strong> (2000) <strong>City</strong> of <strong>Ventura</strong> (2009)<br />
Source: U.S. Census, 2000; ACS 2005-09<br />
Nelson\Nygaard Consulting Associates Inc. • Page 1-8
<strong>Westside</strong> <strong>Parking</strong> <strong>Study</strong> • F inal <strong>Report</strong><br />
<strong>City</strong> of <strong>Ventura</strong><br />
Figure 1-7 Housing Tenure, <strong>Study</strong> Area vs. <strong>City</strong> of <strong>Ventura</strong> (2000)<br />
70%<br />
Owner Occupied<br />
Renter Occupied<br />
60%<br />
50%<br />
Percent of Units<br />
40%<br />
30%<br />
20%<br />
10%<br />
0%<br />
<strong>Study</strong> Area<br />
<strong>City</strong> of <strong>Ventura</strong><br />
Source: U.S. Census, 2000; ACS 2005-09<br />
Furthermore, residents in rental homes typically have lower incomes and consequently own fewer<br />
vehicles. Figure 1-8 illustrates the relationship between household income and vehicle ownership<br />
rates in the study area. In short, as household income decreases, so does the number of vehicles<br />
owned. When large amounts of parking are required in a city code, residents are often required to<br />
rent a parking space with their unit (the cost being “bundled” into the monthly rent) even if they<br />
have no vehicle. This results in a greater financial burden for low-income households and<br />
encourages vehicle ownership. In 2000, median household income for the <strong>City</strong> of <strong>Ventura</strong> was<br />
$52,298 (1999 dollars). By comparison, the average median household income for the four block<br />
groups that comprise the study area was $38,311 (1999 dollars).<br />
Nelson\Nygaard Consulting Associates Inc. • Page 1-9
<strong>Westside</strong> <strong>Parking</strong> <strong>Study</strong> • F inal <strong>Report</strong><br />
<strong>City</strong> of <strong>Ventura</strong><br />
Figure 1-8<br />
Vehicle Ownership by Household Income, <strong>Study</strong> Area (1999 dollars)<br />
3.0<br />
2.5<br />
Avg. vehicles per Household<br />
2.0<br />
1.5<br />
1.0<br />
0.5<br />
0.0<br />
$0-24,999 $25,000-49,999 $50,000-74,999 $75,000-99,999 $100,000+<br />
Source: U.S. Census, 2000<br />
<strong>Parking</strong> Inventory and Regulations<br />
An inventory of parking facilities was undertaken as part of this study. This section provides a<br />
brief overview of the parking inventory, which identified the amount of parking (number of<br />
spaces), and parking regulations, if any, by on-street block and off-street facility.<br />
Methodology<br />
<strong>Parking</strong> inventory and regulations were determined through field observations by Nelson\Nygaard<br />
staff members, who walked the study area and counted parking spaces and noted regulations on<br />
each block face and in each off-street facility. For the study area, the on-street inventory was not<br />
clearly delineated by striping or the striping was faded. Therefore, surveyors made educated<br />
assumptions of inventory based on a common size for an on-street parking space, typically 20<br />
feet, or observed occupancy. On-street spaces in front of driveways were not counted as spaces<br />
and were not included in the baseline inventory. Only off-street facilities that were accessible (i.e.<br />
not gated or closed for construction) were counted.<br />
Nelson\Nygaard Consulting Associates Inc. • Page 1-10
<strong>Westside</strong> <strong>Parking</strong> <strong>Study</strong> • F inal <strong>Report</strong><br />
<strong>City</strong> of <strong>Ventura</strong><br />
Findings<br />
Figure 1-9 shows a map of the on-street regulations by block face for the entire study area. The<br />
vast majority of spaces are “unregulated” and do not have any time or loading restrictions. In fact,<br />
almost 93% of 2,611 on-street spaces in the study area are unregulated. Only 6% of on-street<br />
spaces have time limits (1-hour or 2-hour) and there are only 28 loading spaces, or 1.1% of total<br />
on-street inventory, in the study area. Almost all of the time and loading restrictions are on along<br />
North <strong>Ventura</strong> Avenue, primarily at the southern end of the study area. In addition, there are 700<br />
off-street spaces within the study area. <strong>Of</strong> these, more than 94% are unregulated. Figure 1-10<br />
provides a more detailed breakdown of the type of parking in the study area for both on- and offstreet<br />
facilities.<br />
Nelson\Nygaard Consulting Associates Inc. • Page 1-11
<strong>Westside</strong> <strong>Parking</strong> <strong>Study</strong> • F inal <strong>Report</strong><br />
<strong>City</strong> of <strong>Ventura</strong><br />
This page intentionally left blank.<br />
Nelson\Nygaard Consulting Associates Inc. • Page 1-12
<strong>Westside</strong> <strong>Parking</strong> <strong>Study</strong> • F inal <strong>Report</strong><br />
<strong>City</strong> of <strong>Ventura</strong><br />
Figure 1-9<br />
On-street <strong>Parking</strong> Regulations<br />
Nelson\Nygaard Consulting Associates Inc. • Page 1-13
<strong>Westside</strong> <strong>Parking</strong> <strong>Study</strong> • F inal <strong>Report</strong><br />
<strong>City</strong> of <strong>Ventura</strong><br />
Figure 1-10 <strong>Study</strong> Area <strong>Parking</strong> Facilities, by Type<br />
Time limits<br />
Location Unrestricted (24min, 1hr<br />
or 2hr)<br />
Loading (All) Disabled Total % of parking<br />
On-Street<br />
<strong>Of</strong>f-Street<br />
Total<br />
2,424 173 12 2 2,611<br />
92.8% 7.1% 0.5% 0.1% 100.0%<br />
660 0 7 33 700<br />
94.3% 0.0% 1.0% 4.7% 100.0%<br />
3,084 173 19 35 3,311<br />
93.1% 5.6% 0.6% 1.1% 100.0%<br />
78.9%<br />
21.1%<br />
100.0%<br />
Figure 1-11 provides a breakdown of parking inventory by each of the four zones. Once again,<br />
these zones were used for data analysis purposes and were delineated according to logical<br />
walking sheds. Zones 1 and 2 had the highest percentage of the 3,311 total spaces in the study<br />
area, each with approximately 37%.<br />
It is also important to note two other observations related to parking regulations. First, all parking<br />
in the study area is free. Second, there are no “public” off-street parking facilities, as all off-street<br />
lots are associated with a specific private business, institution, or other land use.<br />
Figure 1-11 <strong>Study</strong> Area <strong>Parking</strong> Facilities, by Zone<br />
Area On-Street % On-Street <strong>Of</strong>f-Street % <strong>Of</strong>f-street Total % of All<br />
Zone 1 964 36.9% 271 38.7% 1,235 37.3%<br />
Zone 2 1,019 39.0% 211 30.1% 1,230 37.1%<br />
Zone 3 329 12.6% 160 22.9% 489 14.8%<br />
Zone 4 299 11.5% 58 8.3% 357 10.8%<br />
Total 2,611 100.0% 700 100.0% 3,311 100.0%<br />
Nelson\Nygaard Consulting Associates Inc. • Page 1-15
<strong>Westside</strong> <strong>Parking</strong> <strong>Study</strong> <strong>Final</strong> <strong>Report</strong><br />
<strong>City</strong> of <strong>Ventura</strong><br />
<strong>Parking</strong> Utilization and Turnover<br />
This section provides an overview of the results from the original parking utilization and turnover<br />
data collection effort supervised by Nelson\Nygaard staff. It includes a summary of the methodology,<br />
as well as the key findings for the complete study area, by zone, and for North <strong>Ventura</strong> Avenue.<br />
Methodology<br />
Nelson\Nygaard conducted a comprehensive occupancy and turnover study for both on- and offstreet<br />
spaces using trained data collection workers supervised by a Nelson\Nygaard employee.<br />
The count days and times included:<br />
• Thursday, June 16 th from 8 AM – 6 PM, every hour<br />
• Saturday, June 18 th from 8 AM – 6 PM, every hour<br />
Counts were conducted on these days in order to provide as wide a range of parking conditions as<br />
possible as parking demand tends to fluctuate a great deal by day of week and time of day. The<br />
count periods specifically captured parking activity during a typical weekday and weekend. Each<br />
block face and off-street lot was counted every hour at approximately the same time point of each<br />
hour count period.<br />
It is important to note that on Saturday, there was a police incident in the study area (at<br />
approximately North <strong>Ventura</strong> Avenue and Vince Street) which limited surveyor access to several<br />
block faces and off-street lots from approximately 2-4 PM. For these areas, occupancy and turnover<br />
was estimated based upon data from other count periods. It should also be stated that although<br />
parking counts were taken during a non-school month, it is anticipated that school attendance has<br />
minimal affect on parking demand as students of the local elementary and middle schools may not<br />
drive and the numbers of employees is relatively limited.<br />
<strong>Parking</strong> activity during night hours was not quantified as part of this study when most residents are<br />
home and on-street occupancy rates on residential streets are generally higher. The <strong>City</strong> may wish<br />
to conduct a further occupancy study during this period to determine the extent of on-street parking<br />
occupancy in residential areas. However, if this pursued, it is recommended that the <strong>City</strong> also<br />
survey the availability of the private garage parking supply to determine if a lack of on-street parking<br />
availability is being driven by residents using their off-street garages for storage rather than parking.<br />
Findings<br />
Overall <strong>Study</strong> Area<br />
Utilization<br />
Figure 1-12 highlights the utilization findings for the study area as a whole. In general, combined<br />
occupancy for on- and off-street facilities was very consistent throughout the day as the utilization<br />
rates stayed within a narrow range (38-43%) for both Thursday and Saturday. The peak hour for<br />
overall parking demand in the study area was at 6 PM on both Thursday (43%) and Saturday<br />
(42%). The utilization rates are far below target rates. Target occupancy rates of 85% and 90% are<br />
effective industry-standards for on- and off-street spaces, respectively. In other words, maintaining<br />
15% and 10% vacancy rates for corresponding on- and off-street stalls will help ensure an “effective<br />
parking supply.” It is at these occupancy levels that roughly one space per block is available,<br />
making searching or “cruising” for parking unnecessary, and off-street lots maintain adequate<br />
maneuverability. Utilization rates much below these targets indicate a diminished economic return<br />
on investment in parking facilities.<br />
Nelson\Nygaard Consulting Associates Inc. Page 1-16
<strong>Westside</strong> <strong>Parking</strong> <strong>Study</strong> • F inal <strong>Report</strong><br />
<strong>City</strong> of <strong>Ventura</strong><br />
Figure 1-12 Utilization Rates, Overall <strong>Study</strong> Area<br />
100%<br />
90%<br />
80%<br />
Thursday, June 16th<br />
Saturday, June 18th<br />
Utilization Rate (n=3,311)<br />
70%<br />
60%<br />
50%<br />
40%<br />
30%<br />
20%<br />
10%<br />
0%<br />
8 AM 9 AM 10 AM 11 AM 12 PM 1 PM 2 PM 3 PM 4 PM 5 PM 6 PM<br />
Figure 1-13 and Figure 1-14 show utilization rates for Thursday and Saturday by facility type. On<br />
Thursday, off-street facilities experienced both higher (47% at 12 PM) and lower (25% at 6 PM)<br />
peaks than on-street parking. On Saturday, off-street facilities experienced lower demand<br />
throughout the day than on-street spaces. Once again, the parking demand for both Thursday<br />
and Saturday did not approach target occupancies.<br />
Based on the occupancy data for the study area, a number of observations can be made. First,<br />
the amount of retail/commercial activity or jobs in the study area does not result in dramatic<br />
fluctuations of parking demand. One possibility is that any influx of people into the study area<br />
during the weekday is offset by residents leaving to go to work. Second, the peak hour of 6 PM<br />
on both Thursday and Saturday is reflective of a residential neighborhood that experiences a<br />
spike in parking occupancy when residents return home from work. <strong>Final</strong>ly, as shown below,<br />
activity in private off-street lots at businesses in far lower on Saturdays than on Thursdays.<br />
Nelson\Nygaard Consulting Associates Inc. • Page 1-17
<strong>Westside</strong> <strong>Parking</strong> <strong>Study</strong> • F inal <strong>Report</strong><br />
<strong>City</strong> of <strong>Ventura</strong><br />
Figure 1-13 Utilization Rates by Facility Type, Thursday<br />
On-Street <strong>Of</strong>f-street All<br />
100%<br />
90%<br />
80%<br />
70%<br />
Utilization Rate<br />
60%<br />
50%<br />
40%<br />
30%<br />
20%<br />
10%<br />
0%<br />
8 AM 9 AM 10 AM 11 AM 12 PM 1 PM 2 PM 3 PM 4 PM 5 PM 6 PM<br />
Figure 1-14 Utilization Rates by Facility Type, Saturday<br />
On-Street <strong>Of</strong>f-street All<br />
100%<br />
90%<br />
80%<br />
70%<br />
Utilization Rate<br />
60%<br />
50%<br />
40%<br />
30%<br />
20%<br />
10%<br />
0%<br />
8 AM 9 AM 10 AM 11 AM 12 PM 1 PM 2 PM 3 PM 4 PM 5 PM 6 PM<br />
Nelson\Nygaard Consulting Associates Inc. • Page 1-18
<strong>Westside</strong> <strong>Parking</strong> <strong>Study</strong> • F inal <strong>Report</strong><br />
<strong>City</strong> of <strong>Ventura</strong><br />
Figure 1-15 and Figure 1-16 are peak hour occupancy maps of the study area for Thursday (6<br />
PM) and Saturday (6 PM). These maps show the occupancy level for each individual block face<br />
and each individual lot during the peak hour of parking demand. The maps reveal that there are<br />
some limited “pockets” of high demand on a few blocks and in some lots in the study area. For<br />
example, several of the streets surrounding De Anza Middle School and Harry A. Lyon Park had<br />
occupancies above 75% on Thursday. On Saturday, the areas with the highest utilization rates<br />
appear to be clustered in the southern portion of the study area, especially around North Olive,<br />
Harrison Avenue, Prospect Street, and Kellogg Street. Once again, however, higher occupancies<br />
are limited to only a few blocks.<br />
Another area of high demand is around the Red Barn Market at North <strong>Ventura</strong> Avenue and West<br />
Warner Street. The Red Barn Market parking lot experiences some of the highest occupancy<br />
rates of any lot in the study area. In addition, it is likely that the nearby streets are also used by<br />
Red Barn customers. However, it appears that this parking “spillover” is limited to only one or two<br />
blocks, and numerous nearby block faces or lots within walking distance to the Red Barn Market<br />
are underutilized. As a result of these trends, overall parking demand remains very low for the<br />
study area as a whole.<br />
Figure 1-17 and Figure 1-18 also show utilization rates for during the midday on both Thursday<br />
and Saturday. Once again, overall demand for the study area is quite low, but there are certain<br />
block faces and lots that have demand above 85%.<br />
Nelson\Nygaard Consulting Associates Inc. • Page 1-19
<strong>Westside</strong> <strong>Parking</strong> <strong>Study</strong> • F inal <strong>Report</strong><br />
<strong>City</strong> of <strong>Ventura</strong><br />
This page intentionally left blank.<br />
Nelson\Nygaard Consulting Associates Inc. • Page 1-20
<strong>Westside</strong> <strong>Parking</strong> <strong>Study</strong> • F inal <strong>Report</strong><br />
<strong>City</strong> of <strong>Ventura</strong><br />
Figure 1-15 Peak Hour Utilization, Thursday 6 PM<br />
Nelson\Nygaard Consulting Associates Inc. • Page 1-21
<strong>Westside</strong> <strong>Parking</strong> <strong>Study</strong> • F inal <strong>Report</strong><br />
<strong>City</strong> of <strong>Ventura</strong><br />
Figure 1-16 Peak Hour Utilization, Saturday 6 PM<br />
Nelson\Nygaard Consulting Associates Inc. • Page 1-22
<strong>Westside</strong> <strong>Parking</strong> <strong>Study</strong> • F inal <strong>Report</strong><br />
<strong>City</strong> of <strong>Ventura</strong><br />
Figure 1-17 Utilization Rates, Thursday 1 PM<br />
Nelson\Nygaard Consulting Associates Inc. • Page 1-23
<strong>Westside</strong> <strong>Parking</strong> <strong>Study</strong> • F inal <strong>Report</strong><br />
<strong>City</strong> of <strong>Ventura</strong><br />
Figure 1-18 Utilization Rates, Saturday 1 PM<br />
Nelson\Nygaard Consulting Associates Inc. • Page 1-24
<strong>Westside</strong> <strong>Parking</strong> <strong>Study</strong> • F inal <strong>Report</strong><br />
<strong>City</strong> of <strong>Ventura</strong><br />
Turnover<br />
In addition to analyzing parking utilization, parking duration data (for on-street spaces only) was<br />
also collected to gauge how often each space experiences “turnover.” This data was collected at<br />
the same time as the occupancy survey and involved surveyors noting the last 4 digits of each<br />
license plate, which can be used to identify vehicles without collecting any personal information.<br />
For the study area, turnover was similar for both Thursday and Saturday. On Thursday, it was<br />
estimated that vehicles stayed for an average of 3.38 hours. Average vehicle duration on<br />
Saturday was estimated to be slightly less at 3.30 hours.<br />
<strong>Study</strong> Area Zones<br />
Utilization<br />
Figure 1-19 and Figure 1-20 summarize the utilization trends for both Thursday and Saturday in<br />
each of the four zones. Zones 1 and 2, near the southern portion of the study area, experienced<br />
similar levels of demand on both Thursday and Saturday. In Zone 1, utilization rates ranged from<br />
38-45%, while in Zone 2 utilization rates ranged from 36-47%. By contrast, Zone 4 experienced<br />
far lower demand, with rates ranging from 26-36% across both Thursday and Saturday. <strong>Final</strong>ly,<br />
Zone 3 experienced the greatest fluctuations in demand, especially on Thursday when occupancy<br />
peaked at 65% at 10 AM and then declined to 36% by 6 PM. It should be noted that dramatic<br />
fluctuations in zones 3 and 4 are much more likely to occur given their small number of spaces.<br />
Figure 1-19 Utilization Rates by Zone, Thursday<br />
100%<br />
90%<br />
80%<br />
70%<br />
Zone 1 Zone 2 Zone 3 Zone 4<br />
Utilization Rate<br />
60%<br />
50%<br />
40%<br />
30%<br />
20%<br />
10%<br />
0%<br />
8 AM 9 AM 10 AM 11 AM 12 PM 1 PM 2 PM 3 PM 4 PM 5 PM 6 PM<br />
Nelson\Nygaard Consulting Associates Inc. • Page 1-25
<strong>Westside</strong> <strong>Parking</strong> <strong>Study</strong> • F inal <strong>Report</strong><br />
<strong>City</strong> of <strong>Ventura</strong><br />
Figure 1-20 Utilization Rates by Zone, Saturday<br />
Zone 1 Zone 2 Zone 3 Zone 4<br />
100%<br />
90%<br />
80%<br />
70%<br />
Utilization Rate<br />
60%<br />
50%<br />
40%<br />
30%<br />
20%<br />
10%<br />
0%<br />
8 AM 9 AM 10 AM 11 AM 12 PM 1 PM 2 PM 3 PM 4 PM 5 PM 6 PM<br />
Figure 1-21 summarizes the utilization rates by zone during the peak period of demand on both<br />
Thursday (6 PM) and Saturday (6 PM). On each day, Zones 1 and 2 had the highest occupancy<br />
levels, while Zones 3 and 4 experienced substantially less demand. Once again, however, all of<br />
these zones had parking demand far below that of target levels, indicating that there is an ample<br />
supply of parking in the study area and that challenges associated with parking are likely due to<br />
inefficient management of existing supply.<br />
Figure 1-21 Utilization by Zone at <strong>Study</strong> Area Peak Period, 6 PM<br />
On & <strong>Of</strong>f-Street<br />
On-street<br />
<strong>Of</strong>f-street<br />
Zone<br />
Combined<br />
Thursday Saturday Thursday Saturday Thursday Saturday<br />
Zone 1 49% 50% 31% 28% 45% 45%<br />
Zone 2 49% 50% 38% 35% 47% 47%<br />
Zone 3 50% 44% 25% 4% 36% 31%<br />
Zone 4 38% 37% 0% 3% 32% 31%<br />
Turnover<br />
Figure 1-22 summarizes the average duration for each vehicle by zone. In brief, Zone 4<br />
experiences the highest average duration of any of the zones, with vehicles staying on average of<br />
3.92 hours on Thursday and 4.17 hours on Friday, likely due to the lack of regulation in the area.<br />
On Saturday, Zone 1 had the shortest average duration of any day or zone as vehicles stayed on<br />
average just over three hours. In general, there is relatively limited turnover within the study area.<br />
Nelson\Nygaard Consulting Associates Inc. • Page 1-26
<strong>Westside</strong> <strong>Parking</strong> <strong>Study</strong> • F inal <strong>Report</strong><br />
<strong>City</strong> of <strong>Ventura</strong><br />
Figure 1-22 Average Vehicle Duration, by Zone<br />
Zone Thursday Saturday<br />
Zone 1 3.32 3.06<br />
Zone 2 3.73 3.23<br />
Zone 3 3.13 3.77<br />
Zone 4 3.92 4.17<br />
<strong>Study</strong> Area 3.38 3.30<br />
North <strong>Ventura</strong> Avenue<br />
Utilization<br />
Utilization rates were also calculated specifically for North <strong>Ventura</strong> Avenue. Figure 1-23 shows<br />
that parking peaked on North <strong>Ventura</strong> Avenue on Thursday at 10 AM with 42% of on-street<br />
spaces occupied. It is also evident that utilization of on-street spaces on North <strong>Ventura</strong> Avenue is<br />
higher on Thursday than on Saturday. <strong>Final</strong>ly, utilization rates on North <strong>Ventura</strong> Avenue were at<br />
their lowest at 8 AM in the morning. Given the lower occupancy rates at the beginning and end of<br />
the counts periods, it is clear that residents in the study area do not typically park on North<br />
<strong>Ventura</strong> Avenue over night and that this corridor becomes more occupied throughout the day as<br />
people visit businesses or other destinations in the study area.<br />
Figure 1-23 Utilization Rates, North <strong>Ventura</strong> Avenue<br />
100%<br />
90%<br />
80%<br />
Thursday, June 16th<br />
Saturday, June 18th<br />
Utilization Rate (n=224)<br />
70%<br />
60%<br />
50%<br />
40%<br />
30%<br />
20%<br />
10%<br />
0%<br />
8 AM 9 AM 10 AM 11 AM 12 PM 1 PM 2 PM 3 PM 4 PM 5 PM 6 PM<br />
Turnover<br />
On Thursday, the average duration for a given vehicle along the length of North <strong>Ventura</strong> Avenue<br />
was 2.91 hours. By contrast, on Saturday the average duration for a given vehicle was 1.52<br />
Nelson\Nygaard Consulting Associates Inc. • Page 1-27
<strong>Westside</strong> <strong>Parking</strong> <strong>Study</strong> • F inal <strong>Report</strong><br />
<strong>City</strong> of <strong>Ventura</strong><br />
hours. The duration of these stays is lower than for the study area as a whole, most likely due to<br />
North <strong>Ventura</strong> Avenue being one of the few streets to have any time restrictions for its on-street<br />
spaces. In addition, these findings are likely reflective of employees using the unregulated onstreet<br />
spaces on North <strong>Ventura</strong> Avenue to park for extended periods of time. On Saturdays,<br />
however, people parking on North <strong>Ventura</strong> Avenue are not doing so for extended periods, but<br />
rather for short trips to nearby businesses or retail establishments.<br />
Nelson\Nygaard Consulting Associates Inc. • Page 1-28
<strong>Westside</strong> <strong>Parking</strong> <strong>Study</strong> • F inal <strong>Report</strong><br />
<strong>City</strong> of <strong>Ventura</strong><br />
Chapter 2. Current and Future <strong>Parking</strong><br />
Demand<br />
This chapter provides an analysis of existing and future parking conditions in the study area.<br />
More specifically, it analyzes existing parking demand in relation to target occupancies and<br />
quantifies how much the study area, and each zone, is “over” or “under” supplied. In addition, this<br />
chapter analyzes parking demand in relation to existing and future land use and development<br />
patterns. This analysis will enable the <strong>City</strong> to demonstrate the effects of development on parking<br />
and determine whether the study area currently has more or less parking supply than existing<br />
demand requires. <strong>Final</strong>ly, this data is also used to evaluate the existing code requirements and<br />
inform the recommendations related to parking management in Chapter 3.<br />
Inventory, Occupancy, and Oversupply<br />
As discussed in Chapter 1, the peak hour of parking demand was at 6 PM for both Thursday and<br />
Saturday. For the study area as a whole, peak occupancies were 43% on Thursday and 42% on<br />
Saturday. Once again, these occupancies are well below target levels of demand and result in an<br />
“oversupply” of parking, as demonstrated in Figure 2-1 and Figure 2-2. The figures show the<br />
inventory and occupancy during the peak period for both the study area and for each zone,<br />
calculations of what a “necessary supply” would be needed to meet current occupancy levels and<br />
maintain the 85% and 90% target utilization rates, and the resulting oversupply of existing<br />
parking.<br />
As shown all zones in the study area are substantially oversupplied. For example, at peak<br />
occupancy on Thursday 1,431 parking spaces in the study area are occupied. If one were to<br />
assume that this was meeting the target occupancy rate, then the study area would only require<br />
1,672 spaces. Current supply in the study area, however, is 3,311spaces, which translates into a<br />
98% “oversupply” of parking based on current demand. Similar trends are evident across all<br />
zones, on both the weekday and weekend. In short, the study area has more than enough<br />
parking spaces to meet current demand.<br />
Figure 2-1 Occupancy, Inventory, and Oversupply – Thursday 6 PM<br />
Area<br />
Occupancy Necessary Supply Existing Supply Oversupply % Oversupply<br />
(a) (b) = (a / .85 - .90) (c) (d) = (c-b) (e) = (d / b)<br />
<strong>Study</strong> Area 1,431 1,672 3,311 1,639 98%<br />
Zone 1 558 651 1,235 584 90%<br />
Zone 2 580 677 1,230 553 82%<br />
Zone 3 178 208 489 281 135%<br />
Zone 4 115 135 357 222 164%<br />
Nelson\Nygaard Consulting Associates Inc. • Page 2-1
<strong>Westside</strong> <strong>Parking</strong> <strong>Study</strong> • F inal <strong>Report</strong><br />
<strong>City</strong> of <strong>Ventura</strong><br />
Figure 2-2<br />
Area<br />
Occupancy, Inventory, and Oversupply – Saturday 6 PM<br />
Occupancy Necessary Supply Existing Supply Oversupply % Oversupply<br />
(a) (b) = (a / .85 - .90) (c) (d) = (c-b) (e) = (d / b)<br />
<strong>Study</strong> Area 1,405 1,643 3,311 1,668 102%<br />
Zone 1 558 652 1,235 583 90%<br />
Zone 2 583 681 1,230 549 81%<br />
Zone 3 152 178 489 311 174%<br />
Zone 4 112 132 357 225 171%<br />
Peak Demand in <strong>Study</strong> Area<br />
Current Conditions<br />
The peak occupancy for the entire study area occurred on Thursday, June 16 th at 6 PM. <strong>Parking</strong><br />
demand ratio calculations revealed two different, but equally useful correlations:<br />
• Built Stalls to Built Land Use Ratio. This represents the total number of existing parking<br />
stalls correlated to total existing land use square footage (occupied or vacant) within the<br />
study area. According to data provided by the <strong>City</strong>, there is approximately 1,153,392 gross<br />
square feet (GSF) of land uses 9 in the study zone. At this time, about 2.87 parking stalls<br />
per 1,000 GSF of built land use have been developed/provided within the study area<br />
(combining the on and off-street parking supplies).<br />
• Combined Peak Demand to Occupied Land Use Ratio. This represents peak hour<br />
occupancy within the entire study area combining the on and off-street supply. As such,<br />
actual parked vehicles were correlated with actual occupied building area (approximately<br />
1,133,458 GSF). From this perspective, current peak hour demand stands at a ratio of<br />
approximately 1.26 occupied parking stalls per 1,000 GSF of built land use.<br />
Figure 2-3 summarizes the analysis used to determine the built ratio of parking to built land use<br />
(i.e., Column D), which is based on the correlation between total built land use of 1,153,392 GSF<br />
(Column A – Built) and 3,311 stalls of “built” parking supply (i.e., Column C). As such, the built<br />
ratio of parking is 2.87 stalls per 1,000 GSF of commercial/retail building area. Figure 2-3 also<br />
demonstrates that the actual demand for parking is approximately 1.26 occupied stalls per 1,000<br />
GSF (Column F). This number is derived by correlating actual occupied building area of<br />
1,139,118 GSF (Column B) to the 1,431 vehicles actually parked in the peak hour (Column E).<br />
Figure 2-3 also breaks out this data by zone, and reveals that Zones 1 and 2 have the highest<br />
peak demand ratios (1.39 per 1,000 GSF), while Zone 3 (.98) and Zone 4 (.87) have considerably<br />
lower demand during the peak period.<br />
9 Includes four general land use categories: residential, commercial, industrial, and civic.<br />
Nelson\Nygaard Consulting Associates Inc. • Page 2-2
<strong>Westside</strong> <strong>Parking</strong> <strong>Study</strong> • F inal <strong>Report</strong><br />
<strong>City</strong> of <strong>Ventura</strong><br />
Figure 2-3 <strong>Parking</strong> Demand – Mixed Land Use to Built Supply 10<br />
A B C D E F<br />
Geographic<br />
Area<br />
GSF (Built)<br />
GSF<br />
(Occupied) 11<br />
Total Supply<br />
Inventoried<br />
in <strong>Study</strong> Area<br />
Built Ratio of<br />
<strong>Parking</strong> (per<br />
1,000 GSF)<br />
Total<br />
Occupied<br />
Spaces in<br />
Peak Hour<br />
Actual Ratio<br />
of <strong>Parking</strong><br />
Demand (per<br />
1,000 GSF)<br />
<strong>Study</strong> Area 1,153,392 1,133,458 3,311 2.87 1,431 1.26<br />
Zone 1 407,301 400,530 1,235 3.03 558 1.39<br />
Zone 2 426,526 418,186 1,230 2.88 580 1.39<br />
Zone 3 186,045 182,033 489 2.63 178 0.98<br />
Zone 4 133,520 132,710 357 2.67 115 0.87<br />
If in the future parking were provided at the rate of actual demand absorption (1.26), overall peak<br />
hour occupancies would near 100% only if parking remained free and close to 1.5 million square<br />
feet of new development were constructed in the area. Put another way, there is currently 1.1<br />
million square feet of occupied built space resulting in 1,431 occupied parking spaces. In order to<br />
fill the remaining 1,880 vacant spaces in the area, up to another 1.5 million square feet could be<br />
added without any new parking being constructed. If any level of parking pricing were to be<br />
instituted in the future, peak hour occupancies would be less than 100%, particularly if prices<br />
were set to recommended levels to ensure a 15% vacancy rate.<br />
To date, parking has been built at an average rate of 2.87 stalls per 1,000 GSF of development in<br />
the <strong>Westside</strong> study area. This rate appears to have provided surplus parking with significant<br />
availability in both existing on and off-street facilities, especially given that land uses in the study<br />
area only generate parking demand ratios of 1.26 stalls per 1,000 GSF. According to this<br />
analysis, approximately 1,880 stalls are empty and available at the peak of the peak hour (1,358<br />
on-street and 522 off-street). This surplus of parking allows for future development to make use<br />
of existing spaces prior to the construction of new parking.<br />
10 <strong>Study</strong> area peak utilization – Thursday, 6 PM<br />
11 Assumes the following vacancy rates: Retail (2%), <strong>Of</strong>fice (12.5%), Civic (0%), Residential (0%), and Industrial (4.6%)<br />
Nelson\Nygaard Consulting Associates Inc. • Page 2-3
<strong>Westside</strong> <strong>Parking</strong> <strong>Study</strong> • F inal <strong>Report</strong><br />
<strong>City</strong> of <strong>Ventura</strong><br />
Figure 2-4 provides a summary of built supply to actual demand for other cities that the consultant<br />
team has worked with. The <strong>Westside</strong> area falls in the middle of selected cities in relation to actual<br />
amount of parking built to land use. However, the <strong>Westside</strong> area has one of the lowest demand<br />
ratios, resulting in a large gap between what the level of parking supplied and what is actually<br />
needed. The main theme of this figure is that, like many American cities, the <strong>Westside</strong> community<br />
is currently building more parking than demand indicates.<br />
Figure 2-4<br />
Built <strong>Parking</strong> Supply and Actual Demand, Selected Cities<br />
<strong>City</strong><br />
Minimum Requirement /<br />
1,000 SF or Actual Built<br />
Supply<br />
Actual Demand<br />
/ 1,000 SF<br />
Gap between parking built<br />
and actual parking demand<br />
(for every 1,000 GSF)<br />
Hood River, OR 1.54 1.23 0.31<br />
Oxnard, CA 1.70 0.98 0.72<br />
Corvallis, OR 2.00 1.50 0.50<br />
Sacramento, CA 2.00 1.60 0.40<br />
Monterey, CA 2.14 1.20 0.94<br />
Seattle, WA (SLU) 2.50 1.75 0.75<br />
Kirkland, WA 2.50 1.98 0.52<br />
Palo Alto, CA 2.50 1.90 0.60<br />
Santa Monica 2.80 1.80 1.00<br />
<strong>Ventura</strong>, CA (<strong>Westside</strong>) 2.87 1.26 1.61<br />
Chico, CA 3.00 1.70 1.30<br />
Hillsboro, OR 3.00 1.64 1.36<br />
Bend, OR 3.00 1.80 1.20<br />
Salem, OR 3.15 2.04 1.11<br />
Redmond, WA 4.10 2.71 1.39<br />
Beaverton, OR 4.15 1.85 2.30<br />
Nelson\Nygaard Consulting Associates Inc. • Page 2-4
<strong>Westside</strong> <strong>Parking</strong> <strong>Study</strong> • F inal <strong>Report</strong><br />
<strong>City</strong> of <strong>Ventura</strong><br />
Minimum <strong>Parking</strong> Requirements<br />
In order for the <strong>Westside</strong> Community to function as a vibrant area that supports multimodal travel,<br />
the <strong>City</strong>’s parking policies must support those goals. Minimum parking requirements, however,<br />
have emerged as one of the biggest obstacles to many cities’ efforts to encourage new<br />
commercial development and develop pedestrian and transit friendly districts. Currently, the <strong>City</strong><br />
Code requires between two to ten parking spaces per 1,000 square feet for most built space in<br />
the <strong>Westside</strong> Community. Given that the peak demand ratio in the study area is only 1.26 spaces<br />
per 1,000 GSF, there is considerably more parking being required than is necessary.<br />
Figure 2-5<br />
Land Use<br />
Existing Municipal Minimum <strong>Of</strong>f-street <strong>Parking</strong> Requirements<br />
<strong>Parking</strong> Spaces Required per 1,000 SF<br />
Retail 3.3<br />
<strong>Of</strong>fice 3.3<br />
Shopping Center 3.3<br />
Dining & Drinking (> 2,500 GSF, Free-standing) 10<br />
Dining & Drinking (< 2,500 GSF, Mixed-Use) 5<br />
Industrial 2<br />
In addition to the economic implications of requiring an oversupply of parking, high minimum<br />
parking requirements can be also damaging to the character of a main street corridor, such as<br />
North <strong>Ventura</strong> Avenue. It is very difficult to create a walkable and bikeable atmosphere when offstreet<br />
parking lots take up more space than buildings. As illustrated in Figure 2-6, <strong>Ventura</strong>’s<br />
current minimum parking requirements for the <strong>Westside</strong> Community often require more than one<br />
square foot of parking area for every square foot of building. For example, a restaurant of more<br />
than 2,500 square feet is required by <strong>City</strong> Code to provide 3.4 square feet of parking for each<br />
square foot of building space. These requirements can be particularly damaging to uses, such as<br />
eating establishments, which help create a sense of activity and life.<br />
Nelson\Nygaard Consulting Associates Inc. • Page 2-5
<strong>Westside</strong> <strong>Parking</strong> <strong>Study</strong> • F inal <strong>Report</strong><br />
<strong>City</strong> of <strong>Ventura</strong><br />
Figure 2-6<br />
Existing Minimum <strong>Parking</strong> Requirements vs. Building Square Footage<br />
Administrative, Business, and Professional Services<br />
Automotive and Accessories: Automotive Rentals<br />
Automotive and Accessories: Automotive Repair, Bodies<br />
College, no assembly<br />
Day Care Centers<br />
Dining & Drinking < 2,500 SF Gross<br />
Dining & Drinking < 2,500 SF Gross, Mixed-Use<br />
Dining & Drinking > 2,500 SF Gross, Free-standing<br />
Dining Establishments: Fast Service Counter<br />
Elementary & Middle School, no assembly<br />
Group Care<br />
High School, no assembly<br />
Lodging Services: Hotels and Motels<br />
Medical Services: Medical Care<br />
Recreation Services: Amusement Centers<br />
Shopping Center: Large with Dining<br />
Shopping Center: Large without Dining<br />
Utility or Equipment Substation<br />
1.13<br />
1.13<br />
0.68<br />
3.10<br />
0.44<br />
1.13<br />
1.70<br />
3.40<br />
3.40<br />
0.44<br />
0.67<br />
2.22<br />
0.38<br />
2.51<br />
1.70<br />
1.36<br />
1.13<br />
1.13<br />
0.0 0.5 1.0 1.5 2.0 2.5 3.0 3.5 4.0 4.5 5.0<br />
Building Sq. Ft.<br />
<strong>Parking</strong> Sq. Ft.<br />
Nelson\Nygaard Consulting Associates Inc. • Page 2-6
<strong>Westside</strong> <strong>Parking</strong> <strong>Study</strong> • F inal <strong>Report</strong><br />
<strong>City</strong> of <strong>Ventura</strong><br />
Chapter 3. <strong>Parking</strong> Management Plan<br />
The inventory of parking supply and regulations, the parking occupancy/turnover study, and<br />
analysis of current parking demand in relation to existing parking requirements, current land uses,<br />
and future development patterns provide a wealth of information about parking conditions and<br />
behavior within the <strong>Westside</strong> Community study area. More importantly, this data will serve as the<br />
guiding framework for the <strong>City</strong> as it moves forward with reshaping the <strong>Westside</strong> Community and<br />
reforming its parking policies and management systems. By developing regulatory processes that<br />
establish the appropriate amount of parking, and then maximizing the efficiency of that supply,<br />
the <strong>City</strong> can accommodate the interests of all stakeholders, including employees, visitors, and<br />
residents.<br />
Other cities have faced similar circumstances in managing parking and have used improved<br />
policies and management to alleviate localized inefficiencies while spurring economic growth.<br />
This chapter seeks to begin the conversation by offering several recommendations for parking<br />
reform. These concepts are informed by the data obtained in this study, peer review and best<br />
practices research, as well as Nelson\Nygaard’s previous experience with similar cities.<br />
Principles of Effective <strong>Parking</strong> Management<br />
Historically, “solving the parking problem” almost always meant increasing supply. Unfortunately,<br />
constantly increasing parking supply simply encourages more auto use, as people are encouraged<br />
to drive to places that offer “plenty of free parking.” While providing adequate parking is still<br />
important, it is only one tool available for managing both demand and supply. The goal of “parking<br />
demand management” is to provide the optimal amount of parking to meet parking needs while<br />
reducing traffic congestion and accommodating new development and a variety of land uses.<br />
Managing parking has been shown to be the single most effective tool for managing congestion,<br />
even when densities are relatively low and major investments in other modes have not been<br />
made. <strong>Parking</strong> management can also have a significant impact on commute mode choice, which<br />
translates directly to reductions in auto congestion and improved livability of commercial districts<br />
and adjacent neighborhoods.<br />
As the <strong>Westside</strong> Community continues to grow and evolve its parking needs will change as well,<br />
and this Plan recommends techniques to both address current challenges and adjust to future<br />
needs. Above all else, this Plan proposes a parking management approach that utilizes policies<br />
and programs that will enable more efficient utilization of existing supply, while alleviating parking<br />
congestion in certain areas.<br />
In recognition of these considerations, the following principles informed the development of<br />
parking management recommendations for the <strong>Westside</strong> Community:<br />
• Set clear parking priorities based on the <strong>Westside</strong> Community’s strengths and vision for<br />
the future.<br />
• Manage the entire parking supply as part of an integrated system.<br />
• Manage parking facilities with a focus on maintaining availability, not simply increasing<br />
supply.<br />
• Optimize investment in parking by making most efficient use of all public and private<br />
parking facilities and encouraging use of viable alternative mode options, before<br />
constructing new parking.<br />
Nelson\Nygaard Consulting Associates Inc. • Page 3-1
<strong>Westside</strong> <strong>Parking</strong> <strong>Study</strong> • F inal <strong>Report</strong><br />
<strong>City</strong> of <strong>Ventura</strong><br />
• Use any potential parking revenue to fund transportation programs that maintain adequate<br />
parking supply and support use of transportation options in the <strong>Westside</strong> area.<br />
• Use of residential permit districts to address spillover concerns in residential<br />
neighborhoods.<br />
• Encourage economic revitalization and remove barriers to development and adaptive<br />
reuse projects by adopting parking standards that are tailored to the unique parking<br />
demand of mixed-use, walkable communities.<br />
• Ensure flexibility for developers by providing a variety of tools to meet and/or reduce<br />
parking requirements.<br />
• Provide flexibility to local decision makers and <strong>City</strong> staff to adapt to future changes in<br />
parking demand and travel patterns.<br />
Recommendations<br />
Recommendation #1: Implement a consolidated parking policy for<br />
the <strong>Westside</strong> Community<br />
The <strong>Westside</strong> Community should officially adopt and implement a consolidated parking policy,<br />
where all parking is managed as an integrated system. The primary impetus for this<br />
recommendation is that current demand (or new construction of up to 1.5 million square feet) in<br />
the <strong>Westside</strong> area does not warrant the provision of additional supply. Chapter 1 highlights the<br />
low parking utilization rates in the study with no zone approaching target rates. Furthermore,<br />
while there may be one or two hour periods or small areas with higher demand, available on- or<br />
off-street spaces are never more than one or two blocks away. The fundamental goal of a<br />
consolidated parking policy is to make efficient use of the existing parking supply by including as<br />
many spaces as possible in a common pool of shared, publicly available spaces.<br />
The key management strategies for a consolidated parking district will include (as described in<br />
greater detail below):<br />
• Continue to encourage all existing and new private parking facilities to be made available<br />
to the public when not needed by its principal user (as discussed in Recommendation<br />
1.A).<br />
• Continue to encourage shared parking between uses in all existing and new private<br />
parking facilities wherever feasible (as discussed in Recommendation 1.B).<br />
• Develop new parking supply only as needed by maximizing the use of existing off-street<br />
parking and/or first purchasing or leasing existing private parking lots from willing sellers<br />
(as discussed in Recommendation 1.C).<br />
Adopting a park once policy requires a fundamental shift in how the <strong>Westside</strong> area currently<br />
thinks about parking management. Today, there is no publicly available off-street parking, as all<br />
off-street parking is associated with a private business or land use. This creates a number of key<br />
challenges for residents, customers, or visitors to the study area. First, if someone is wishing to<br />
perform several errands within the study area they must make multiple trips to separate parking<br />
lots, thereby increasing the number of vehicle trips and associated congestion and vehicle<br />
emissions. Even if an individual’s destination is right next door and they would like to walk, they<br />
will likely still move their vehicle, as most private off-street facilities “protect” their parking lot with<br />
the threat of towing.<br />
Nelson\Nygaard Consulting Associates Inc. • Page 3-2
<strong>Westside</strong> <strong>Parking</strong> <strong>Study</strong> • F inal <strong>Report</strong><br />
<strong>City</strong> of <strong>Ventura</strong><br />
Second, in areas where demand is high, existing supply is not being utilized efficiently. The<br />
occupancy study showed that while utilization rates are generally low throughout the study area,<br />
there are “pockets” of high demand in certain lots and on certain blocks. For example, the Red<br />
Barn Market at North <strong>Ventura</strong> Avenue and West Warner Street is one of these areas with higher<br />
demand, as utilization rates exceed 90% at various points throughout the day and occasionally<br />
100% (lot is completely full and people are waiting for spaces to become available). At these<br />
times, demand has spilled over onto nearly blocks on West Warner and North <strong>Ventura</strong> Avenue.<br />
At the same time, there are four other off-street parking lots within a block of the market that have<br />
available parking (see Figure 1-15). While not as convenient as the Red Barn lot itself, these<br />
facilities do offer a reasonable alternative for customers. However, it is clear that motorists do not<br />
feel comfortable parking in these lots, and, therefore, will either circle the market, wait in the<br />
parking lot until a space opens up, or park on a nearby residential street.<br />
A consolidated parking district seeks to eliminate these inefficiencies by allowing parking supply<br />
to be “pooled” into a shared supply available to multiple uses. The end result is that motorists feel<br />
comfortable parking their car once and completing multiple daily tasks on foot before returning to<br />
their car. By transforming motorists into pedestrians, a consolidated parking strategy is an<br />
immediate generator of pedestrian life, creating crowds of people who animate public life on the<br />
streets and become patrons of street friendly retail businesses.<br />
In addition, consolidated parking policies allow spaces to be efficiently shared between uses with<br />
differing peak hours, peak days, and peak seasons of parking demand. <strong>Final</strong>ly, parking supply<br />
can be more appropriately sized to meet average parking loads (as opposed to peak demand),<br />
since the common supply allows shops and offices with high demand to be balanced by land<br />
uses that have lower demand or are temporarily vacant.<br />
The following sub-recommendations provide a detailed approach to moving forward with a<br />
consolidated parking district and establish a framework for making it as effective as possible.<br />
Recommendation #1.A: Encourage new and existing private parking be made publicly<br />
available.<br />
As discussed in Chapter 1, there is a significant amount of private parking in the study area. As<br />
shown in Figure 1-10, there are 700 off-street spaces in the study area. The majority of these<br />
spaces are concentrated in the southern half of the study area. In general, occupancy levels in<br />
these lots are very low. Figures 1-13 and 1-14 also show that on Thursday rates did not exceed<br />
50% and on Saturday rates did not exceed 30%. Based on current demand, therefore, it is clear<br />
that there is not a supply problem, but inefficiencies in how demand is currently managed. In<br />
other words, with so much parking currently held in private hands, the existing parking supply is<br />
not being used as efficiently as it could be. By adding these existing spaces to the public supply,<br />
the <strong>City</strong> will be able to inexpensively add a significant amount of parking capacity to the <strong>Westside</strong>.<br />
More specifically, in order to better manage existing demand and strategically add to the parking<br />
supply, the <strong>City</strong> should:<br />
• Work with property owners and businesses to ensure that private parking is made<br />
available to the public when not needed for its primary commercial use.<br />
• Work with property owners and businesses to develop mutually-agreeable operating and<br />
liability arrangements for public use of private parking facilities.<br />
• Require as a condition of approval that private parking in any new <strong>Westside</strong> Community<br />
development or adaptive reuse projects be made available to the public when not needed<br />
for its primary commercial use.<br />
Nelson\Nygaard Consulting Associates Inc. • Page 3-3
<strong>Westside</strong> <strong>Parking</strong> <strong>Study</strong> • F inal <strong>Report</strong><br />
<strong>City</strong> of <strong>Ventura</strong><br />
Recommendation #1.B: Allow shared parking among different land uses by right.<br />
Different land uses have different periods of parking demand. For example, a bank adjacent to a<br />
night club can quite easily share a common parking facility. This principle is widely accepted in<br />
transportation planning and should be permitted in the <strong>City</strong>’s parking code. In order to make the<br />
process of securing approval for shared parking less onerous for new development and adaptive<br />
reuse projects, the <strong>City</strong> should:<br />
• Allow parking to be shared among different uses within a single mixed-use building by<br />
right.<br />
• Residential uses: Allow parking to be shared between residential buildings and an off-site<br />
parking facility by right, provided that the off-site facility is within 500 feet of the building<br />
entrance.<br />
• Non-residential uses: Allow parking to be shared between non-residential buildings and an<br />
off-site parking facility by right upon staff approval, provided that the off-site facility is<br />
within 1,250 feet of the building entrance.<br />
• <strong>Of</strong>f-site shared parking located further than 1,250 feet should be considered at the<br />
discretion of staff so long as there is documentation that reasonable provision has been<br />
made to allow off-site parkers to access the principal use (e.g. a shuttle bus, valet parking<br />
service, free transit passes, etc.).<br />
Recommendation #1.C: Develop new parking supply only as needed.<br />
The costs of constructing new parking spaces in the <strong>Westside</strong> Community are significant when<br />
compared to investing in more cost-effective measures to manage existing demand or reduce<br />
parking demand altogether. Depending on the type and design of off-street facility, a single<br />
parking space in a parking structure can range from $20,000 to $50,000, exclusive of debt<br />
service, operation and maintenance, insurance, and enforcement costs.<br />
While current demand does not warrant the development of new parking facilities, new public<br />
parking structures could be necessary to meet future parking demand that cannot be<br />
accommodated by presently vacant spaces. For this reason the <strong>City</strong> should:<br />
• Pursue implementation of all cost-effective strategies to a) reduce parking demand and b)<br />
make the most efficient use of existing supply, while preparing for the future need to<br />
provide new public parking lots/garages as needed. It must be emphasized that it is<br />
prudent, from both a fiduciary and congestion management perspective, to optimize the<br />
use of existing public parking facilities before constructing costly new lots/garages.<br />
• If new public parking supply is needed, first purchase or lease existing private parking lots<br />
or structures from willing sellers, and add this parking to the shared public supply before<br />
building expensive new lots/garages.<br />
• Identify one or more placeholder “opportunity” sites for locating new public lots/garages<br />
when needed.<br />
• Prioritize and aggressively implement all feasible strategies for reducing parking demand<br />
by shifting peak hour trips to other modes, especially those that are more cost-effective at<br />
accommodating a new downtown trip (via carpool, transit, etc.).<br />
• Conduct annual monitoring of the effectiveness of strategies to reduce parking demand.<br />
Initiate pre-development processes for new parking lots/garages only when overall peak<br />
parking utilization regularly and consistently exceeds 80%.<br />
Nelson\Nygaard Consulting Associates Inc. • Page 3-4
<strong>Westside</strong> <strong>Parking</strong> <strong>Study</strong> • F inal <strong>Report</strong><br />
<strong>City</strong> of <strong>Ventura</strong><br />
• If a structure is built, allow for a parking credit program similar to that of Old Pasadena<br />
(described in Appendix A).<br />
Recommendation #2: Revise Minimum <strong>Parking</strong> Standards for the<br />
<strong>Westside</strong> Community<br />
As discussed in Chapter 2, the <strong>City</strong> of <strong>Ventura</strong>’s existing minimum parking requirements are<br />
incompatible with existing parking demand in the <strong>Westside</strong> Community. In short, the existing<br />
minimums require far more parking spaces than is currently needed. More specifically, the<br />
utilization study found that the built ratio of parking was 2.87 parking stalls per 1,000 GSF of<br />
development. However, based on the utilization study it was found that the actual ratio of parking<br />
demand was 1.26 parking stalls per 1,000 GSF of occupied space. In addition, as shown in<br />
Figure 2-6, current minimum parking requirements for the <strong>Westside</strong> Community often require<br />
more than one square foot of parking area for every square foot of building. These requirements<br />
are especially prohibitive for any type of adaptive reuse project, as it severely restricts how<br />
developers meet parking requirements on-site.<br />
Therefore, as the <strong>City</strong> moves forward with developing its <strong>Westside</strong> Development Code, it<br />
is recommended that the <strong>City</strong> adjust its minimum parking requirements for the <strong>Westside</strong><br />
Community.<br />
Figure 3-1 shows recommended revised proposed parking requirements for selected land uses<br />
and zones. It includes revised minimum requirements and also proposes a maximum parking<br />
requirement for non-residential uses in the T5.5 (Urban Center Zone) zone at 4 spaces per 1,000<br />
square feet. A parking “maximum” estimates the greatest number of spaces that should be<br />
needed as reserved spaces without unduly burdening the on-street or locally shared-parking<br />
supply, or threatening the development potential of the site.<br />
Nelson\Nygaard Consulting Associates Inc. • Page 3-5
<strong>Westside</strong> <strong>Parking</strong> <strong>Study</strong> • F inal <strong>Report</strong><br />
<strong>City</strong> of <strong>Ventura</strong><br />
Figure 3-1<br />
Land Use Category<br />
Metric<br />
Proposed T3.6<br />
Existing T3.6<br />
Proposed T3.5<br />
Existing T3.5<br />
Proposed T4.11<br />
Existing T4.11<br />
Proposed T5.5<br />
Existing T5.5<br />
Proposed SD1<br />
Existing SD1<br />
(-) Use not permitted<br />
Recommended Revised <strong>Parking</strong> Requirements for Selected Land<br />
Uses 12<br />
Single-<br />
Family Multi-Family Live-Work<br />
1 BDR 2 BDR<br />
Unit Unit Unit<br />
Non-<br />
Residential<br />
Industrial/<br />
Warehouse<br />
3+ BDR<br />
Unit Unit 1,000 SF 1,000 SF<br />
Min 2 - - - - - -<br />
Max None - - - - - -<br />
Min 2 1 2 + 1/4 guest space/unit - 3.33 3.33<br />
Max None None None - None None<br />
Min 2 1 1.5 2 - 1 -<br />
Max<br />
None None None None - None -<br />
Min 2 - - - - - -<br />
Max<br />
None - - - - - -<br />
Min 2 1 1.5 2 - 1 -<br />
Max None None None None - None -<br />
Min 2 1 2 + 1/4 guest space/unit - 2 2<br />
Max None None None - None None<br />
Min - 1 1 1 - None -<br />
Max - None None None - 4 -<br />
Min 1 1 1 1 - 2 2<br />
Max None None None None - None None<br />
Min - - - - 1 1 0.5<br />
Max - - - - None None None<br />
Min 2 3.33 1-2*<br />
Max None None None<br />
* For industrial uses, 2 parking spaces/1000SF or 1 parking space/1000SF when providing alternative transportation facilities. For<br />
warehouse uses, 1 parking space/1000SF<br />
Recommendation #3: Create Flexibility to Meet/Reduce <strong>Parking</strong><br />
Requirements<br />
One of the primary challenges associated with minimum parking requirements is that they compel<br />
developers to provide expensive parking spaces even if the amount of parking required is not<br />
consistent with actual demand. The end result is a more expensive project that could potentially<br />
limit the amount and scale of development, or make a project infeasible altogether. While<br />
minimum parking standards in the <strong>Westside</strong> Community are only recommended to be adjusted in<br />
targeted ways, this <strong>Parking</strong> Management Plan strongly suggests expanding opportunities for<br />
12 See Preliminary Draft <strong>Westside</strong> Development Code for more detailed information on each zone.<br />
Nelson\Nygaard Consulting Associates Inc. • Page 3-6
<strong>Westside</strong> <strong>Parking</strong> <strong>Study</strong> • F inal <strong>Report</strong><br />
<strong>City</strong> of <strong>Ventura</strong><br />
developers to comply with minimum parking requirements through “state of the practice” parking<br />
management techniques.<br />
These techniques would not reduce parking minimums themselves, but provide a toolkit that<br />
allows a developer to meet their requirement in the most efficient way possible. By providing<br />
developers with the option and flexibility to meet parking standards, the <strong>City</strong> can promote an<br />
environment that is both friendly to development and supportive of multimodal and sustainable<br />
growth. Outlined below are potential alternative methods. It should be noted that none of these<br />
alternatives would be required – a developer would consider the cost of building the minimum<br />
parking requirement, weigh the market advantages for doing so, and would balance those<br />
considerations against the opportunity offered by any one or a combination of the techniques<br />
outlined below.<br />
Recommendation 3.A: Allow for lower minimums by right if the proposed project can<br />
demonstrate a sustainable Transportation Demand Management (TDM) program.<br />
TDM programs have proven to be very successful in reducing the need for drive-alone commute<br />
trips, and, consequently, the demand for parking. TDM programs work by providing incentives to<br />
use alternative modes. TDM measures can include, but are not limited to: pricing strategies (i.e.<br />
charging for parking), financial incentives (i.e. free transit passes), unbundling of parking pricing,<br />
carpools, vanpools, shuttle services, rideshare matching services, work schedule changes<br />
(telecommuting, flex time, etc.), travel training, marketing/outreach, provision of non-motorized<br />
infrastructure (i.e. bike parking), or commuter benefit programs.<br />
Numerous cities have adopted such provisions. Most recently, the <strong>City</strong> of Glendale approved a<br />
significant revision to its parking code, including a TDM ordinance that allows developers to<br />
achieve a significant reduction in their parking requirements. The more robust the program, the<br />
greater the reduction in parking that can be achieved. In Glendale, a relative “point value” has<br />
been given to each TDM measure based on its proven ability to reduce drive-alone rates and<br />
demand for parking. For example, research has shown that financial incentives, such as pricing of<br />
parking, parking cash out, and subsidized transit, are the most effective ways to reduce drive<br />
alone commutes. As such, these financial incentives would be assigned a higher point total than,<br />
for example, marketing services, an effective, yet less robust TDM measure. Research has also<br />
shown that a “well-balanced” TDM program that offers a variety of measures which support each<br />
other (e.g. a subsidized transit pass program in addition to a Guaranteed-Ride-Home program)<br />
will be more effective than a TDM program built around a single trip reduction measure.<br />
Therefore, to obtain more significant parking reductions a new development would have to<br />
demonstrate a TDM program that utilizes a variety of trip reduction measures. Depending on the<br />
total point value of the TDM program, each development would qualify for a reduction from the<br />
minimum parking requirements, ranging from a 10-30% reduction in required parking.<br />
<strong>Final</strong>ly, it is recommended that each development wishing to obtain a parking reduction by<br />
implementing a TDM program should also be subject to a number of additional requirements to<br />
ensure the effectiveness of the TDM program. These conditions include:<br />
• Annual <strong>Report</strong>ing: TDM programs are only as effective as their ongoing management. As<br />
a result, it is recommended that the <strong>City</strong> require that each development monitor its TDM<br />
program annually to not only ensure compliance among businesses and tenants, but also<br />
document effectiveness. The <strong>City</strong> should require that each development conduct an<br />
annual survey of its TDM programs and participants. This survey information would then<br />
be used to produce an annual citywide report which would document the mode share<br />
shifts and TDM participation. The Lloyd District TMA in Portland, Oregon provides an<br />
Nelson\Nygaard Consulting Associates Inc. • Page 3-7
<strong>Westside</strong> <strong>Parking</strong> <strong>Study</strong> • F inal <strong>Report</strong><br />
<strong>City</strong> of <strong>Ventura</strong><br />
excellent example of an annual effort made to evaluate and quantify the effects of TDM<br />
programs. 13<br />
• Leasing Requirement: Any development that obtains a parking reduction via a TDM<br />
program would need to include in the tenant lease a requirement for mandatory<br />
implementation of the approved TDM measures. This requirement would help to ensure<br />
that approved TDM measures are being implemented by all tenants of any new<br />
development, and that the parking reductions are justified. This requirement would run<br />
with the lease and not with the tenant. For residential projects, the TDM measures would<br />
be a part of the HOA agreement and could not be changed without penalty to the <strong>City</strong>.<br />
Recommendation 3.B: Allow shared on- and off-street spaces to count towards<br />
parking minimums.<br />
In order to maximize flexibility for developers and property owners, shared on-site or off-site<br />
parking should be allowed to satisfy 100% of the minimum parking requirement for each use, so<br />
long as documentation can be provided that the existing or anticipated land use(s) will have<br />
different periods of peak parking demand, that the shared parking can accommodate the parking<br />
demand for both uses, and reasonable provision has been made to allow off-site parkers to<br />
access the principal use (e.g. shuttle bus, valet parking, free transit passes, etc.). A similar<br />
approach has been successfully implemented in cities such as San Diego CA and Pasadena CA.<br />
The maximum distances between off-site parking facilities and the proposed use are discussed in<br />
Recommendation #1.B.<br />
In addition, on-street spaces should also be allowed to satisfy 100% of the minimum parking<br />
requirements. These on-street spaces would be limited to all of the spaces on the primary block<br />
face fronting the proposed land use.<br />
Recommendation 3.C: Allow for parking exemptions for commercial/retail changes of<br />
use smaller than 5,000 square feet.<br />
Section 24.415.020.A of the <strong>Ventura</strong> Municipal Code states: “Every use of property hereafter<br />
initiated, reinitiated, expanded, intensified, or changed, and every building hereafter erected,<br />
enlarged, or structurally altered to accommodate such uses shall be required to provide adequate<br />
off-street parking spaces and adequate provision for vehicle ingress and egress and onsite<br />
vehicle circulation to serve the parking area, in accordance with the provisions of this chapter.” In<br />
other words, if a building expansion creates an increase in floor area then additional parking must<br />
be provided to meet the minimum parking requirements. Such change of use and reuse<br />
regulations are particularly burdensome, especially for smaller commercial establishments that do<br />
not have space to add additional parking.<br />
Therefore, it is recommended that the <strong>City</strong> create a change of use exception that states that any<br />
changes in use of commercial/retail spaces less than 5,000 square feet are not required to add<br />
additional parking. Such revisions will help to encourage redevelopment of smaller commercial<br />
establishments by lowering the parking burden on developers.<br />
13 Lloyd District TMA – Annual <strong>Report</strong> 2010. (www.lloydtma.org)<br />
Nelson\Nygaard Consulting Associates Inc. • Page 3-8
<strong>Westside</strong> <strong>Parking</strong> <strong>Study</strong> • F inal <strong>Report</strong><br />
<strong>City</strong> of <strong>Ventura</strong><br />
Recommendation #4: Establish guidelines for a future residential<br />
permit program (RPP) in the <strong>Westside</strong> Community. Explore<br />
potential for a residential parking benefit district.<br />
Residential permit programs (RPP) are one of the most effective tools at managing spillover into<br />
residential neighborhoods. The <strong>City</strong> of <strong>Ventura</strong> currently has a Downtown <strong>Parking</strong> Permit<br />
Program and School Area Permit Program and has developed a process to examine and address<br />
many local parking management issues. Like most RPPs these programs operate by exempting<br />
permitted vehicles from the parking restrictions and time limits within a geographically defined<br />
area. Permit holders are able to essentially “store” their vehicle on the street, although holding a<br />
permit does not guarantee the availability of a parking space.<br />
RPPs work best in residential neighborhoods that are impacted by spillover from other uses,<br />
particularly competing demand from employees at nearby businesses or at large institutions such<br />
as hospitals, schools, or colleges. RPPs are also commonly used in neighborhoods that are<br />
impacted by regional commuters who might want to drive and park in a neighborhood that has<br />
convenient access to a transit node, such as a rail station or major express bus line.<br />
Currently, the <strong>Westside</strong> Community has more than adequate supply of parking – the peak<br />
occupancy for on- and off-street parking is 43%, meaning that even at the busiest times<br />
approximately 1,880 on- and off-street parking spaces are available. Nevertheless, a few<br />
localized parking challenges exist, as some businesses, land uses, and residential streets<br />
generate more parking demand than others. These localized inefficiencies can contribute to real<br />
imbalances between supply and demand, as well as exacerbate the perception that “parking is a<br />
problem” in the <strong>Westside</strong> Community. Residents can become particularly impacted by spillover<br />
parking, especially if they live on a block that consistently has higher demand and they are unable<br />
to park close to their residences, such experiences can contribute to the belief that there is a<br />
parking “shortage” in the <strong>Westside</strong> area.<br />
While the current levels of demand likely do not warrant a residential permit district in the<br />
<strong>Westside</strong> at this time, it is recommended that the <strong>City</strong> establish guidelines and policies for the<br />
formation of future districts. Provided below is a brief overview of the key issues to address as<br />
part of their implementation.<br />
Issues for RPP Implementation<br />
• Number of permits issued: The issuance of permits for RPPs is often not linked to the actual<br />
supply of parking spaces and many RPPs do not limit the number of permits that can be<br />
allocated to a household. Consequently, the number of permits issued solely to residents is<br />
far greater than the actual supply of parking spaces within a given district. In such cases, a<br />
resident permit becomes little more than a “hunting license.” As a result, residents may be<br />
irritated by the fact that they have to buy a permit and still cannot find parking.<br />
The <strong>City</strong> of <strong>Ventura</strong>’s existing Downtown Permit Program recognizes this challenge and<br />
bases the number of permits allocated upon an analysis of on-street utilization, off-street<br />
utilization, impact from non-residential uses, impact to neighborhood commercial and retail<br />
activity, existing land uses, non-conforming uses and other factors determined by the city<br />
traffic engineer. The <strong>City</strong> will issue no more than one sticker per residential unit and remains<br />
valid for a two year period.<br />
Current parking conditions in the <strong>Westside</strong> Community differ than those in <strong>Ventura</strong>’s<br />
downtown. However, it is recommended that if an RPP were to be established in the<br />
Nelson\Nygaard Consulting Associates Inc. • Page 3-9
<strong>Westside</strong> <strong>Parking</strong> <strong>Study</strong> • F inal <strong>Report</strong><br />
<strong>City</strong> of <strong>Ventura</strong><br />
<strong>Westside</strong> area, it follow similar guidelines and not allocate an unlimited number of permits per<br />
household.<br />
• Price of permits: Many RPPs either give their parking permits away for free or charge very<br />
little, which fails to provide any disincentive for residents to park on the street. The more<br />
expensive the parking permit is the more likely it is that residents will clean out a garage or<br />
park farther away, especially with multiple vehicles. Very high parking fees may encourage a<br />
shift to other travel modes, or elimination of unneeded vehicles.<br />
California’s statutory language related to residential permit programs dictates that cities can<br />
set permit fees based on a cost recovery model directly related to administrative costs. 14 Most<br />
California cities established their permit programs decades ago, and fees, if any, were based<br />
on basic criteria (such as printing costs) that did not fully account for other program costs,<br />
which include the application costs, costs of doing the initial parking study, putting up signs,<br />
and managing and enforcing the permit zone. As the number of preferential parking districts<br />
has grown and the number of permits allocated has likewise increased, so have the costs of<br />
administering citywide preferential parking programs, yet most cities have not raised their<br />
permit fees accordingly. Furthermore, if cities do decide to raise their fees, the rationale<br />
supporting such fee increases is often arbitrary. For example, many cities have based their<br />
fees simply on what neighboring cities have done and not on the actual costs of their<br />
program.<br />
Some cities have begun to document the fact that their permit programs are actually costing<br />
them more than they charge for permits and have taken steps to revise their permit fees. In<br />
general, these cities have begun to fully account for the myriad of costs associated with<br />
running a preferential permit program, such as staff time to evaluate district formation,<br />
process permit applications, manage the program; costs associated with materials, signage,<br />
and maintenance of districts; and the costs related to enforcement of the regulations. In San<br />
Francisco, for example, permit fees were recently increased from $76 to $96 per permit per<br />
year to cover the $8.4 million it costs to run their residential permit program (59 employees<br />
plus 35 parking control officers).<br />
<strong>Ventura</strong>’s current Permit Programs currently charge $20 per permit per two-year period that is<br />
based upon recovery of administrative costs associated with issuing the permit.<br />
• Periods of high demand: RPPs do little to manage parking during most periods of high<br />
demand, such as in the evenings near popular commercial corridors when competition for<br />
parking spaces is high between residents returning home from work and individuals wishing<br />
to access nearby businesses. Most RPPs end at 6 PM on weekdays and are not in effect on<br />
weekends. If the non-permit time limit is 2-hours, this essentially means that parking is wholly<br />
unregulated beginning at 4 PM in locations where RPP regulations end at 6 PM. In many<br />
neighborhoods, the highest parking demand is late afternoon and early evening, as residents<br />
return home with their cars while employees in the area have not yet departed.<br />
• 2-hour shuffle: RPPs can promote the “2-hour shuffle,” where non-residents move their cars<br />
to avoid parking enforcement. This shuffle results in highly localized traffic, congestion, noise,<br />
and pollution.<br />
• Maximizing use of parking spaces: RPPs generally benefit a narrow class of users, namely<br />
those residents that wish to park their car on the street during the weekday. Many residents<br />
drive their car to work, vacating the RPP for the day. In some cases, residents misuse<br />
14 California Vehicle Code, Section 22507.2: “The local authority may charge a nonrefundable fee to defray the costs of<br />
issuing and administering the permits.”<br />
Nelson\Nygaard Consulting Associates Inc. • Page 3-10
<strong>Westside</strong> <strong>Parking</strong> <strong>Study</strong> • F inal <strong>Report</strong><br />
<strong>City</strong> of <strong>Ventura</strong><br />
existing off-street facilities (such as a residential parking garage), often times using the<br />
parking garage as an additional storage facility. As a result, valuable on-street parking spaces<br />
that could benefit other users are underutilized and mismanaged.<br />
• Thresholds for implementation: Most cities with RPPs (including <strong>Ventura</strong>) require that there<br />
be a demonstrated spillover problem and a minimum level of support from local residents. In<br />
general, a utilization study must be conducted showing that a certain percentage of on-street<br />
spaces are occupied by non-residents (rates usually range from 65-75%). In addition, a<br />
petition must be signed by a minimum percentage of residential units (66% in <strong>Ventura</strong>)<br />
requesting establishment of the RPP.<br />
• Permit permanence: RPPs can create an environment of “permit permanence.” While most<br />
municipal codes allow for the dissolution of RPPs, almost no RPP is ever revoked once it has<br />
been established. Therefore, even if the parking characteristics of a neighborhood changes, it<br />
is unlikely that the RPP will adjust to meet those changes.<br />
RPP Implementation Guidance<br />
Given the issues identified above, it is recommended that if the <strong>City</strong> were to move forward with<br />
establishing an RPP for the <strong>Westside</strong> Community, the following steps can be taken to maximize<br />
the effectiveness of the program and ensure that it not only benefits residents, but also supports<br />
the overall transportation goals for the community.<br />
1. Build upon the existing RPP process established by the <strong>City</strong> of <strong>Ventura</strong> that established a<br />
variety of essential factors before allocating residential parking permits in an area.<br />
2. Count the number of available curb parking spaces in the area where the RPP is being<br />
considered and map the data. Obviously, the data gathered as part of this analysis would<br />
eliminate the need to do much of this fieldwork. However, it is always recommended to<br />
confirm the baseline data, especially if a significant amount of time has elapsed since it was<br />
first collected.<br />
Counting the number of curb parking spaces available in an area where a residential parking<br />
benefit district is being considered is an essential first step for any parking manager. It is the<br />
equivalent of knowing how many seats are in a movie theater, for the manager of the movie<br />
theater. Just as the manager of a movie theater cannot know how many tickets to sell without<br />
knowing how many seats exist, a parking manager cannot know how many parking permits to<br />
issue, unless he or she knows how many parking spaces exist.<br />
3. Count the number of residential units on each parcel within the same area. Add this<br />
information to the map of curb parking spaces completed in Step #1. As a base map for this<br />
effort, an Assessor's Parcel Map is often very useful. The Assessor's Parcel Map can be<br />
combined with Assessor’s Parcel Data on the ownership of each parcel to help identify how<br />
many properties exist in an area, the legal boundaries of those properties, the homeowners<br />
and/or landlords for each residential unit, and in turn, this information can help clarify the<br />
number of residential units on each property, and the tenants who reside in those units.<br />
4. Compare the existing number of residential units in the area to the number of available curb<br />
parking spaces in the area. Usually, the best visual presentation is to prepare a map showing<br />
(a) the total number of residential units on each block, and (b) the number of available curb<br />
parking spaces on each block face. For the entire area, it is important to determine the ratio of<br />
curb parking spaces to residential units. For example, if there are 1,000 on-street parking<br />
spaces and 500 residential units, then the ratio is 2.0 on-street parking spaces per unit.<br />
Nelson\Nygaard Consulting Associates Inc. • Page 3-11
<strong>Westside</strong> <strong>Parking</strong> <strong>Study</strong> • F inal <strong>Report</strong><br />
<strong>City</strong> of <strong>Ventura</strong><br />
5. Establish minimum utilization rates and levels of resident support. Conduct an occupancy<br />
study to establish occupancy and require a completed petition before proceeding with the<br />
formation of an RPP.<br />
6. Decide how many parking permits to issue. This number of permits can vary depending on<br />
the desired outcomes of the RPP. For example, the <strong>City</strong> of Pasadena caps the number of<br />
permits issued to 150% of on-street parking spaces. The ratio of permits issued to available<br />
on-street spaces is higher than 1:1 because of the fact that there are more units than spaces<br />
and the fact that not all permit holders will require a space at the same time. In other words,<br />
there is a “buffer” built in to account for variations in demand.<br />
Based on these ratios, determine how many permits be unit (resident and guest) should be<br />
issued.<br />
7. Resident permits should be priced to limit demand, and, ultimately, cover administrative costs.<br />
For example, the first permit could be issued for free, but if a resident wanted to buy more<br />
permits they would have to pay on a graduated scale (i.e. $10 for second permit, $25 for third,<br />
$50 for fourth, etc.). Without such pricing strategies it is likely that the on-street supply would<br />
be overwhelmed.<br />
In addition, as discussed above, cities have the authority to charge a permit fee that will cover<br />
the costs of program administration and overhead. In reality, few cities do, largely because<br />
charging full cost of permits would likely result in resident opposition. Moving forward, the <strong>City</strong><br />
of <strong>Ventura</strong> would need to further evaluate such policy decisions.<br />
8. Set a time limit on streets of one to two hours to prevent nonresidents from occupying spaces<br />
for long periods and encourage residents to use their garages for parking rather than storage.<br />
In the future, the <strong>City</strong> of <strong>Ventura</strong> may also wish to explore the formation of a residential parking<br />
benefit district in the <strong>Westside</strong> Community. The key difference between a parking benefit district<br />
and a standard permit district, as outlined above, is that a parking benefit district allows a limited<br />
number of non-residents to pay to use surplus on-street parking spaces in residential areas (see<br />
Appendix A Boulder, CO case study for example). The revenue generated by those permits can<br />
then used to fund various types of public improvements (street cleaning, maintenance,<br />
streetscape improvements, lighting, transportation programs, etc.) in the residential district. If a<br />
benefit district were to be pursued, some additional implementation steps would need to be taken.<br />
These include:<br />
9. Decide what percent of spaces should be reserved specifically for non-residents. For<br />
example, the <strong>City</strong> may wish to set aside 10% of curb spaces for visitor use. Visitors should be<br />
able to purchase daily passes online (if license plate recognition enforcement is available) or<br />
at a local civic building (as Pasadena does with its fire stations).<br />
10. Rather than entirely prohibit non-resident parking as with many conventional residential<br />
parking permit districts, the <strong>City</strong> should sell permits for any surplus parking capacity to nonresident<br />
commuters at fair market rates. These non-resident permits, though, should only be<br />
permitted during daytime hours when residential occupancy rates are lower.<br />
11. <strong>Final</strong>ly, the rates for non-resident parking permits should be set at fair market rates as<br />
determined by periodic city surveys. All net revenues above and beyond the cost of<br />
administering the program should be dedicated to pay for public improvements in the<br />
neighborhood where the revenue was generated. It is very likely that these non-resident<br />
permits may be priced at higher rates than resident permits due to market conditions.<br />
Nelson\Nygaard Consulting Associates Inc. • Page 3-12
<strong>Westside</strong> <strong>Parking</strong> <strong>Study</strong> • F inal <strong>Report</strong><br />
<strong>City</strong> of <strong>Ventura</strong><br />
Recommendation #5: Establish an in-lieu fee that is reflective of<br />
parking conditions in the <strong>Westside</strong> Community<br />
An in-lieu parking fee gives developers the option to pay a fee in-lieu of providing some portion of<br />
the number of parking spaces ordinarily required by the city’s zoning ordinance. The fee could be<br />
structured as either a fixed one-time fee per space or an annual fee per space. The fees collected<br />
can then be used to build public parking spaces, purchase private spaces for public use, or to<br />
support TDM strategies and/or improve overall mobility. In-lieu fees are particularly appropriate<br />
for adaptive reuse redevelopment projects that would not be financially or architecturally feasible<br />
if forced to provide all required minimum spaces on-site. An in-lieu fee can encourage new<br />
development of the highest architectural and urban design quality as well as the redevelopment<br />
of vacant, underutilized, historic, and/or dilapidated buildings.<br />
In-lieu fees have many benefits for both cities and developers. The fees provide flexibility for<br />
developers. If providing all of the required parking would be difficult or prohibitively expensive for<br />
developers, then they have the option to pay the fee instead. In addition, since the fees can be<br />
used to pay for spaces in public lots, more uses can share parking. An in-lieu fee can be<br />
combined with other techniques for meeting parking requirements including the use of shared<br />
parking, tandem or valet parking or stacked parking to encourage better management of parking<br />
spaces provided on and off-site.<br />
The <strong>City</strong> of <strong>Ventura</strong> currently has an in-lieu fee for the Downtown. The fee is a one-time fee<br />
priced at $24,896 per space (adjusted for inflation). These fees are unique to <strong>Ventura</strong>’s downtown<br />
and are set to account for the high costs of building structured parking garages. As a result, the<br />
current in-lieu fee for <strong>Ventura</strong>’s downtown would likely not be appropriate for the <strong>Westside</strong><br />
Community, given both its mix of land uses and current parking conditions.<br />
Therefore, it is recommended that any in-lieu fee program for the <strong>Westside</strong> Community be more<br />
appropriately structured to fit the local context. More specifically, the in-lieu fee should be an<br />
amount that is roughly equivalent to the cost and longevity of a surface space, given the lack of<br />
structured parking in the <strong>Westside</strong>. In addition, an annual fee is recommended for the <strong>Westside</strong><br />
Community because it can reduce the risk to developers who do not want to pay a larger up-front<br />
fee while their project has yet to be fully financed or constructed. It is also recommended that any<br />
developer be allowed to forgo 100% of its minimum parking requirement by paying the in-lieu fee.<br />
It is recommended that any revenue generated by an in-lieu fee program be primarily used to<br />
purchase or lease existing private parking facilities within the <strong>Westside</strong> Community. These<br />
facilities would be made publicly available and added to the “pool” of public parking. Other<br />
potential expenditures of in-lieu fee revenue could include funding enhanced mobility or TDM<br />
programs as a means to further reduce parking demand in the study area.<br />
Recommendation #6: Revise time restrictions on North <strong>Ventura</strong><br />
Avenue from 1-hour to 2-hour parking.<br />
As shown in Figure 1-9, North <strong>Ventura</strong> Avenue is one of the few streets in the study area that has<br />
time restrictions. From Park Row Avenue north to Lewis Street / Sunnyway Drive, most block<br />
faces have a 1-hour time limit. These restrictions have been established as a means to<br />
encourage turnover so that customers can access businesses more easily. Based on the turnover<br />
study, it appears that these restrictions are encouraging more vehicle turnover than at<br />
unrestricted spaces. Figure 3-2 shows that, on average, vehicles parked between Park Row<br />
Avenue and Lewis Street are staying for a shorter period of time than elsewhere on North<br />
<strong>Ventura</strong> Avenue, as well as across the study area as a whole.<br />
Nelson\Nygaard Consulting Associates Inc. • Page 3-13
<strong>Westside</strong> <strong>Parking</strong> <strong>Study</strong> • F inal <strong>Report</strong><br />
<strong>City</strong> of <strong>Ventura</strong><br />
Figure 3-2<br />
Average Vehicle Duration on North <strong>Ventura</strong> Avenue<br />
Geographic Area Thursday Saturday<br />
N. <strong>Ventura</strong> - All 2.91 1.52<br />
N. <strong>Ventura</strong> - Park Row Ave. to Lewis St. 2.88 1.44<br />
<strong>Study</strong> Area 3.38 3.30<br />
At the same time, however, vehicles are staying, on average, longer than the posted 1-hour time<br />
limit. On Thursday, for example, the average vehicle was parking for 2 hours and 52 minutes in<br />
the 1-hour restricted spaces. It is probable that some of these vehicles are owned by employees<br />
working in the area and parking all day long while at work. It is also possible that some motorists<br />
need more than one hour to complete their errands in the study area. Nevertheless, it appears<br />
that the 1-hour time restriction is being violated on a consistent basis.<br />
It is recommended that the <strong>City</strong> address this issue in two ways:<br />
• Lengthen the 1-hour restriction to two hours. Based on the existing low utilization rates, it<br />
appears that there is limited need for a “tighter” time limit of one hour. A 2-hour time limit<br />
would provide additional flexibility for customers while helping to ensure retailers that<br />
there is still adequate turnover of spaces for North <strong>Ventura</strong> Avenue businesses.<br />
• The <strong>City</strong> should prioritize better enforcement of these restrictions because they are only<br />
as effective as their enforcement. Based on the turnover study, it does not appear that<br />
motorists are particularly mindful of the time restrictions, potentially due to limited<br />
enforcement. If availability of spaces on North <strong>Ventura</strong> Avenue becomes a challenge in<br />
the future 15 , the first remedy would be to increase parking enforcement in these areas,<br />
with particular attention paid to the time restricted spaces on North <strong>Ventura</strong> Avenue.<br />
Recommendation #7: If future utilization studies warrant it,<br />
authorize staff to set time limits and if necessary, install parking<br />
meters to manage future parking demand.<br />
Based on current demand and utilization rates, pricing of on-street spaces is not currently needed<br />
in the study area. In short, demand is currently too low to necessitate implementation of parking<br />
meters. However, should future demand warrant it, pricing of parking remains the most effective<br />
strategy in a city’s “toolbox” to manage demand and ensure that parking supports the overall<br />
goals of an integrated transportation system.<br />
Therefore, if parking demand increases beyond an 85% utilization in areas without time limits, the<br />
city should implement time limits in those areas. If parking demand is still greater than 85%<br />
utilization it is recommended that the <strong>City</strong> authorize staff to replace time limits and implement an<br />
on-street pricing management strategy for the <strong>Westside</strong> Community. The metering of streets<br />
should be considered a potential long-term solution only if time limits do not manage parking<br />
demand. The <strong>City</strong> of <strong>Ventura</strong> parking meter rate is set by the <strong>City</strong> Council. During a fiscal year,<br />
the <strong>City</strong> Transportation Manager may adjust pay station and meter rates up or down 50 cents per<br />
hour in 25 cent increments based on average occupancy rates to achieve a target occupancy rate<br />
of 85% utilization.<br />
15 Current occupancy levels on North <strong>Ventura</strong>, south of Lewis Street, peak at less than 50% on Thursday.<br />
Nelson\Nygaard Consulting Associates Inc. • Page 3-14
<strong>Westside</strong> <strong>Parking</strong> <strong>Study</strong> • F inal <strong>Report</strong><br />
<strong>City</strong> of <strong>Ventura</strong><br />
Appendix A. Best Practices in <strong>Parking</strong><br />
Management<br />
This appendix reviews the parking and transportation policies of three highly successful mixeduse<br />
communities. It showcases some of the best management techniques available for parking<br />
and transportation in order to inform the development of the <strong>Westside</strong> <strong>Parking</strong> Management Plan.<br />
Case <strong>Study</strong> 1 - Old Pasadena, California<br />
Introduction<br />
In contrast to the image of the <strong>City</strong> of Los Angeles itself, Old Pasadena has gained a reputation<br />
for being a pedestrian-friendly, vibrant downtown, that combines a mix of uses with easy access<br />
by the automobile. Much of the area’s success can be attributed to its parking management<br />
policies that have spawned a wide variety of streetscape improvements and new opportunities for<br />
increased transit ridership and development. Old Pasadena, however, was not always so<br />
prosperous.<br />
By the 1970s, much of Pasadena’s downtown had been slated for redevelopment, as the<br />
decaying neighborhood had become the city’s “Skid Row.” Since then, it has been revived as<br />
“Old Pasadena” – a revival in which extensive investments in the public realm, funded by parking<br />
meter revenue, have played a major role. In 2001, net parking meter revenue (after collection<br />
costs) amounted to $1.2 million, all of which is used for public services in that part of the city.<br />
Sales tax revenue in Old Pasadena increased more than tenfold over 10 years, to more than $2<br />
million per year in 1999. In contrast, sales tax revenue at the adjacent shopping mall, Plaza<br />
Pasadena, which provided free parking, has been stagnant. The mall was “turned inside out” and<br />
converted to mixed uses in 2001. Its blank walls were changed to storefronts that resemble those<br />
in Old Pasadena, while hundreds of apartments were added on top.<br />
This revival has also been enabled by the <strong>City</strong>’s policies on public parking, “parking credits”, and<br />
adaptive reuse. Stefanos Polyzoides, a local architect and urban designer and co-founder of the<br />
Congress for the New Urbanism, attributes much of the success of Old Pasadena to the “rules<br />
that allowed development to go forward with less than the traditional parking requirements. This<br />
has encouraged pedestrian activity in Old Pasadena, giving it a dynamic pedestrian<br />
environment.” <strong>Final</strong>ly, parking researcher Donald Shoup calculates that the <strong>Parking</strong> Credit<br />
program reduces the cost to the developer of parking provision for adaptive reuse projects to just<br />
2.5% of the cost of on-site provision. This strategy represents an innovative way to mitigate<br />
limiting parking minimum restrictions, and is explored in more detail below.<br />
Old Pasadena’s <strong>Parking</strong> Credit Program<br />
The city’s “<strong>Parking</strong> Credit Program”, begun in 1987, allows property owners in Old Pasadena to<br />
enter into a contract with the city to buy “zoning parking credits”, in lieu of constructing additional<br />
parking spaces to satisfy minimum parking requirements. However, this is not a typical “in-lieu<br />
fee” program. Former Pasadena Development Administrator Marsha Rood defines each parking<br />
credit as “an entitlement to apply parking spaces in a publicly available garage towards parking<br />
requirements for development.” The city issues 1.5 parking credits per space in the public<br />
garages, and therefore credits are limited. Since the early 2000s, additional public parking spaces<br />
have been added to the general credit pool (approximately 102 spaces/153 credits at the One<br />
Colorado development), and dependent on demand for credits, more public spaces may be<br />
Nelson\Nygaard Consulting Associates Inc. • Page A-1
<strong>Westside</strong> <strong>Parking</strong> <strong>Study</strong> • F inal <strong>Report</strong><br />
<strong>City</strong> of <strong>Ventura</strong><br />
added in the future. As of 2009, 67 credits were available to eligible applicants. Though the fee<br />
was originally set at a very low rate ($50 in 1987) to encourage business development, the rate<br />
has increased following yearly CPI adjustments; in 2004, the fee was set at $127 per space per<br />
year, still far below the market cost to build a new parking space.<br />
The <strong>Parking</strong> Credit Program has been particularly important in allowing adaptive reuse of historic<br />
buildings that were built without parking, where minimum parking requirements would be<br />
triggered by a change in use. Since few of the buildings in this historic part of the city have off -<br />
street parking, this removed one of the major barriers to adaptive reuse. The fee is annual, rather<br />
than the lump sum common for similar fees in many other cities, allowing developers to avoid<br />
financing problems. (On the downside, this has created some revenue collection issues,<br />
particularly where property has changed owners.) In 2002, the criteria were tightened, with<br />
eligibility limited to designated historic buildings, and buildings that would require additional<br />
parking following rehabilitation or a change in use.<br />
The revenue generated by parking credits has helped to maintain and operate Old Pasadena’s<br />
four public parking facilities. Although these revenues provide only a small portion – 5% – of the<br />
funding needed to operate the garages, they do provide the link between the waiver in minimum<br />
parking requirements and the availability of public parking for a variety of uses. The public parking<br />
structures provide 90 minutes of free parking, and then charge $2 per hour up to a maximum of<br />
$6 per day. This provides spaces for visitors who are unwilling to pay the $1 per hour charge for<br />
metered spaces.<br />
Additionally, three off-street parking facilities provide almost 1,600 parking spaces, as seen<br />
below. For these facilities, the first 90 minutes are free, followed by an hourly fee of $2 and a<br />
maximum daily rate of $6. 16<br />
Figure A-1<br />
Facility<br />
Schoolhouse Block<br />
<strong>Parking</strong> Structure<br />
De Lacey <strong>Parking</strong><br />
Structure<br />
<strong>Of</strong>f-Street <strong>Parking</strong> Facilities in Old Pasadena<br />
Hours of<br />
No. of Spaces<br />
Hourly Rates<br />
Operation<br />
901<br />
516<br />
24 hours a day, 7<br />
days a week<br />
24 hours a day, 7<br />
days a week<br />
First 90 mins. Free; $2 / Hr.;<br />
$6 max; $5 flat fee (10 PM -<br />
5 AM)<br />
First 90 mins. Free; $2 / Hr.;<br />
$6 max; $5 flat fee (10 PM -<br />
5 AM)<br />
Monthly Rate<br />
$55<br />
$65<br />
Marriott <strong>Parking</strong><br />
Structure<br />
147<br />
24 hours a day, 7<br />
days a week<br />
First 90 mins. Free; $2 / Hr.;<br />
$6 max; $5 flat fee (10 PM -<br />
5 AM)<br />
$65 (5 days), $75<br />
(7 days)<br />
16 <strong>Study</strong> references: <strong>City</strong> of Pasadena (2002), Old Pasadena Zoning Credit <strong>Parking</strong> Program Guidelines.<br />
<strong>City</strong> of Pasadena (2009). Zoning <strong>Parking</strong> Credit Program Current Activity – <strong>Report</strong>ing Period – July 1, 2008 through<br />
June 30, 2009. Staff <strong>Report</strong> to Old Pasadena <strong>Parking</strong> Meter Zone Advisory Commission, June 18, 2009.<br />
<strong>City</strong> of Pasadena (2009). Minutes of the Special Meeting. Old Pasadena <strong>Parking</strong> Meter Zone Advisory Commission,<br />
Thursday, October 1, 2009.<br />
Gruber, Frank (2001), “The Black Hole of Planning,” The Look Out, June 8, 2001.<br />
Litman, Todd, <strong>Parking</strong> Management Best Practices. Institute for Transportation Engineers.<br />
Kolozsvari, Douglas and Shoup, Donald (2003), “Turning Small Change into Big Changes,” Access, 23, pp 2-7.<br />
Shoup, Donald, The High Cost of Free <strong>Parking</strong>, 2005<br />
Nelson\Nygaard Consulting Associates Inc. • Page A-2
<strong>Westside</strong> <strong>Parking</strong> <strong>Study</strong> • F inal <strong>Report</strong><br />
<strong>City</strong> of <strong>Ventura</strong><br />
Case <strong>Study</strong> 2 - Petaluma, California SmartCode<br />
Introduction<br />
In June, 2003, Petaluma, California, adopted a precise New Urbanist development code for<br />
approximately 400 acres of the central city. Revitalization of the area, a mixture of partly vacant<br />
historic buildings, tired strip malls, abandoned car dealerships, riverfront warehouses, and<br />
greenfield parcels had been difficult. The existing code was largely designed to produce singleuse,<br />
auto-oriented, conventional suburban development.<br />
The adopted code is the first example in the nation of implementing Duany Plater-Zyberk’s new<br />
SmartCode, which is a New Urbanist code distributed by the nonprofit Center for Applied<br />
Transect Studies (CATS). A key element in the code’s success proved to be the immediate<br />
drastic reduction of parking requirements and, in the code’s second phase, the abolition of all<br />
minimum parking requirements.<br />
Petaluma’s SmartCode<br />
As part of Petaluma’s Central Petaluma Specific Plan, adopted in 2003, the SmartCode was<br />
designed to “[provide] a system for ensuring that the design of the public realm and the design of<br />
private buildings are rigorously coordinated, and are focused on the pedestrian experience. It<br />
defines what is essentially a “kit of parts”, with instructions, for building an urban district…”<br />
Originally developed by Duany Plater-Zyberk & Company, an architecture and planning firm<br />
based in Miami, Florida, SmartCode is available to local jurisdictions as a model code for free.<br />
SmartCode also includes goals and strategies consistent with New Urbanist ideology, such as<br />
creating walkable neighborhoods using a form-based code, and linking zoning categories to their<br />
urban or rural character (the “rural-urban transect”). All zoning categories in SmartCode allow a<br />
mix of uses.<br />
The Dawn (and Dusk) of New <strong>Parking</strong> Requirements<br />
In June, 2003, the city of Petaluma, California implemented its version of the SmartCode. In<br />
addition to providing guidance on scaled, mixed-use zoning, pedestrian facilities, and streetscape<br />
design, the SmartCode outlines two policies to improve parking in central Petaluma. As identified<br />
by the Specific Plan, these policies are designed to accomplish the primary goal to “Maximize<br />
opportunities for shared parking,” and include:<br />
• Policy 4.1: Encourage structured parking facilities.<br />
• Policy 4.2: Establish procedures for financing structured parking facilities. (This policy<br />
includes instituting “in lieu” fees.)<br />
Like many zoning codes, the SmartCode includes guidance on location of parking, size of parking<br />
spaces, specifications on access to parking, and requirements for lighting and surfacing for<br />
parking lots. Although the Code does identify baseline parking minimum requirements, it also<br />
includes several progressive parking policy elements, the most pertinent of which are<br />
summarized below:<br />
• Reduction of <strong>Parking</strong> Requirements (Section 6.10.030). <strong>Parking</strong> minimums may be<br />
reduced under the following conditions.<br />
o<br />
Alternative parking arrangements. Applicants execute an agreement with the <strong>City</strong><br />
to:<br />
Nelson\Nygaard Consulting Associates Inc. • Page A-3
<strong>Westside</strong> <strong>Parking</strong> <strong>Study</strong> • F inal <strong>Report</strong><br />
<strong>City</strong> of <strong>Ventura</strong><br />
o<br />
o<br />
o<br />
o<br />
• Pay a parking in-lieu fee. In-lieu fee initially set at $20,000 per parking<br />
space though variable by location, with annual fee adjustments.<br />
• Waive the right to protest the formation of a parking district.<br />
• Provide some other fair share contribution acceptable to the review<br />
authority.<br />
Shared on-site parking. Where two or more uses on the same site have distinct<br />
and different peak parking usage periods, the Director may consider a reduction in<br />
the number of required spaces.<br />
Waiver of parking. The Director may reduce or waive the number of required<br />
spaces based on quantitative information provided by the applicant that<br />
documents the need for fewer spaces (e.g., sales receipts, information on land use<br />
standards from other cities for the proposed land use, etc.).<br />
Waiver of parking – <strong>Of</strong>f-hour uses. Requirements may be waived for uses that are<br />
determined to operate exclusively after the evening peak parking demand period<br />
(i.e., when sufficient on-street parking will be available).<br />
Waiver of parking – Reduction of water pollution and stormwater run-off. Whatever<br />
fraction of a parking lot is surfaced with permeable paving will receive that fraction<br />
of a 20% reduction in the parking minimum.<br />
Perhaps the most striking element of the SmartCode’s parking requirement section is its inclusion<br />
of a sunset clause – that is, the specification of the date on which the required parking minimums<br />
will expire. According to the Code section 6.10.070, “Effective January 1, 2008, there shall be no<br />
minimum parking requirements for any use.” 17<br />
17 <strong>Study</strong> references: SmartCode Central. http://www.smartcodecentral.org/<br />
<strong>City</strong> of Petaluma (2003). Central Petaluma Specific Plan, adopted June 2, 2003.<br />
Nelson\Nygaard Consulting Associates Inc. • Page A-4
<strong>Westside</strong> <strong>Parking</strong> <strong>Study</strong> • F inal <strong>Report</strong><br />
<strong>City</strong> of <strong>Ventura</strong><br />
Case <strong>Study</strong> 3 - Boulder, Colorado<br />
Introduction<br />
Boulder’s downtown business district, having recovered from near death in the 1970’s, today<br />
comprises over 1,200 businesses and roughly 10,000 employees. Faced with both a shortage of<br />
parking for customers and citizens' aversion to additional traffic, the city developed a program<br />
that combines reduced subsidies for downtown parking with aggressive transportation demand<br />
management. These initiatives have been introduced through a special <strong>Parking</strong> Benefit District –<br />
the Central Area General Improvement District (CAGID), which was established in the 1970s. The<br />
Board of CAGID, which makes the final decisions on issues such as new parking construction, is<br />
comprised of the <strong>City</strong> Council. However, considerable power over decisions such as parking<br />
charges is held by the Downtown Management Commission (DMC), which is made up of local<br />
businesses and property owners, although its actions are subject to <strong>City</strong> Council review.<br />
All downtown parking revenue, including more than $1 million per year from meters and over $2<br />
million per year from garages, is returned to CAGID for area improvements. Among other things,<br />
the revenue is used to fund more than $325,000 per year worth of transportation demand<br />
management programs, including a free universal transit pass for all downtown employees (“Eco-<br />
Pass”), a Guaranteed Ride Home program, ride-matching services, bicycle parking and a number<br />
of other benefits.<br />
Boulder is useful as an example of a community that has been steadily evolving from a relatively<br />
low density, auto-oriented suburban city, to a community focused on parking management and<br />
transit-oriented development. Key characteristics include a desire to create a walkable, vibrant<br />
community, with a focus on a high quality of life.<br />
Neighborhood Permit <strong>Parking</strong> (NPP) Zones<br />
Background<br />
In order to contain overspill parking from commuters trying to avoid parking restrictions and<br />
charges downtown, Boulder has developed a Neighborhood <strong>Parking</strong> Benefit District program that<br />
offers a host of benefits to residents, visitors, and commuters alike.<br />
According to the <strong>City</strong> of Boulder, the <strong>City</strong> Council adopted a Residential <strong>Parking</strong> Program (RPP)<br />
in 1986 as a way to curb spillover parking in residential neighborhoods. The program was first<br />
implemented in two residential neighborhoods in 1993, but concerns arose soon after about the<br />
effectiveness of the program. In 1997, the Neighborhood Permit <strong>Parking</strong> program was adopted as<br />
an improved version of the earlier strategy. Designed to better balance a variety of users, the new<br />
NPP program included several additional benefits, including:<br />
• <strong>Of</strong>fering commuter permits within permit parking zones<br />
• Greater flexibility in the span and duration of restrictions to match the needs of individual<br />
neighborhoods<br />
• Introducing a short-term parking component<br />
There are two primary goals of the program. First, to the <strong>City</strong> seeks “to improve the balance<br />
between preserving neighborhood character and providing public access to community facilities.”<br />
In 2009, the program was reported to have “continued to meet this goal. The majority of<br />
residential streets within the NPP zones are less congested; short-term parking has been<br />
maintained and, in some places, created; and commuter parking permits provide for long-term<br />
Nelson\Nygaard Consulting Associates Inc. • Page A-5
<strong>Westside</strong> <strong>Parking</strong> <strong>Study</strong> • F inal <strong>Report</strong><br />
<strong>City</strong> of <strong>Ventura</strong><br />
parking opportunities.” Second, the program is designed to be revenue-neutral, whereby revenue<br />
from the sale of commuter and residential permits covers the costs of administering the program.<br />
As seen in Figure A-2 , this balance is not always attained. In 2009, it was reported that “with the<br />
addition and expansions of several NPP’s during the last two years, there were expenses which<br />
exceeded revenues.” There were ten NPP zones in 2009.<br />
Operations<br />
According to the <strong>City</strong>, vehicles without an NPP permit may park one time only, per day, per NPP<br />
zone for the posted time limit and may not re-park in that zone again on the same day. Vehicles<br />
with a valid permit are exempt from these restrictions.<br />
Permits are available for residents, local businesses, and commuters. Residents living in a<br />
Neighborhood Permit <strong>Parking</strong> zone may purchase up to two resident permits for each vehicle<br />
registered in their name for $17 per permit, per year. A maximum of two visitor permits may be<br />
obtained by each permitted household for no charge. Additionally, guest permits are also free<br />
upon resident request. In general, businesses located within a zone may purchase up to three<br />
business permits for use by its employees for $75 per year each; larger businesses may apply for<br />
additional permits as necessary.<br />
Indicative of the successful integration of on- and off-street management, non-resident<br />
commuters are also eligible to buy on-street parking permits on a limited basis for $78 per quarter<br />
(or $312 per year). Regarding commuter permits, Donald Shoup summarizes that “Each permit is<br />
valid on a specific block face, and no more than four nonresident permits are sold on any block.<br />
The city periodically surveys the parking occupancy on all blocks in each permit zone and sells<br />
nonresident permits only on blocks that have a vacancy rate greater than 25% between 9 AM and<br />
5 PM. This approach ensures that each block has vacant parking spaces for both residents and<br />
commuters.” In 2007, the <strong>City</strong> Council approved extending the sunset clause for the commuter<br />
permit program to December 31, 2012. In 2009, the annual utilization rate (annual permits sold<br />
per available commuter spaces) was approximately 19%.<br />
Figure A-2 Boulder Neighborhood Permit <strong>Parking</strong> Program Revenue and<br />
Expenditure, 2009<br />
Revenue from Resident/Business/Visitor Permits Sales $35,597<br />
Revenue from Commuter Permit Sales $46,592<br />
Revenue subtotal $82,189<br />
NPP Program Direct Expenses (excluding enforcement) $76,856<br />
Administrative Program Expenses $13,772<br />
Cost subtotal $90,627<br />
Difference between revenues and costs ($8,438)<br />
Enforcement of NPP areas is sophisticated, with city personnel entering license plates into a<br />
handheld commuter; this ensures that motorists cannot evade the restrictions by simply moving<br />
their cars every few hours. In 2009, about 10% of all parking tickets written by Boulder <strong>Parking</strong><br />
Nelson\Nygaard Consulting Associates Inc. • Page A-6
<strong>Westside</strong> <strong>Parking</strong> <strong>Study</strong> • F inal <strong>Report</strong><br />
<strong>City</strong> of <strong>Ventura</strong><br />
Services were issued for NPP violations. If all tickets for these violations had been collected, the<br />
total revenue would have been $182,500. 18<br />
18 <strong>Study</strong> references: <strong>City</strong> of Boulder, http://www.bouldercolorado.gov<br />
<strong>City</strong> of Boulder (2003), Transportation Master Plan. Approved by <strong>City</strong> Council September 16, 2003.<br />
<strong>City</strong> of Boulder (2003), Neighborhood <strong>Parking</strong> Program 2009. Annual Update. Staff <strong>Report</strong> to <strong>City</strong> Council, April 19,<br />
2010.<br />
Steuteville, Robert (2003), “Boulder: a model for excellence in mixed-use design,” New Urban News, December 2003.<br />
Shoup, Donald, “The High Cost of Free <strong>Parking</strong>,” 2005, p. 451.<br />
US Environmental Protection Agency (undated), Downtown Boulder. Best Workplaces for Commuters District.<br />
www.commuterchoice.gov/campaign/boulder.htm<br />
Nelson\Nygaard Consulting Associates Inc. • Page A-7