Village of Port Jefferson Mill Creek Watershed Management Plan
Village of Port Jefferson Mill Creek Watershed Management Plan
Village of Port Jefferson Mill Creek Watershed Management Plan

Create successful ePaper yourself
Turn your PDF publications into a flip-book with our unique Google optimized e-Paper software.
<strong>Village</strong> <strong>of</strong> <strong>Port</strong> <strong>Jefferson</strong><br />
<strong>Mill</strong> <strong>Creek</strong> <strong>Watershed</strong> <strong>Management</strong> <strong>Plan</strong><br />
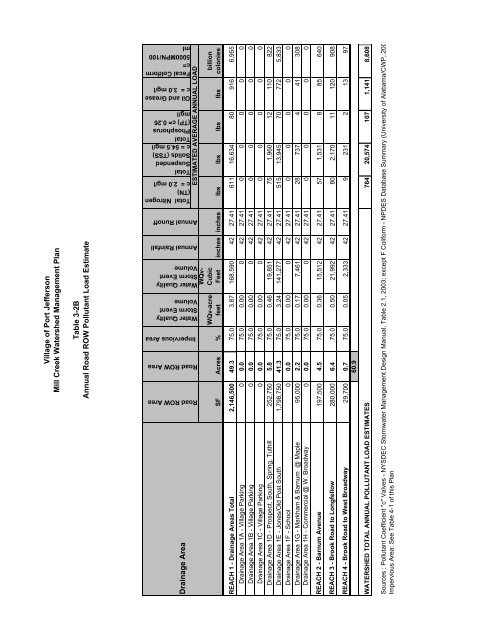
Table 3-2B<br />
Annual Road ROW Pollutant Load Estimate<br />
Total Nitrogen<br />
(TN)<br />
c = 2.0 mg/l<br />
Total<br />
Suspended<br />
Solids (TSS)<br />
c = 54.5 mg/l<br />
Total<br />
Phosphorus<br />
(TP) c= 0.26<br />
mg/l<br />
Oil and Grease<br />
c = 3.0 mg/l<br />
Fecal Coliform<br />
c=<br />
5000MPN/100<br />
ml<br />
SF Acres %<br />
ESTIMATED AVERAGE ANNUAL LOAD<br />
Road ROW Area<br />
Road ROW Area<br />
Impervious Area<br />
Water Quality<br />
Storm Event<br />
Volume<br />
Water Quality<br />
Storm Event<br />
Volume<br />
Annual Rainfall<br />
Annual Run<strong>of</strong>f<br />
Drainage Area<br />
WQv-acrefeet<br />
WQv-<br />
Cubic<br />
Feet inches inches lbs lbs lbs lbs<br />
billion<br />
colonies<br />
REACH 1 - Drainage Areas Total 2,146,500 49.3 75.0 3.87 168,590 42 27.41 611 16,634 80 916 6,955<br />
Drainage Area 1A - <strong>Village</strong> Parking 0 0.0 75.0 0.00 0 42 27.41 0 0 0 0 0<br />
Drainage Area 1B - <strong>Village</strong> Parking 0 0.0 75.0 0.00 0 42 27.41 0 0 0 0 0<br />
Drainage Area 1C - <strong>Village</strong> Parking 0 0.0 75.0 0.00 0 42 27.41 0 0 0 0 0<br />
Drainage Area 1D - Prospect, South, Spring, Tuthill 252,750 5.8 75.0 0.46 19,851 42 27.41 75 1,960 12 110 822<br />
Drainage Area 1E - Jones/Old Post South 1,798,750 41.3 75.0 3.24 141,277 42 27.41 515 13,945 70 772 5,833<br />
Drainage Area 1F - School 0 0.0 75.0 0.00 0 42 27.41 0 0 0 0 0<br />
Drainage Area 1G - Markham & Barnum @ Maple 95,000 2.2 75.0 0.17 7,461 42 27.41 28 737 4 41 308<br />
Drainage Area 1H - Commercial @ W. Broadway 0 0.0 75.0 0.00 0 42 27.41 0 0 0 0 0<br />
REACH 2 - Barnum Avenue 197,500 4.5 75.0 0.36 15,512 42 27.41 57 1,531 8 85 640<br />
REACH 3 - Brook Road to Longfellow 280,000 6.4 75.0 0.50 21,992 42 27.41 80 2,170 11 120 908<br />
REACH 4 - Brook Road to West Broadway 29,700 0.7 75.0 0.05 2,333 42 27.41 9 231 2 13 97<br />
60.9<br />
WATERSHED TOTAL ANNUAL POLLUTANT LOAD ESTIMATES<br />
764 20,574 107 1,141 8,608<br />
Sources : Pollutant Coefficient "c" Valves - NYSDEC Stormwater <strong>Management</strong> Design Manual, Table 2.1, 2003; except F Coliform - NPDES Database Summary (University <strong>of</strong> Alabama/CWP, 200<br />
Impervious Area: See Table 4-1 <strong>of</strong> this <strong>Plan</strong>