LNAPL Modeling recovery and endpoint example
LNAPL Modeling recovery and endpoint example
LNAPL Modeling recovery and endpoint example

Create successful ePaper yourself
Turn your PDF publications into a flip-book with our unique Google optimized e-Paper software.
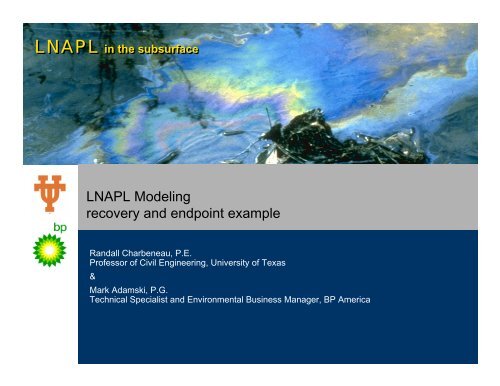
<strong>LNAPL</strong> in the subsurface<br />
<strong>LNAPL</strong> <strong>Modeling</strong><br />
<strong>recovery</strong> <strong>and</strong> <strong>endpoint</strong> <strong>example</strong><br />
R<strong>and</strong>all Charbeneau, P.E.<br />
Professor of Civil Engineering, University of Texas<br />
&<br />
Mark Adamski, P.G.<br />
Technical Specialist <strong>and</strong> Environmental Business Manager, BP America
Objective<br />
1. Describe the API<br />
<strong>LNAPL</strong> Liquid<br />
Distribution <strong>and</strong><br />
Recovery <strong>Modeling</strong><br />
Tool (LDRM).<br />
2. Demonstrate<br />
application of the<br />
modeling tool for a<br />
petroleum refinery.<br />
<strong>LNAPL</strong> in the subsurface
<strong>LNAPL</strong> Liquid Distribution <strong>and</strong> Recovery<br />
<strong>Modeling</strong> (LDRM) Tool<br />
Purpose: provide a simple, physically based model to assess<br />
<strong>LNAPL</strong> distribution <strong>and</strong> <strong>recovery</strong> using conventional <strong>LNAPL</strong><br />
liquid <strong>recovery</strong> technologies (single <strong>and</strong> dual-pump wells,<br />
vacuum-enhanced wells, skimmer wells, <strong>and</strong> trenches) based<br />
on <strong>LNAPL</strong> thickness in a monitoring well<br />
Chronology:<br />
• 1999 Release (API #4682) – dual spreadsheet model using Brooks <strong>and</strong><br />
Corey parameters <strong>and</strong> a simplified relative permeability function (based<br />
on the Burdine equations)<br />
• 2003 Release (API #4729) – multiple spreadsheets (st<strong>and</strong> alone) using<br />
van Genuchten parameters with different spreadsheets for Burdine <strong>and</strong><br />
Mualem relative permeability models, <strong>and</strong> for single <strong>and</strong> two-layer<br />
representations<br />
• 2007 Release (API 4760) – single “Windows” application using van<br />
Genuchten parameters with option of 1-, 2- or 3-layers, relative<br />
permeability models, units, data representation, <strong>and</strong> vertical gradient<br />
through FGS<br />
<strong>LNAPL</strong> in the subsurface
Recovery Well Application<br />
<strong>LNAPL</strong> Plume may be covered by multiple capture<br />
regions, each considered separately<br />
<strong>LNAPL</strong> in the subsurface
Scenario-Based Model<br />
Model Domain Consists Only of a “Capture Region”<br />
Required Site Parameters<br />
Q w<br />
R c<br />
• <strong>LNAPL</strong> thickness, b n<br />
• Ground surface elevation, z gs<br />
• Water table elevation, z wt<br />
• Elevation of soil facies interface,<br />
z 12<br />
, z 23<br />
Radial Flow to a<br />
Recovery Well<br />
<strong>LNAPL</strong> in the subsurface
Required Soil <strong>and</strong> Fluid Parameters<br />
Soil Parameters<br />
• Porosity, n<br />
• Hydraulic conductivity, K ws<br />
• Van Genuchten, α<br />
• Van Genuchten, N<br />
• Irreducible Water Saturation, S wr<br />
Fluid Parameters<br />
• <strong>LNAPL</strong> density (ratio), ρ r<br />
• <strong>LNAPL</strong> viscosity (ratio), µ r<br />
• Air/water surface tension, σ aw<br />
• Air/<strong>LNAPL</strong> surface tension, σ an<br />
• <strong>LNAPL</strong>/water interfacial tension, σ nw<br />
<strong>LNAPL</strong> in the subsurface
Soil Heterogeneity<br />
Up to three soil layers with abrupt vertical facies transition<br />
K w1<br />
, n 1<br />
, α 1<br />
, N 1<br />
, S wr1<br />
z 12<br />
K w2<br />
, n 2<br />
, α 2<br />
, N 2<br />
, S wr2<br />
z 23<br />
K w3<br />
, n 3<br />
, α 3<br />
, N 3<br />
, S wr3<br />
<strong>LNAPL</strong> in the subsurface
Well Parameters<br />
• Recovery time, T R<br />
• Radius of pumping well, R W<br />
• Radius of capture, R C<br />
• Radius of Influence, R I<br />
• Groundwater production rate, Q w<br />
• Water saturated thickness at well, b w<br />
• Suction pressure (vacuum-enhanced system), P v<br />
• Screen length (vadose zone), b a<br />
• Air radius of capture, R A<br />
• If Q w<br />
= 0 <strong>and</strong> P v<br />
= 0 then Skimmer Well is assumed<br />
<strong>LNAPL</strong> in the subsurface
Application to a Closed Refinery Site Located Near<br />
the Missouri River<br />
<strong>LNAPL</strong> in the subsurface
Application of LLRM<br />
Recovery well at a industrial site in the Midwestern U.S.<br />
<strong>LNAPL</strong> in the subsurface
Cross-Section Layout<br />
<strong>LNAPL</strong> in the subsurface
Cross-Section A-A’<br />
<strong>LNAPL</strong> in the subsurface
Site-Specific Data<br />
• Recovered fluid measurements<br />
• <strong>LNAPL</strong> density <strong>and</strong> viscosity<br />
• Surface <strong>and</strong> interfacial tension values<br />
• Soil core measurements<br />
• Grain size distribution<br />
• Capillary pressure curves<br />
• Hydraulic conductivity<br />
• <strong>LNAPL</strong> saturation (Dean Stark method)<br />
• Site-specific<br />
• <strong>LNAPL</strong> <strong>recovery</strong> rates<br />
• Groundwater <strong>recovery</strong> rates<br />
<strong>LNAPL</strong> in the subsurface
<strong>LNAPL</strong> Thickness <strong>and</strong> Water Table<br />
Elevation<br />
<strong>LNAPL</strong> Thickness (ft)<br />
20<br />
18<br />
16<br />
14<br />
12<br />
10<br />
8<br />
6<br />
4<br />
2<br />
<strong>LNAPL</strong> Thickness (Gray) <strong>and</strong><br />
Water Table Elevation (Blue)<br />
with Datum at 704.5 ft<br />
0<br />
Aug-96 Aug-98 Aug-00 Aug-02 Aug-04<br />
Date<br />
<strong>LNAPL</strong> in the subsurface
Monitoring Well Data<br />
These data suggest that for this site with <strong>LNAPL</strong> trapped<br />
beneath FGZ, monitoring well <strong>LNAPL</strong> thickness will<br />
probably be a poor indicator of the amount of <strong>LNAPL</strong><br />
present within the subsurface<br />
• Application of LDRM with no model calibration<br />
<strong>LNAPL</strong> in the subsurface
Fitting Capillary Pressure Curves – General Case<br />
12.0<br />
4 - 714'<br />
4 - 709'<br />
Capillary Pressure Head (m)<br />
10.0<br />
8.0<br />
6.0<br />
4.0<br />
2.0<br />
Burdine<br />
a = 0.80 m-1<br />
N = 3.50<br />
Swr = 0.30<br />
Mualem<br />
a = 0.20 m-1<br />
N = 5.0<br />
Swr = 0.55<br />
4 - 707'<br />
5 - 708'<br />
5 - 707'<br />
5 - 705'<br />
6 - 709'<br />
6 - 707'<br />
6 - 704'<br />
vG-B<br />
vG-M<br />
0.0<br />
0.0 0.2 0.4 0.6 0.8 1.0 1.2<br />
Saturation<br />
<strong>LNAPL</strong> in the subsurface
Early 1-Layer Model Representation<br />
<strong>LNAPL</strong> in the subsurface
Groundwater Pumping <strong>and</strong> Lowered Water Table<br />
(Smearing)<br />
<strong>LNAPL</strong> in the subsurface
Initial Recovery Estimate for all Wells<br />
350,000<br />
Total <strong>LNAPL</strong> Recovery Volume [gallons]<br />
300,000<br />
250,000<br />
200,000<br />
150,000<br />
100,000<br />
50,000<br />
Total Modeled NAPL Recovery (All Six Wells - Dual<br />
Pumping)<br />
Total Actual NAPL Recovery (All Six Wells - 2 yrs)<br />
0<br />
0 1 2 3 4 5 6<br />
Time [yr]<br />
<strong>LNAPL</strong> in the subsurface
<strong>LNAPL</strong> <strong>recovery</strong> –<br />
model predicted <strong>and</strong> actual (2 years)<br />
350,000<br />
Total <strong>LNAPL</strong> Recovery Volume [gallons]<br />
300,000<br />
250,000<br />
200,000<br />
150,000<br />
100,000<br />
50,000<br />
Total Modeled NAPL Recovery (All Six Wells - Dual<br />
Pumping)<br />
Total Actual NAPL Recovery (All Six Wells - 2 yrs)<br />
0<br />
0 1 2 3 4 5 6<br />
Time [yr]<br />
<strong>LNAPL</strong> in the subsurface
<strong>LNAPL</strong> <strong>recovery</strong> –<br />
model predicted <strong>and</strong> actual (2.75 years)<br />
300,000<br />
Modeled vs. Actual <strong>LNAPL</strong> Recovery for the Lower Refinery Recovery Well System:<br />
June 1, 2003 through May 1, 2006 (35 Months)<br />
Total <strong>LNAPL</strong> Recovery Volume [gallons]<br />
250,000<br />
200,000<br />
150,000<br />
100,000<br />
50,000<br />
Total Dual PumpModeled NAPL Recovery (All Six Wells)<br />
Actual Recovery Summary<br />
0<br />
0.0 0.5 1.0 1.5 2.0 2.5 3.0 3.5 4.0<br />
Time [yr]<br />
<strong>LNAPL</strong> in the subsurface
<strong>LNAPL</strong> <strong>recovery</strong> –<br />
model predicted <strong>and</strong> actual (3.25 years)<br />
300,000<br />
Modeled vs. Actual <strong>LNAPL</strong> Recovery for the Lower Refinery Recovery Well System:<br />
June 1, 2003 through Sep. 14, 2006 (39.5 Months)<br />
Total <strong>LNAPL</strong> Recovery Volume [gallons]<br />
250,000<br />
200,000<br />
150,000<br />
100,000<br />
50,000<br />
Total Dual PumpModeled NAPL Recovery (All Six Wells)<br />
Actual Recovery Summary<br />
0<br />
0.0 0.5 1.0 1.5 2.0 2.5 3.0 3.5 4.0<br />
Time [yr]<br />
<strong>LNAPL</strong> in the subsurface
<strong>LNAPL</strong> <strong>recovery</strong> –<br />
model predicted <strong>and</strong> actual (5.25 years)<br />
350,000<br />
Modeled vs. Actual <strong>LNAPL</strong> Recovery for the Lower Refinery Recovery Well System:<br />
June 1, 2003 through Aug. 21, 2008 (62.1 Months)<br />
Total <strong>LNAPL</strong> Recovery Volume [gallons]<br />
300,000<br />
250,000<br />
200,000<br />
150,000<br />
100,000<br />
50,000<br />
Total Modeled NAPL Recovery (All Six Wells - Dual<br />
Pumping)<br />
Total Actual NAPL Recovery (All Six Wells - 2 yrs)<br />
0<br />
0 1 2 3 4 5 6<br />
Time [yr]<br />
<strong>LNAPL</strong> in the subsurface
Why was the model off? (not that it was very far off)<br />
• Was it that - the model or algorithms are pretty good but<br />
not that accurate?<br />
• Was it that – the soil is too variable away from well?<br />
• Was it that – the <strong>LNAPL</strong> Impacts vary away from well?<br />
Nope<br />
<strong>LNAPL</strong> in the subsurface
Water level in Missouri River makes constant<br />
pumping assumption difficult<br />
Groundwater Pumping Rate<br />
System Wide<br />
50<br />
45<br />
One layer model<br />
timeframe<br />
Actual Pumping Rate<br />
Average Pumping Rate<br />
Modelled Pumping Rate<br />
31.9 gpm<br />
40<br />
Groundwater Pumping Rate (GPM)<br />
35<br />
30<br />
25<br />
20<br />
15<br />
26.0 gpm<br />
23.7 gpm<br />
14.5 gpm<br />
30.5 gpm<br />
15.1 gpm<br />
21.7 gpm<br />
10<br />
5<br />
0<br />
Jun-03 Dec-03 Jun-04 Dec-04 Jun-05 Dec-05 Jun-06 Dec-06 Jun-07 Dec-07 Jun-08<br />
<strong>LNAPL</strong> in the subsurface
Vertical Distribution Comparison – 1 Layer versus 3 Layer<br />
740<br />
735<br />
730<br />
<strong>LNAPL</strong> Saturation & Relative Permeability<br />
0.0 0.1 0.2 0.3 0.4<br />
<strong>LNAPL</strong> thickness 7 ft<br />
<strong>LNAPL</strong> Thickness (ft)<br />
20<br />
18<br />
16<br />
14<br />
12<br />
10<br />
8<br />
6<br />
4<br />
2<br />
0<br />
<strong>LNAPL</strong> Thickness (Gray) <strong>and</strong><br />
Water Table Elevation (Blue)<br />
with Datum at 704.5 ft<br />
Aug-96 Aug-98 Aug-00 Aug-02 Aug-04<br />
<strong>LNAPL</strong> Saturation &<br />
Relative Permeability<br />
0.0 0.2 0.4<br />
Date<br />
Elevation [ft]<br />
725<br />
720<br />
715<br />
710<br />
• <strong>LNAPL</strong> thickness 7 ft<br />
• <strong>LNAPL</strong> thickness 18 ft<br />
• 3 layer accounts SCM<br />
better<br />
• Layering<br />
• <strong>LNAPL</strong> thickness<br />
• etc<br />
705<br />
700<br />
<strong>LNAPL</strong> in the subsurface
Models are non-unique solutions<br />
The better model will correlate to more observations<br />
• January / February 2007 <strong>LNAPL</strong> <strong>recovery</strong> model at the site<br />
was revisited <strong>and</strong> updated using the latest underst<strong>and</strong>ing <strong>and</strong><br />
newest three layer version of the API LDRM.<br />
• Site conditions were unconfined <strong>and</strong> confined aquifer / <strong>LNAPL</strong><br />
conditions versus the 1-Layer model assumed unconfined<br />
conditions<br />
• 1 Layer only modeled the s<strong>and</strong> layer that contained majority of <strong>LNAPL</strong>.<br />
• 1 Layer model could not account for large <strong>LNAPL</strong> thickness observed with<br />
high water table conditions.<br />
Most Significant Difference<br />
for Vertical <strong>LNAPL</strong> Distribution<br />
• Small contributions/impacts of <strong>LNAPL</strong> <strong>recovery</strong> from the upper fine grained<br />
soil layer were not accounted for (but not a big deal)<br />
• 1 Layer model did not illustrate why higher water-table resulted in higher<br />
<strong>recovery</strong> rates or larger gauged thicknesses<br />
• At this site as water-table rose <strong>LNAPL</strong> thickness observed increased<br />
• 3 Layer model sets realistic expectation regarding large gauged<br />
thicknesses versus impacts by accurately accounting for the vertical<br />
variability of soil characteristics<br />
• During the 3-layer model prep - accounting for variable historic<br />
water pumping rates was also identified as necessary for improved<br />
accuracy<br />
<strong>LNAPL</strong> in the subsurface<br />
Most Significant Difference<br />
for Recovery Performance
Updated site model with new 3 layer model<br />
(initial 3 layer model from 2/07)<br />
400,000<br />
Cumulative <strong>LNAPL</strong> Recovery at Six Lower Refinery Recovery Wells<br />
Actual <strong>LNAPL</strong> Recovery vs. One-Layer <strong>and</strong> Three-Layer Model Results: 6/19/2003 to 6/22/2008<br />
350,000<br />
Cumulative <strong>LNAPL</strong> Recovery Volume (Gallons)<br />
300,000<br />
250,000<br />
200,000<br />
150,000<br />
100,000<br />
50,000<br />
0<br />
One-Layer (2005)<br />
Three-Layer Model (2007)<br />
Actual<br />
0 1 2 3 4 5 6<br />
Time (Years)<br />
updated through 5/1/2008<br />
<strong>LNAPL</strong> in the subsurface
AK2<br />
Updated site model with new 3 layer model<br />
(1.75 yrs of additional <strong>recovery</strong>)<br />
400,000<br />
Cumulative <strong>LNAPL</strong> Recovery at Six Lower Refinery Recovery Wells<br />
Actual <strong>LNAPL</strong> Recovery vs. One-Layer <strong>and</strong> Three-Layer Model Results: 6/19/2003 to 8/21/2008<br />
350,000<br />
Cumulative <strong>LNAPL</strong> Recovery Volume (Gallons)<br />
300,000<br />
250,000<br />
200,000<br />
150,000<br />
100,000<br />
50,000<br />
2 Recent Increases in Q w from<br />
15.1 to 21 <strong>and</strong> 32 GPM<br />
One-Layer (2005)<br />
Three-Layer Model (2007)<br />
Actual<br />
0<br />
0 1 2 3 4 5 6<br />
Time (Years)<br />
<strong>LNAPL</strong> in the subsurface<br />
updated through 5/1/2008
Slide 29<br />
AK2<br />
Mark, for this slide if you double click on the graph, the actual data spread sheet <strong>and</strong> the 1-layer model spread sheet are in here so<br />
you can update this graph as you like. You can make whaterver version you like, exit out of the excel sheet, make a copy, paste<br />
special as a metafile <strong>and</strong> then make a new slide with the picture but the data is then only in one slide to limit file size<br />
akirkman, 8/28/2008
US Army Corp of Engineers makes constant<br />
pumping assumption difficult<br />
Groundwater Pumping Rate<br />
System Wide<br />
50<br />
45<br />
One layer model<br />
timeframe<br />
Actual Pumping Rate<br />
Average Pumping Rate<br />
Modelled Pumping Rate<br />
31.9 gpm<br />
40<br />
Groundwater Pumping Rate (GPM)<br />
35<br />
30<br />
25<br />
20<br />
15<br />
26.0 gpm<br />
23.7 gpm<br />
14.5 gpm<br />
Three layer<br />
model timeframe<br />
15.1 gpm<br />
21.7 gpm<br />
10<br />
5<br />
0<br />
Jun-03 Dec-03 Jun-04 Dec-04 Jun-05 Dec-05 Jun-06 Dec-06 Jun-07 Dec-07 Jun-08<br />
<strong>LNAPL</strong> in the subsurface
Recovery Endpoint – When to Stop <strong>LNAPL</strong> Liquid<br />
Recovery<br />
Performance-based <strong>endpoint</strong>: percent of <strong>LNAPL</strong> in <strong>recovery</strong><br />
liquid Q n<br />
/(Q n<br />
+ Q w<br />
)<br />
1.4<br />
Percent <strong>LNAPL</strong> in Recovery Liquid<br />
1.2<br />
1<br />
0.8<br />
0.6<br />
0.4<br />
0.2<br />
0<br />
Water Production = 9.7 gpm<br />
0 2 4 6 8 10 12<br />
Time (years)<br />
<strong>LNAPL</strong> in the subsurface
Same Data – Easier to pick <strong>endpoint</strong><br />
Percent <strong>LNAPL</strong> in Recovery Liquid<br />
10<br />
1<br />
0.1<br />
0.01<br />
Time (years)<br />
0 2 4 6 8 10 12<br />
0.001<br />
<strong>LNAPL</strong> in the subsurface
Cumulative well <strong>recovery</strong>: All wells since 1988<br />
(approaching a natural <strong>endpoint</strong> for this system?)<br />
Total Cumulative <strong>LNAPL</strong> <strong>and</strong> Model-Predicted <strong>LNAPL</strong> Recovery - Six Remaining Wells<br />
Cumulative <strong>LNAPL</strong> Recovery (gallons)<br />
4,000,000<br />
3,500,000<br />
3,000,000<br />
2,500,000<br />
2,000,000<br />
1,500,000<br />
1,000,000<br />
500,000<br />
Total Six Well Recoverable <strong>LNAPL</strong><br />
(3.06MM gallons)<br />
Currently 93% <strong>recovery</strong><br />
(2.69MM gallons)<br />
95% of Recoverable <strong>LNAPL</strong><br />
Recovered by 2013<br />
(2.69MM gallons)<br />
Cumulative <strong>LNAPL</strong> Recovery<br />
3-layer Model-Pedicted <strong>LNAPL</strong> Recovery<br />
Cumulative Groundwater Recovery<br />
Model-Predicted GW <strong>recovery</strong><br />
300,000,000<br />
250,000,000<br />
200,000,000<br />
150,000,000<br />
100,000,000<br />
50,000,000<br />
0<br />
1988<br />
1988<br />
1989<br />
1990<br />
1991<br />
1992<br />
1993<br />
1994<br />
1995<br />
1996<br />
1997<br />
1998<br />
1999<br />
2000<br />
2001<br />
2002<br />
2003<br />
2004<br />
2005<br />
2006<br />
2007<br />
2008<br />
2009<br />
2010<br />
Cumulative Groundwater Recovery (gallons)<br />
2011<br />
2012<br />
2013<br />
0<br />
<strong>LNAPL</strong> in the subsurface
Key Points<br />
• API LDRM is a free <strong>and</strong> fairly simple tool<br />
• With good site data <strong>and</strong> an accurate conceptual site model we<br />
can estimate <strong>LNAPL</strong> distribution in the subsurface<br />
• With good site data <strong>and</strong> an accurate conceptual site model<br />
AND GOOD JUDGEMENT we can make good predictions for<br />
<strong>LNAPL</strong> <strong>recovery</strong><br />
• Combine all the above <strong>and</strong> with good underst<strong>and</strong>ing of <strong>LNAPL</strong><br />
behavior, we can have more productive discussions about<br />
expectations for <strong>LNAPL</strong> <strong>recovery</strong> <strong>and</strong> ultimately <strong>LNAPL</strong><br />
<strong>endpoint</strong>s<br />
• Progress of <strong>LNAPL</strong> <strong>recovery</strong> Estimates:<br />
with the old pancake model – within two orders of magnitude<br />
using the LDRM <strong>and</strong> site data – within one order of magnitude<br />
careful use of the LDRM by an experienced user applying GOOD<br />
JUDGEMENT – within a factor of 2 to 3.<br />
<strong>LNAPL</strong> in the subsurface