1qYqv4m
1qYqv4m
1qYqv4m

Create successful ePaper yourself
Turn your PDF publications into a flip-book with our unique Google optimized e-Paper software.
Group summarised<br />
consolidated interim<br />
financial results<br />
announcement<br />
for the six months ended 30 June 2014<br />
HIGHLIGHTS<br />
Revenue increased by 15,5% to R888,2 million<br />
Headline earnings per share increased by 114,7% to 7,3 cents<br />
Earnings per share increased by 108,6% to 7,3 cents<br />
Tangible net asset value per share increased by 6,2% to 348,4 cents
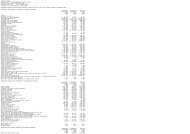
SUMMARY CONSOLIDATED STATEMENT OF FINANCIAL POSITION<br />
As at As at As at<br />
30 June 2014 30 June 2013 31 December 2013<br />
(Unaudited) (Unaudited) (Audited)<br />
Notes R’000 R’000 R’000<br />
Assets<br />
Non-current assets 313 447 485 143 294 497<br />
Property, plant and equipment 4 302 658 327 639 284 015<br />
Intangible assets 4 10 789 157 504 10 482<br />
Current assets 738 135 709 273 653 160<br />
Inventories 318 531 316 714 289 247<br />
Trade and other receivables 388 911 358 939 331 927<br />
Derivative financial instruments – – 143<br />
Taxation receivable 5 282 7 829 3 166<br />
Cash and cash equivalents 25 411 25 791 28 677<br />
Total assets 1 051 582 1 194 416 947 657<br />
Equity and liabilities<br />
Equity<br />
Share capital and share premium 5 441 645 441 645 441 645<br />
Reserves 611 236 633<br />
Retained earnings 113 314 228 860 101 968<br />
Total equity 555 570 670 741 544 246<br />
Liabilities<br />
Non-current liabilities 85 661 75 533 77 436<br />
Interest-bearing borrowings 6 50 287 39 177 42 033<br />
Deferred taxation 33 501 34 116 33 629<br />
Share-based payments 1 873 2 240 1 774<br />
Current liabilities 410 351 448 142 325 975<br />
Trade and other payables 203 473 232 995 133 762<br />
Interest-bearing borrowings 6 21 149 27 141 26 130<br />
Taxation payable 2 716 273 –<br />
Share-based payments 150 8 –<br />
Bank overdraft 182 863 187 725 166 083<br />
Total liabilities 496 012 523 675 403 411<br />
Total equity and liabilities 1 051 582 1 194 416 947 657<br />
SUMMARY CONSOLIDATED STATEMENT OF COMPREHENSIVE INCOME<br />
Six months ended<br />
Year ended<br />
30 June 2014 30 June 2013 31 December 2013<br />
(Unaudited) (Unaudited) Change (Audited)<br />
Note R’000 R’000 % R’000<br />
Revenue 888 203 769 152 15,5 1 690 921<br />
Cost of sales (776 610) (674 422) (1 475 875)<br />
Gross profit 111 593 94 730 17,8 215 046<br />
Other operating income 2 277 357 6 446<br />
Administration expenses (32 716) (31 748) (66 638)<br />
Distribution expenses (15 162) (14 429) (26 567)<br />
Operating expenses (40 061) (32 988) (221 026)<br />
Operating profit/(loss) 25 931 15 922 62,9 (92 739)<br />
Finance income 421 221 533<br />
Finance costs (10 207) (8 179) (18 885)<br />
Profit/(loss) before taxation 16 145 7 964 102,8 (111 091)<br />
Taxation 7 (4 799) (2 520) (10 357)<br />
Profit/(loss) for the period 11 346 5 444 108,4 (121 448)<br />
Other comprehensive income<br />
Exchange differences on translating<br />
foreign operation (22) 427 824<br />
Total comprehensive income/(loss)<br />
attributable to equity holders<br />
of the company 11 324 5 871 92,9 (120 624)<br />
Cents Cents Cents<br />
per share per share per share<br />
Earnings/(loss) per share – basic and diluted 7,3 3,5 108,6 (77,7)
SUMMARY CONSOLIDATED STATEMENT OF CHANGES IN EQUITY<br />
Six months ended<br />
Year ended<br />
30 June 2014 30 June 2013 31 December 2013<br />
(Unaudited) (Unaudited) (Audited)<br />
Note R’000 R’000 R’000<br />
Share capital<br />
Opening and closing balance 5 1 274 1 274 1 274<br />
Share premium<br />
Opening and closing balance 5 440 371 440 371 440 371<br />
Foreign currency translation reserve<br />
Opening balance 633 (191) (191)<br />
Exchange differences on translation of foreign operations (22) 427 824<br />
Closing balance 611 236 633<br />
Retained earnings<br />
Opening balance 101 968 223 416 223 416<br />
Comprehensive income for the period 11 346 5 444 (121 448)<br />
Closing balance 113 314 228 860 101 968<br />
SUMMARY CONSOLIDATED STATEMENT OF CASH FLOWS<br />
Six months ended<br />
Year ended<br />
30 June 2014 30 June 2013 31 December 2013<br />
(Unaudited) (Unaudited) (Audited)<br />
R’000 R’000 R’000<br />
Cash generated/(utilised) in operating activities 6 542 (15 283) 16 025<br />
Cash utilised in investing activities (29 839) (16 290) (25 312)<br />
Cash generated/(utilised) in financing activities 3 273 (8 575) (6 730)<br />
Net decrease in cash and cash equivalents (20 024) (40 148) (16 017)<br />
Cash and cash equivalents at the beginning of period (137 406) (122 213) (122 213)<br />
Effects of exchange rate movement on cash balances (22) 427 824<br />
Cash and cash equivalents at the end of period (157 452) (161 934) (137 406)<br />
SELECTED NOTES TO THE SUMMARISED CONSOLIDATED INTERIM FINANCIAL INFORMATION<br />
1. General information<br />
South Ocean Holdings and its subsidiary companies manufacture and distribute electrical cables, import and distribute light fittings, lamps, electrical<br />
accessories, audio visual hardware and accessories and property investments. South Ocean Holdings is a public company listed on the Johannesburg<br />
Stock Exchange (JSE) and is incorporated and domiciled in the Republic of South Africa.<br />
The unaudited summarised consolidated interim financial information was prepared by JP Bekker CA (SA) and was approved for issue by the directors<br />
on 6 August 2014.<br />
2. Basis of preparation<br />
The summary consolidated financial statements are prepared in accordance with the requirements of the JSE Listings Requirements for provisional<br />
reports, and the requirements of the Companies Act applicable to summary financial statements. This should be read with the audited annual financial<br />
statements for the year ended 31 December 2013. The Listings Requirements require provisional reports to be prepared in accordance with the<br />
framework concepts and the measurement and recognition requirements of International Financial Reporting Standards (“IFRS”) and SAICA Financial<br />
Reporting Guides as issued by the Accounting Practices Committee and Financial Pronouncements as issued, by the Financial Reporting Standards<br />
Council and to also, as a minimum, contained the information required by IAS 34 “Interim Financial Reporting”. The accounting policies applied in the<br />
preparation of the consolidated interim financial statements from which the summary financial statements were derived are in terms of IFRS and are<br />
consistent with those accounting policies applied in the preparation of the previous consolidated annual financial statements.<br />
3. Accounting policies<br />
The accounting policies adopted are consistent with those applied in the audited annual financial statements for the year ended 31 December 2013,<br />
except where indicated. There were no new standards or amendments that were issued since the last annual report that are applicable to the Group<br />
or that are expected to have a material impact on the reported results or future results of the Group.
4. Property, plant and equipment and intangible assets<br />
During the six months, the Group invested R29,8 million (2013: R16,7 million) in capital expenditure mainly relating to the manufacturing plant at<br />
South Ocean Electric Wire Company Proprietary Limited (“SOEW”). The expenditure consists of machinery and a property bought to expand the<br />
operation, amounting to R18,5 million. The details of changes in tangible and intangible assets are as follows:<br />
Tangible assets Intangible assets<br />
(Unaudited)<br />
(Unaudited)<br />
R’000 R’000<br />
Six months ended 30 June 2014<br />
Opening net carrying amount 284 015 10 482<br />
Additions 28 652 1 186<br />
Disposals and write-offs (1) –<br />
Depreciation/amortisation and other movements (10 008) (879)<br />
Closing net carrying amount 302 658 10 789<br />
Six months ended 30 June 2013<br />
Opening net carrying amount 321 122 157 938<br />
Additions 15 897 822<br />
Disposals and write-offs (295) –<br />
Foreign exchange movements (6) –<br />
Depreciation/amortisation and other movements (9 079) (1 256)<br />
Closing net carrying amount 327 639 157 504<br />
Year ended 31 December 2013 (Audited) (Audited)<br />
Opening net carrying amount 321 122 157 938<br />
Additions 23 333 2 746<br />
Disposals and write-offs (41 734) –<br />
Foreign exchange movements 11 –<br />
Impairment of goodwill – (148 108)<br />
Depreciation/amortisation and other movements (18 717) (2 094)<br />
Closing net carrying amount 284 015 10 482<br />
5. Share capital and share premium<br />
Number of Ordinary shares Share premium Total<br />
shares issued R’000 R’000 R’000<br />
At 30 June 2014 (Unaudited)<br />
Opening and closing balance 156 378 794 1 274 440 371 441 645<br />
At 30 June 2013 (Unaudited)<br />
Opening and closing balance 156 378 794 1 274 440 371 441 645<br />
At 31 December 2013 (Audited)<br />
Opening and closing balance 156 378 794 1 274 440 371 441 645<br />
6. Interest-bearing borrowings<br />
As at<br />
As at<br />
30 June 2014 30 June 2013 31 December 2013<br />
(Unaudited) (Unaudited) (Audited)<br />
Secured loans R’000 R’000 R’000<br />
Non-current 50 287 39 177 42 033<br />
Current 21 149 27 141 26 130<br />
71 436 66 318 68 163<br />
The movement in borrowings is analysed as follows:<br />
Opening balance 68 162 74 893 74 893<br />
Additional loans raised 17 478 7 775 22 049<br />
Finance costs 2 935 2 522 5 169<br />
Repayments (17 139) (18 872) (33 948)<br />
Closing balance 71 436 66 318 68 163<br />
7. Taxation<br />
Income tax expense is recognised based on management’s best estimate of the weighted average annual income tax rate expected for the full<br />
financial year. The estimated average annual tax rate calculated is 29,7% (2013: 31,6%).<br />
8. Reconciliation of headline earnings<br />
Six months ended<br />
Year ended<br />
30 June 2014 30 June 2013 31 December 2013<br />
(Unaudited) (Unaudited) (Audited)<br />
R’000 R’000 R’000<br />
Comprehensive income attributable to the equity holders<br />
of the Company for the period 11 346 5 444 (121 448)<br />
Profit/(loss) on disposal of property, plant and equipment 1 (126) 6 117<br />
Goodwill Impairment – – 148 108<br />
Headline earnings for the period 11 347 5 318 32 777<br />
Headline earnings per share (cents) 7,3 3,4 21,0
9. Weighted average number of shares<br />
Six months ended<br />
Year ended<br />
30 June 2014 30 June 2013 31 December 2013<br />
(Unaudited) (Unaudited) (Audited)<br />
R’000 R’000 R’000<br />
Number of shares in issue 156 378 794 156 378 794 156 378 794<br />
Weighted average number of shares in issue at the beginning<br />
and end of the period 156 378 794 156 378 794 156 378 794<br />
Weighted average number of shares in issue for diluted<br />
earnings per share 156 378 794 156 378 794 156 378 794<br />
10. Net asset value<br />
As at<br />
As at<br />
30 June 2014 30 June 2013 31 December 2013<br />
(Unaudited) (Unaudited) (Audited)<br />
R’000 R’000 R’000<br />
Net asset value per share (cents) 355,3 428,9 348,0<br />
Tangible net asset value per share (cents) 348,4 328,2 341.3<br />
11. Dividend declaration<br />
The Company’s policy is to consider the declaration of a final dividend after its financial year-end.<br />
12. Segment reporting<br />
The segment information has been prepared in accordance with IFRS – Operating segments, which defines the requirements for disclosure of<br />
financial information of an entity’s segments.<br />
The Standard requires segmentation on the Group’s internal organisation and reporting of revenue and EBITDA based upon internal accounting<br />
presentation.<br />
The segment revenue and EBITDA generated by each of the Group’s reportable segments are summarised as follows:<br />
Six months ended Adjusted Segment Segment<br />
Revenue EBITDA assets liabilities<br />
R’000 R’000 R’000 R’000<br />
30 June 2014 (Unaudited)<br />
Electrical cables manufacturing 744 756 42 432 578 097 318 586<br />
Lighting and electrical accessories 146 087 (2 247) 278 187 100 068<br />
Property investments 7 828 5 738 182 413 39 594<br />
898 671 45 923 1 038 697 458 248<br />
30 June 2013 (Unaudited)<br />
Electrical cables manufacturing 602 293 16 892 566 874 343 196<br />
Lighting and electrical accessories 174 884 11 364 411 594 94 738<br />
Property investments 8 735 7 254 206 746 44 223<br />
785 912 35 510 1 185 214 482 157<br />
Year ended<br />
31 December 2013 (Audited)<br />
Electrical cables manufacturing 1 336 285 59 533 489 307 249 134<br />
Lighting and electrical accessories 373 108 28 430 251 022 79 669<br />
Property investments 15 995 5 446 202 448 35 072<br />
1 725 388 93 409 942 777 363 875
12. Segment reporting continued<br />
Six months ended<br />
Year ended<br />
Reconciliation of total segment report to the statement of 30 June 2014 30 June 2013 31 December 2013<br />
financial position and statement of comprehensive income (Unaudited) (Unaudited) (Audited)<br />
is provided as follows: R’000 R’000 R’000<br />
Revenue<br />
Reportable segment revenue 898 671 785 912 1 725 388<br />
Inter-segment revenue (property rentals) (7 828) (8 735) (15 995)<br />
Inter-segment revenue – other (2 640) (8 025) (18 472)<br />
Revenue per consolidated statement of<br />
comprehensive income 888 203 769 152 1 690 921<br />
Profit before tax<br />
Adjusted EBITDA 45 923 35 510 93 409<br />
Corporate and other overheads (9 105) (9 253) (17 229)<br />
Depreciation (10 008) (9 079) (18 717)<br />
Impairment of intangible assets – lighting and electrical<br />
accessories segment – – (148 108)<br />
Amortisation of intangible assets (879) (1 256) (2 094)<br />
Operating profit/(loss) 25 931 15 922 (92 739)<br />
Finance income 421 221 533<br />
Finance cost (10 207) (8 179) (18 885)<br />
Profit/(loss) before income tax per statement<br />
of comprehensive income 16 145 7 964 (111 091)<br />
Assets<br />
Reportable segment assets 1 038 697 1 185 214 942 777<br />
Corporate and other assets 7 603 1 373 1 714<br />
Taxation receivable 5 282 7 829 3 166<br />
Total assets per statement of financial position 1 051 582 1 194 416 947 657<br />
Liabilities<br />
Reportable segment liabilities 458 248 482 157 363 875<br />
Corporate and other liabilities 1 547 7 129 5 907<br />
Deferred taxation 33 501 34 116 33 629<br />
Taxation payable 2 716 273 –<br />
Total liabilities per statement of financial position 496 012 523 675 403 411<br />
13. Director changes<br />
Mr Ethan Dube resigned on the 31 March 2014. Mr Henry Pon was appointed Chairman of the Board from 1 April 2014. Ms Melanie Chong<br />
was appointed Chairperson of the Audit and Risk Management Committee from 1 April 2014. Ms Natasha Lalla and Ms Louisa Stephens were<br />
appointed independent non-executive directors on 23 June 2014.<br />
14. Subsequent events<br />
The four week strike action at SOEW will affect the results materialy during the second six months of the financial year.<br />
The Competition Commission announced on 19 March 2014 that it referred a complaint against SOEW and three other competitors to the<br />
Competition Tribunal for possible price fixing and market allocation in contravention of the Competition Act. The Commission asked the Tribunal<br />
to impose an administrative penalty of 10% of annual turnover on each of the entities involved, except for Aberdare Cables, which has been<br />
granted conditional leniency. The referral arises from a complaint that the Commission initiated on 16 March 2010 against SOEW. Aberdare<br />
Cables, Alvern Cables and Tulisa Cables, which was referred to in the SENS announcement, dated 6 May 2010.<br />
Notwithstanding the above, the directors are not aware of any other significant events arising since the end of the financial period, which would<br />
materially affect the operations of the Group or its operating segments, not dealt with in the financial results.<br />
COMMENTARY<br />
Introduction<br />
South Ocean Holdings is pleased to announce its condensed consolidated results for the six months ended 30 June 2014.<br />
South Ocean Holdings is an investment holding company, comprising four operating subsidiaries namely: South Ocean Electric<br />
Wire Company Proprietary Limited (“SOEW”), a manufacturer of low voltage electrical cables, Radiant Group Proprietary<br />
Limited (“Radiant Group”), an importer and distributor of light fittings, lamps, electrical accessories, audio visual hardware<br />
and accessories, a property holding company, Anchor Park Investments 48 Proprietary Limited (“Anchor Park”), and Icembu<br />
Services Proprietary Limited (“Icembu”), an assembly line of light fittings, lights and electrical accessories.<br />
Financial overview<br />
Earnings<br />
Group revenue for the six-month period to 30 June 2014 increased by 15,5% (2013: 17,8%) to R888,2 million (2013:<br />
R769,2 million). The Group’s gross profit increased by 17,8% (2013: 14,6% decreased) to R111,6 million (2013: R94,7 million)<br />
and operating profit increased by 62,9% (2013: 50,5% decreased) to R25,9 million (2013: R15,9 million decrease) compared<br />
to the prior period.<br />
Group net profit before tax increased by 102,8% (2013: 69,4% decreased) to R16,1 million (2013: R8,0 million) compared to the<br />
prior period. The basic earnings per share increased by 108,6% (2013: 70,1% decreased) to 7,3 cents (2013: 3,5 cents) with<br />
the headline earnings per share increasing by 114,7% (2013: 70,9% decreased) to 7,3 cents (2013: 3,4 cents) compared to the<br />
prior period. Headline earnings for the period was R11,3 million (2013: R5,3 million).
The results for the period increased overall when compared to the corresponding period in the previous financial year, which was<br />
mainly due to increase in production at SOEW, due to no electrical interruptions experienced as was the case in the previous<br />
period and the decrease in results from Radiant Group which was as a results of logistical constraints caused by the upgrade of<br />
the ERPS ystem and the implementation of the warehouse stock control system.<br />
Cash flow and working capital management<br />
Cash generated in operating activities amounted to R6,5 million (2013: R15,3 million, utilised) during the period. Working capital<br />
increased by R61,3 million (2013: R28,2 million) primarily due to an increase in accounts receivable, as a result of an increase in<br />
revenue, and a decrease in accounts payable.<br />
The Group invested R29,8 million (2013: R16,7 million) in capital expenditure, which was mainly financed by long-term borrowings,<br />
during this period and utilised R17,1 million (2013: R18,9 million) to repay its long-term interest-bearing borrowings.<br />
The Group’s net cash utilised during the period amounted to R20,0 million (2013: R40,1 million). The net overdraft decreased from<br />
R161,9 million reported at June 2013 to R157,5 million at the end of the current period.<br />
Segment results<br />
Electrical cables – SOEW<br />
SOEW’s revenue increased by 23,6% (2013: 21,8% increased) to R744,7 million (2013: R602,3 million). This was mainly<br />
attributable to an increase of 7,5% in the moving average Rand Copper Price (RCP), diversification of product range and an<br />
increase in production, (the previous period’s production was affected by the electrical supply problem).<br />
The market conditions were still subdued during the period and margins were under pressure due to the competitive market.<br />
Operational expenses increased during the year as a result of an increase in production volumes.<br />
Capital investment was made to improve efficiencies and to increase capacity at the Group’s Alrode facility during the period.<br />
Additional working capital funding was required to finance the increase in trade receivables relating to the increase in volumes and<br />
was funded from normal credit facilities.<br />
Lighting and electrical accessories – Radiant Group<br />
Radiant Group reported revenue of R146,0 million (2013: R174,9 million), which is a decrease of 16,5% (2013: 10,4%, increased)<br />
when compared to the same period in the prior year. New market entrants, stringent competition and competing with certain<br />
inferior quality products have resulted in margins being eroded. Margins were also impacted by the change in the mix of products<br />
sold and a contraction in customers demand and buying patterns.<br />
The warehouse management system implementation together with an ERP upgrade had a significant impact on the processes<br />
within the supply chain environment. This had an impact on the ability to despatch stock to customers which directly impacted<br />
revenues and profitability.<br />
Property investments – Anchor Park<br />
Anchor Park’s revenue is derived from Group companies, as it leases its properties to fellow subsidiaries. Anchor Park has invested<br />
in a property for expansion purposes at the cable plant at a cost of R18,5 million, which was financed by long-term borrowings.<br />
The increase in interest expense is due to the increase in interest bearing debts.<br />
Seasonality<br />
The Group’s earnings are affected by seasonality as earnings for the second half of the year are historically higher than the first half.<br />
Management expects the historic seasonal trend to continue.<br />
Prospects<br />
The Group foresees a competitive market that will continues to weigh heavily on expected economic growth.<br />
The NUMSA strike halted operations in the Cable segment for four weeks. The strike will have a material affect on the revenue and<br />
margins during the second half of the year.<br />
The Cable segment will be able to take advantage of the improved capacity for the rest of the year, due to the capax expansion.<br />
The investment in improving supply chain abilities in line with Radiant Group’s strategic objectives are expected to contribute to<br />
improving revenues and profitability in the second half of the year.<br />
Appreciation<br />
The directors would like to express their appreciation towards management and staff as well as all our valued customers, suppliers,<br />
advisors, business partners and shareholders for their continued support.<br />
The above information, including any projections, included in this announcement has not been reviewed or reported on by South<br />
Ocean Holdings’ independent external auditors.<br />
On behalf of the Board<br />
Henry Pon<br />
Chairman<br />
6 August 2014<br />
Paul Ferreira<br />
Chief Executive Officer
CORPORATE INFORMATION<br />
South Ocean Holdings Limited<br />
(Registration number 2007/002381/06)<br />
Incorporated in the Republic of South Africa<br />
(“South Ocean Holdings”, “the Group” or “the Company”)<br />
Share code: SOH ISIN: ZAE000092748<br />
Directors:<br />
K H Pon # (Chairman)<br />
E H T Pan √@ (Deputy-Vice Chairman)<br />
P J M Ferreira* (Chief Executive Officer)<br />
J P Bekker* (Chief Financial Officer)<br />
M Chong #<br />
N Lalla #<br />
H L Li √Q<br />
W P Li √Q<br />
C H Pan √QA<br />
DL Pan √QA<br />
L Stephens #<br />
C Y Wu √Q<br />
* Executive<br />
#<br />
Independent Non-Executive<br />
√<br />
Non-Executive<br />
Q<br />
Taiwanese<br />
@<br />
Brazilian<br />
A<br />
Alternate<br />
Registered Office:<br />
12 Botha Street, Alrode, 1451<br />
PO Box 123738, Alrode, 1451<br />
Telephone: +27(11) 864 1606<br />
Telefax: +27(86) 628 9523<br />
Company Secretary:<br />
W T Green, 21 West Street, Houghton, 2198<br />
PO Box 123738, Alrode, 1451<br />
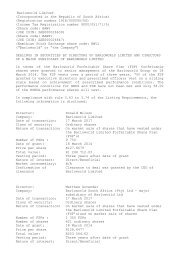
Sponsor:<br />
Investec Bank Limited<br />
(Registration number 1969/004763/06)<br />
Second Floor, 100 Grayston Drive, Sandown, Sandton, 2196<br />
Share Transfer Secretary:<br />
Computershare Investor Services Proprietary Limited<br />
Ground Floor, 70 Marshall Street, Johannesburg, 2001<br />
PO Box 61051, Marshalltown, 2107, South Africa<br />
Telephone: +27(11) 370 5000<br />
Telefax: +27(11) 688 5200<br />
Website: www.computershare.com<br />
Auditors:<br />
PricewaterhouseCoopers Inc.<br />
32 Ida Street, Menlyn, 0102<br />
Tel +27(12) 429 0000<br />
www.southoceanholdings.com