Using of Regression Method to Calculate Transformation Equation
Using of Regression Method to Calculate Transformation Equation
Using of Regression Method to Calculate Transformation Equation

You also want an ePaper? Increase the reach of your titles
YUMPU automatically turns print PDFs into web optimized ePapers that Google loves.
MEASUREMENT SCIENCE REVIEW, Volume 1, Number 1, 2001<br />
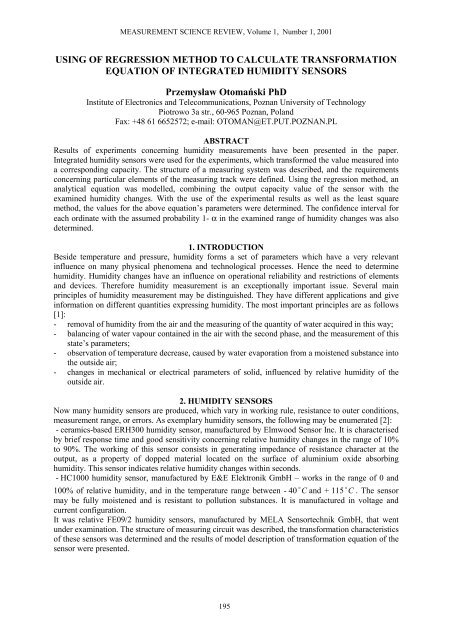
USING OF REGRESSION METHOD TO CALCULATE TRANSFORMATION<br />
EQUATION OF INTEGRATED HUMIDITY SENSORS<br />
Przemysław O<strong>to</strong>mański PhD<br />
Institute <strong>of</strong> Electronics and Telecommunications, Poznan University <strong>of</strong> Technology<br />
Piotrowo 3a str., 60-965 Poznan, Poland<br />
Fax: +48 61 6652572; e-mail: OTOMAN@ET.PUT.POZNAN.PL<br />
ABSTRACT<br />
Results <strong>of</strong> experiments concerning humidity measurements have been presented in the paper.<br />
Integrated humidity sensors were used for the experiments, which transformed the value measured in<strong>to</strong><br />
a corresponding capacity. The structure <strong>of</strong> a measuring system was described, and the requirements<br />
concerning particular elements <strong>of</strong> the measuring track were defined. <strong>Using</strong> the regression method, an<br />
analytical equation was modelled, combining the output capacity value <strong>of</strong> the sensor with the<br />
examined humidity changes. With the use <strong>of</strong> the experimental results as well as the least square<br />
method, the values for the above equation’s parameters were determined. The confidence interval for<br />
each ordinate with the assumed probability 1- α in the examined range <strong>of</strong> humidity changes was also<br />
determined.<br />
1. INTRODUCTION<br />
Beside temperature and pressure, humidity forms a set <strong>of</strong> parameters which have a very relevant<br />
influence on many physical phenomena and technological processes. Hence the need <strong>to</strong> determine<br />
humidity. Humidity changes have an influence on operational reliability and restrictions <strong>of</strong> elements<br />
and devices. Therefore humidity measurement is an exceptionally important issue. Several main<br />
principles <strong>of</strong> humidity measurement may be distinguished. They have different applications and give<br />
information on different quantities expressing humidity. The most important principles are as follows<br />
[1]:<br />
- removal <strong>of</strong> humidity from the air and the measuring <strong>of</strong> the quantity <strong>of</strong> water acquired in this way;<br />
- balancing <strong>of</strong> water vapour contained in the air with the second phase, and the measurement <strong>of</strong> this<br />
state’s parameters;<br />
- observation <strong>of</strong> temperature decrease, caused by water evaporation from a moistened substance in<strong>to</strong><br />
the outside air;<br />
- changes in mechanical or electrical parameters <strong>of</strong> solid, influenced by relative humidity <strong>of</strong> the<br />
outside air.<br />
2. HUMIDITY SENSORS<br />
Now many humidity sensors are produced, which vary in working rule, resistance <strong>to</strong> outer conditions,<br />
measurement range, or errors. As exemplary humidity sensors, the following may be enumerated [2]:<br />
- ceramics-based ERH300 humidity sensor, manufactured by Elmwood Sensor Inc. It is characterised<br />
by brief response time and good sensitivity concerning relative humidity changes in the range <strong>of</strong> 10%<br />
<strong>to</strong> 90%. The working <strong>of</strong> this sensor consists in generating impedance <strong>of</strong> resistance character at the<br />
output, as a property <strong>of</strong> dopped material located on the surface <strong>of</strong> aluminium oxide absorbing<br />
humidity. This sensor indicates relative humidity changes within seconds.<br />
- HC1000 humidity sensor, manufactured by E&E Elektronik GmbH – works in the range <strong>of</strong> 0 and<br />
100% <strong>of</strong> relative humidity, and in the temperature range between - 40 o C and + 115 o C . The sensor<br />
may be fully moistened and is resistant <strong>to</strong> pollution substances. It is manufactured in voltage and<br />
current configuration.<br />
It was relative FE09/2 humidity sensors, manufactured by MELA Sensortechnik GmbH, that went<br />
under examination. The structure <strong>of</strong> measuring circuit was described, the transformation characteristics<br />
<strong>of</strong> these sensors was determined and the results <strong>of</strong> model description <strong>of</strong> transformation equation <strong>of</strong> the<br />
sensor were presented.<br />
195
Measurement <strong>of</strong> Physical Quantities ● P. O<strong>to</strong>mański<br />
3. EXPERIMENTAL RESEARCH<br />
FE 09/2 sensors consist <strong>of</strong> a system <strong>of</strong> electrodes covered with a semiconduc<strong>to</strong>r protecting layer,<br />
located on ceramic base. Their working is based on the rule <strong>of</strong> output capacity C change in the<br />
function <strong>of</strong> relative humidity RH . Basic parameters <strong>of</strong> these sensors are the following: measuring<br />
range - between 0 and 100% <strong>of</strong> relative humidity, working temperature – between - 40 o C and 140 o C ,<br />
basic capacity - (135±10) pF, response time – 10 s, linearity < ±2% <strong>of</strong> relative humidity.<br />
The transformation characteristics <strong>of</strong> this sensor was determined on the measuring system shown in<br />
Fig.1.<br />
Thermometer<br />
RLC meter<br />
Temperature sensor<br />
Humidity sensor<br />
Semi-permeable membrane<br />
Standard solution<br />
Fig.1 Scheme <strong>of</strong> measuring system <strong>to</strong> determine the transformation characteristics <strong>of</strong> FE09/2 humidity<br />
sensor<br />
A calibrated sensor was put in<strong>to</strong> a hermetically closed vessel in the environment <strong>of</strong> vapours <strong>of</strong><br />
saturated standard solution. The vapours <strong>of</strong> this solution transpired in<strong>to</strong> the field where the examined<br />
sensor was located through semi-permeable membrane. Depending on the kind <strong>of</strong> solution used for the<br />
experiment, appropriate value <strong>of</strong> relative humidity was acquired. The measurement <strong>of</strong> sensor capacity<br />
C dependent on humidity value RH , was performed with RLC - HP4263B digital meter, which error<br />
is equal <strong>to</strong> ±0.1% <strong>of</strong> the measured value. The temperature inside the vessel was measured with<br />
DTM 1010 digital thermometer. As sensor co-operating with the thermometer, a nickel-chromium<br />
thermo-element was used. In the temperature range considered, the temperature was measured with the<br />
error <strong>of</strong> ∆ T = ± ( 0 .5K<br />
+ 1digit)<br />
, and the error concerns the digital thermometer <strong>to</strong>gether with the<br />
nickel-chromium thermo-element. Special thread connection between humidity and temperature<br />
sensors inside the vessel and the thermometer and the RLC meter prevents from the exchange <strong>of</strong><br />
temperature and humidity with the outside environment. Statement <strong>of</strong> measuring results <strong>of</strong> capacity<br />
C in the function <strong>of</strong> relative humidity changes RH , performed in the system shown in Fig.1, was<br />
presented in Table 1.<br />
Table 1. Statement <strong>of</strong> measuring results concerning the determination <strong>of</strong> transformation characteristics<br />
<strong>of</strong> FE 09/2 humidity sensors<br />
relative sensor 1 sensor 2 sensor 3<br />
Standard solution humidity capacity capacity capacity<br />
% pF pF pF<br />
Lithium chloride LiCl 12 137 138 138<br />
Magnesium chloride MgCl 2 33 142 143 142<br />
Sodium chloride NaCl 75 155 156 155<br />
Potassium chloride KCl 84 159 160 160<br />
Barium chloride BaCl 2 90 162 163 163<br />
All the measurements were conducted in temperature T=25 o C. There are many possibilities <strong>of</strong><br />
presenting the experimental data <strong>of</strong> Table 1 by means <strong>of</strong> an equation illustrating relations <strong>of</strong> the values<br />
<strong>of</strong> measurement-based variables. When selecting the shape <strong>of</strong> empirical equation that presents the<br />
experimental data, one should keep in mind two postulates. First – the equation should in the best<br />
possible way present the dependence among variables values that result from the measurement.<br />
Second – it should contain the least possible number <strong>of</strong> constants. Analysing the measurement results<br />
in Table 1, one can assume that it is possible <strong>to</strong> use linear regression <strong>to</strong> describe the dependence <strong>of</strong> the<br />
influence <strong>of</strong> relative humidity changes RH on changes in output capacity C .<br />
196
MEASUREMENT SCIENCE REVIEW, Volume 1, Number 1, 2001<br />
The regression equation is formulated in order <strong>to</strong> enable the prediction <strong>of</strong> the values <strong>of</strong> dependent<br />
variable C , based on the values <strong>of</strong> independent variable RH . This prediction is more or less accurate,<br />
according <strong>to</strong> lower or higher degree <strong>of</strong> dependence <strong>of</strong> both variables. The measure <strong>of</strong> the dependence<br />
between these variables is correlation coefficient. If it reaches values close <strong>to</strong> the boundary values ± 1,<br />
one can infer that the dependence between the variables is strong, and that it is linear.<br />
Based on the results <strong>of</strong> the experiment shown in Table 1, the estima<strong>to</strong>rs <strong>of</strong> the correlation coefficient<br />
r RH , C <strong>of</strong> the examined indica<strong>to</strong>rs were determined. After the calculations, the result obtained was<br />
equal <strong>to</strong> r RH , C = 0.996. Hence, a linear regression equation was accepted <strong>to</strong> describe the dependence<br />
between the variables RH and C :<br />
C = α 1 + β ⋅ RH<br />
(1)<br />
Estima<strong>to</strong>rs a and b <strong>of</strong> parameters α 1 and β were determined from trial. Number values <strong>of</strong> these<br />
parameters were determined using the least squares method. According <strong>to</strong> the method, the parameter<br />
values were selected so in order <strong>to</strong> minimize the sum square <strong>of</strong> differences between observed values<br />
•<br />
C and the estimate expected value C = a + b ⋅ RH . Parameters values a and b were determined using<br />
the computer program, hence the empirical regression equation was assumed:<br />
Fig. 2 presents the experimental characteristic f ( RH )<br />
•<br />
C = 133 ,38 + 0,32⋅<br />
RH<br />
(2)<br />
C = for sensor 2, in the form <strong>of</strong> measuring<br />
points, and transformation characteristic <strong>of</strong> the same sensor in the form <strong>of</strong> regression line with the use<br />
<strong>of</strong> equation (2). Assuming the normal distribution <strong>of</strong> variable C with the given value <strong>of</strong> variable RH ,<br />
it is possible <strong>to</strong> prove [3] that parameters a and b<br />
( b − k < β < b + ) = 1−α<br />
P (4)<br />
b k b<br />
are unbiased estima<strong>to</strong>rs α 1 and β respectively, and<br />
their distribution from the trial is related <strong>to</strong><br />
Student’s distribution t for k = n − 2 degrees <strong>of</strong><br />
freedom. This enables <strong>to</strong> determine confidence<br />
intervals for α 1 and β as well as for the expected<br />
E C = f RH for the determined value<br />
value ( ) ( )<br />
RH = RH i . Making the calculations for many<br />
values <strong>of</strong> RH , we obtain the confidence intervals<br />
that were determined according <strong>to</strong> dependences [4]:<br />
( a − k < α < a + k ) = 1−α<br />
P (3)<br />
a<br />
1 a<br />
Fig. 2 <strong>Transformation</strong> characteristic<br />
C = f ( RH ) in the form <strong>of</strong> measuring points<br />
<strong>to</strong>gether with the determined regression line for<br />
where:<br />
⎛ •<br />
• ⎞<br />
P ⎜C−<br />
k • < E( C) < C+<br />
k •<br />
⎟ = 1−α<br />
(5)<br />
⎝ C<br />
C ⎠<br />
k<br />
a<br />
1<br />
= tqk<br />
⋅ S • +<br />
n<br />
n<br />
C<br />
∑( RHi<br />
− RH )<br />
i=<br />
1<br />
RH<br />
2<br />
2<br />
(6)<br />
197
Measurement <strong>of</strong> Physical Quantities ● P. O<strong>to</strong>mański<br />
k<br />
b<br />
= t ⋅ S •<br />
qk<br />
C<br />
n<br />
∑( RHi<br />
− RH )<br />
i=<br />
1<br />
1<br />
2<br />
(7)<br />
k<br />
= t ⋅ S •<br />
1<br />
+<br />
n<br />
• qk<br />
n<br />
C C<br />
2<br />
( RHi<br />
− RH )<br />
∑( RHi<br />
− RH )<br />
i=<br />
1<br />
2<br />
(8)<br />
S<br />
• =<br />
C<br />
n<br />
∑[ C − ( a + b ⋅ RH )]<br />
i=<br />
1<br />
n − 2<br />
2<br />
(9)<br />
S • - standard deviation <strong>of</strong> the trial <strong>of</strong> the observed values C in relation <strong>to</strong> C • , tqk<br />
- standarized<br />
C<br />
variable <strong>of</strong> Student’s distribution t, read out from the Student’s distribution tables for the confidence<br />
interval 1 −α<br />
and the number <strong>of</strong> freedom degrees k = n − 2 .<br />
Having computed the values <strong>of</strong> C • , a confidence interval for each ordinate C i with the assumed<br />
probability 1 −α<br />
may be determined, based on the dependence (5). <strong>Using</strong> the dependences (5), (8),<br />
and (9) number values <strong>of</strong> the confidence interval for the transformation characteristic <strong>of</strong> sensor 2 with<br />
probability 1 −α<br />
were determined. A statement <strong>of</strong> computation results is given in Table 2.<br />
Table 2 Confidence interval values for transformation characteristic <strong>of</strong> sensor 2, determined with<br />
probability 1 − α = 0, 95<br />
Relative humidity Sensor capacity Determined confidence interval<br />
% pF pF pF<br />
12 138 130,4 142,9<br />
33 143 138,6 147,6<br />
75 156 152,1 159,9<br />
84 160 154,3 163,2<br />
90 163 155,7 165,5<br />
4. CONCLUSIONS<br />
Static transformation characteristics <strong>of</strong> humidity sensors FE09/2 were determined on a designed and<br />
performed measuring position. The measurement results obtained, set up in Table 1 and presented for<br />
an exemplary sensor in Fig. 2, testify <strong>to</strong> a good linearity <strong>of</strong> the sensors examined. It gave reason <strong>to</strong><br />
accept the linear pattern for the description <strong>of</strong> static transformation equation <strong>of</strong> the sensors presented.<br />
The confidence intervals determined show a good accuracy <strong>of</strong> the model in the form <strong>of</strong> the regression<br />
line, expressing the dependence <strong>of</strong> output sensor capacity C in the function <strong>of</strong> changes in relative<br />
humidity RH .<br />
5. REFERENCES<br />
1. Romer E.: Miernictwo przemysłowe, PWN, Warszawa, 1978.<br />
2. S<strong>to</strong>larski E.: Czujniki elektroniczne, Oficyna Wydawnicza Adiu<strong>to</strong>r, Warszawa, 1997.<br />
3. Turzeniecka D.: Ocena niepewności wyniku pomiarów, Wydawnictwo Politechniki Poznańskiej,<br />
Poznań, 1997.<br />
4. Dowdy S., Wearden S.: Statistic for research, John Wiley, New York, 1983.<br />
198