Vulnerability Assessment of Cugman River Watershed
Vulnerability Assessment of Cugman River Watershed
Vulnerability Assessment of Cugman River Watershed

You also want an ePaper? Increase the reach of your titles
YUMPU automatically turns print PDFs into web optimized ePapers that Google loves.
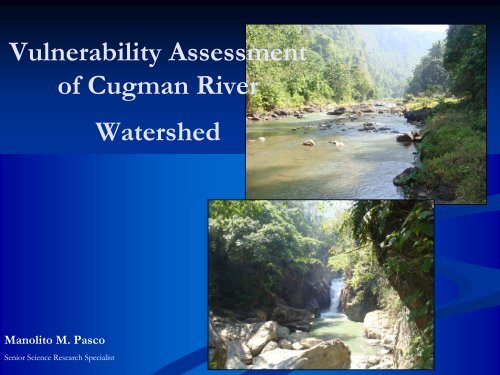
<strong>Vulnerability</strong> <strong>Assessment</strong><br />
<strong>of</strong> <strong>Cugman</strong> <strong>River</strong><br />
<strong>Watershed</strong><br />
Manolito M. Pasco<br />
Senior Science Research Specialist
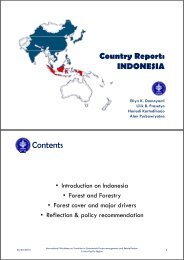
Geographical Location<br />
The <strong>Cugman</strong> river<br />
watershed stretches from the<br />
northern portion <strong>of</strong> the<br />
province <strong>of</strong> Bukidnon toward<br />
the coastal area <strong>of</strong> Cagayan de<br />
Oro City, Misamis Oriental with<br />
its main drainage outlet<br />
emptying down the coast <strong>of</strong><br />
Macajalar Bay. Geographically it<br />
lies between 8°13’25’’ to<br />
8°28’30’’ north latitude and<br />
124°41’45” to 124°49’20” east<br />
longitude.
Significance <strong>of</strong> the <strong>Vulnerability</strong><br />
<strong>Assessment</strong> <strong>of</strong> <strong>Watershed</strong><br />
1. It is used as planning tool and as guidance in the<br />
preparation <strong>of</strong> Integrated <strong>Watershed</strong> Management and<br />
Development Plan.<br />
2. It provides guidance to LGU on landuse zoning and<br />
disaster preparedness<br />
3. It provides technical basis for policy<br />
formulation/issuances<br />
4. It recommends mitigating measures and strategies to<br />
reduce the destructive impact <strong>of</strong> natural and manmade<br />
hazards.
Objectives<br />
1. To identify the potential hazards and the critical physical<br />
and anthropogenic factors that influence the occurrences<br />
<strong>of</strong> such hazards.<br />
2. To facilitate zoning <strong>of</strong> watershed areas according to level<br />
<strong>of</strong> vulnerability to natural and man-made hazards<br />
3. To recommend preventive or mitigating measures as<br />
guide in the formulation <strong>of</strong> intended interventions in the<br />
watershed<br />
4. To enhance disaster preparedness by LGU.<br />
5. To provide valid technical information as basis in the<br />
formulation <strong>of</strong> policies
Methodology<br />
A. Landslide Hazard <strong>Vulnerability</strong> <strong>Assessment</strong><br />
Conceptual Framework<br />
<strong>Watershed</strong> Characterization Report<br />
Review and Validation <strong>of</strong><br />
Data/Maps<br />
Hazard Identification<br />
Collecting/ Gathering <strong>of</strong><br />
Additional Data<br />
Soil Erosion Hazards<br />
Physical Factors<br />
Landslide Hazard<br />
Identification <strong>of</strong> Landslide<br />
Critical Factors<br />
Mapping <strong>of</strong> Critical Factors<br />
Flooding Hazards<br />
Anthropogenic Factors<br />
Physical Factors Category<br />
Maps<br />
Overlaying <strong>of</strong> Maps and<br />
Analysis<br />
Landslide <strong>Vulnerability</strong> Map<br />
(Physical Factor)<br />
Preparation <strong>of</strong> Critical Factors<br />
Category Maps<br />
Overlaying <strong>of</strong> Maps and<br />
Analysis<br />
Landslide Hazard<br />
<strong>Vulnerability</strong> Map<br />
Anthropogenic Factors<br />
Category Maps<br />
Overlaying <strong>of</strong> Maps and<br />
Analysis<br />
Landslide <strong>Vulnerability</strong> Map<br />
(Anthropogenic Factor)<br />
Field Validation/ Ground<br />
truthing<br />
Formulation <strong>of</strong> Mitigation<br />
measure & policy<br />
recommendation<br />
Landslide Hazard <strong>Vulnerability</strong><br />
<strong>Assessment</strong> Report<br />
Review, revision and<br />
refinement <strong>of</strong> report
2. Identification <strong>of</strong> Critical Factors Influencing<br />
Landslide Hazard<br />
Physical critical factors- Slope, Rainfall, Landuse, Soil type,<br />
and Geology<br />
Anthropogenic critical factors- Farming system/Landuse,<br />
and Road Network<br />
3. Mapping <strong>of</strong> Critical Factors<br />
Selected thematic maps from watershed<br />
characterization report<br />
Validation, rectification and/or refinement <strong>of</strong> thematic<br />
maps <strong>of</strong> critical factors e.g. slope map, rainfall map,<br />
landuse map, soil map, geology map and road network map
4. Preparation <strong>of</strong> Landslide Hazard Category Map<br />
<strong>of</strong> the Critical Factors<br />
• Basis for categorizing the level <strong>of</strong> vulnerability <strong>of</strong> physical<br />
factors<br />
Table 1. Rating <strong>of</strong> Critical Factors (Physical Factors)<br />
<strong>Vulnerability</strong><br />
Class<br />
Not<br />
Vulnerable<br />
Rating<br />
Slope<br />
(%)<br />
Rainfall<br />
(Annual –<br />
mm)<br />
Critical Physical Factors<br />
Vegetative Cover Soil Type Geologic<br />
Formation<br />
1 0 – 8 50 >2,016<br />
Domestic agri-crops<br />
Bolinao<br />
clay<br />
Quarternary<br />
alluvium/ Cagayan<br />
terrace deposits
Basis for categorizing the level <strong>of</strong> vulnerability <strong>of</strong><br />
anthropogenic factors<br />
Table 2. Landslide hazard values due to farming system<br />
Rating<br />
<strong>Vulnerability</strong><br />
class<br />
1 Very low<br />
vulnerability<br />
2 Low vulnerability<br />
Extend <strong>of</strong> disturbances by farming system<br />
The farming system in the watershed do not favor landslides<br />
The farming system in the watershed slightly favor minor landslide<br />
de<br />
3 Moderate<br />
vulnerability<br />
4 Highly vulnerable<br />
The farming system in the watershed slightly favor major landslide<br />
de<br />
The farming system in the watershed highly favor minor landslide<br />
5 Very highly<br />
vulnerable<br />
The farming system in the watershed highly favor major landslide
Table 3. Landslide hazard values based on relative distance from the road<br />
Rating<br />
<strong>Vulnerability</strong> class<br />
Relative distance from the edge <strong>of</strong> road<br />
1 Very low<br />
vulnerability<br />
>60 meters away from the edge <strong>of</strong> the road<br />
2 Low vulnerability 45.1-60 meters away from the edge <strong>of</strong> the<br />
road<br />
3 Moderate<br />
vulnerability<br />
30.1-45 meters away from the edge <strong>of</strong> the<br />
road<br />
4 Highly vulnerable 15-30 meters away from the edge <strong>of</strong> the road<br />
5 Very highly<br />
vulnerable<br />
5. Overlaying <strong>of</strong> category maps and<br />
determination <strong>of</strong> landslide hazard<br />
vulnerability<br />
A. Physical factors<br />
V L =0.30Sl + 0.25R + 0.20Lu + 0.15S + 0.10G<br />
Where:<br />
V L = Landslide <strong>Vulnerability</strong> Hazard Value<br />
Sl = Slope (30%)<br />
R = Isohytal Rainfall (25%)<br />
Lu = Landuse (20%)<br />
S = Soil Type (15%)<br />
G = Geology (10%)
B. Anthropogenic factor<br />
VL= Hazard Value <strong>of</strong> Farming System + Hazard Value<br />
<strong>of</strong> Relative Distance from the Road ÷ 2<br />
Basis for the Landslide <strong>Vulnerability</strong> Value (Physical and<br />
Anthropogenic Factors)<br />
Table 4. Rating ranges <strong>of</strong> vulnerability class<br />
Landslide vulnerability class<br />
Rating Ranges<br />
Very low <strong>Vulnerability</strong> 4.2
6. Overlaying <strong>of</strong> landslide hazard vulnerability maps<br />
both the physical and anthropogenic factors<br />
Where:<br />
V L = 0.9Lp + 0.1La<br />
V L<br />
= Landslide <strong>Vulnerability</strong> value<br />
Lp = Landslide <strong>Vulnerability</strong> value due to physical factors (90%)<br />
La = Landslide <strong>Vulnerability</strong> value due to anthropogenic factors (10%)<br />
Table 4. Rating ranges <strong>of</strong> vulnerability class<br />
Landslide vulnerability class<br />
Rating Ranges<br />
Very low <strong>Vulnerability</strong> 4.2
B. Soil Erosion Hazard <strong>Vulnerability</strong><br />
<strong>Assessment</strong><br />
1. Physical Factors<br />
Conceptual Framework<br />
Rainfall<br />
Category Map<br />
Slope Category<br />
Map<br />
Landuse<br />
Category Map<br />
Soil Type<br />
Category Map<br />
Geology<br />
Category Map<br />
Overlaying/Spatial<br />
Analysis<br />
<strong>Vulnerability</strong><br />
Class<br />
Soil Erosion Hazard<br />
<strong>Vulnerability</strong> Map
a. Two methods <strong>of</strong> Assessing Soil Hazard <strong>Vulnerability</strong><br />
The GIS-assisted mapping techniques and spatial analysis<br />
Use <strong>of</strong> USLE- Universal Soil Loss Equation<br />
b. Identification <strong>of</strong> Critical Factors that Influence the occurrence <strong>of</strong><br />
Soil Erosion: Rainfall, Slope, Soil type, Landuse, Geology<br />
c. Preparation <strong>of</strong> Critical Factors Category Maps. (The categorized<br />
maps <strong>of</strong> critical physical factor used in landslide<br />
assessment are the same maps in assessing the soil erosion<br />
vulnerability except the weight which are changed to the<br />
following):<br />
Vse = 0.40 R + .20 Lu + 0.20 Sl + 0.15 S + 0.05 G<br />
Where:<br />
R= Rainfall (40%)<br />
Lu= Landuse (20%)<br />
Sl= Slope (20%)<br />
S= Soil type (15%)<br />
G= Geologic age/ Formation (5%)
Overlaying <strong>of</strong> Soil Erosion Critical<br />
Physical Factor Category Map<br />
Using the above equation the soil erosion hazard value is<br />
determined. The hazard value is referred to Table 4 to determine<br />
the Hazard <strong>Vulnerability</strong> Class.<br />
Table 4 Rating ranges <strong>of</strong> vulnerability class<br />
Landslide vulnerability class<br />
Rating Ranges<br />
Very low <strong>Vulnerability</strong> 4.2
2. Anthropogenic Factors<br />
Conceptual Framework<br />
Farming Practices/<br />
Landuse<br />
Farming System<br />
Category Maps<br />
Relative Distance<br />
from the Road<br />
Road Network<br />
Category Map<br />
Overlaying/Spatial Analysis<br />
Sev = (FS + RD) /2<br />
<strong>Vulnerability</strong> Class<br />
Soil Erosion Hazard<br />
<strong>Vulnerability</strong> Map<br />
(Anthropogenic)
a. The landuse and road network category maps used in landslide<br />
vulnerability assessment are the same maps used in soil<br />
erosion vulnerability assessment (anthropogenic factors)<br />
b. Overlaying <strong>of</strong> the landuse category map and road network<br />
category maps. The same methodology used in landslide<br />
vulnerability assessment was also employed where the following<br />
equation was used<br />
Vse= Hazard Value <strong>of</strong> Farming System + Hazard Value<br />
<strong>of</strong> Relative Distance from the Road / 2<br />
The value <strong>of</strong> Vse was also referred to Table 4
Overlaying <strong>of</strong> Soil Erosion Hazard<br />
<strong>Vulnerability</strong> Maps (Physical and<br />
Anthropogenic Factors)<br />
V se = 0.9SEp + 0.1SEa<br />
Where:<br />
Vse= Soil Erosion <strong>Vulnerability</strong> value<br />
SEp= Soil Erosion<strong>Vulnerability</strong> value due to physical factors (90%)<br />
SEa = Soil Erosion <strong>Vulnerability</strong> value due to anthropogenic factors (10%)
C. FLOOD HAZARD VULNERABILITY<br />
ASSESSMENT<br />
Identification and Verification <strong>of</strong> Flood Hazard<br />
• It involves the analysis <strong>of</strong> the geomorphological attributes <strong>of</strong> the<br />
watershed, the existing landuse, the rainfall pattern and actual verification<br />
from the ground including interview from the local residents on the<br />
occurrence <strong>of</strong> flood.<br />
Mapping <strong>of</strong> Flood Prone Area<br />
• The flood prone area mapping involved the calculation <strong>of</strong> areas with elevation<br />
below the elevation <strong>of</strong> the highest flood watermark. The generated flood prone<br />
area map was validated using the Global Positioning System readings <strong>of</strong> the actual<br />
location <strong>of</strong> flooded areas within the watershed.
RESULTS AND DISCUSSION<br />
1. Landslide Hazard <strong>Vulnerability</strong> <strong>Assessment</strong><br />
a. Critical Factors Identification<br />
Slope, Rainfall, Landuse, Soil type, Geologic<br />
Age/Formation, Farming System and Road Network<br />
b. Mapping <strong>of</strong> Critical Factors<br />
•The thematic maps <strong>of</strong> critical factors validated and rectified<br />
are the following:<br />
•Physical Factors<br />
Slope, Rainfall, Landuse, Soil type, Geologic<br />
Age/Formation
Mapping <strong>of</strong> Critical Factors<br />
Digital Road Landuse Geologic Rainfall Slope Elevation Network Map<br />
Map
Categorization <strong>of</strong> Critical Physical Factor Maps<br />
Basis for the categorization<br />
Table 1. Rating <strong>of</strong> Critical Factors (Physical Factors)<br />
Rating<br />
Critical Physical Factors<br />
<strong>Vulnerability</strong><br />
Class<br />
Slope (%)<br />
Rainfall (Annual<br />
– mm)<br />
Vegetative<br />
Cover<br />
Soil Type<br />
Geologic<br />
Formation<br />
Not<br />
Vulnerable<br />
1 0 – 8 50 >2,016 Domestic<br />
agri-crops<br />
Bolinao<br />
clay<br />
Bolinao<br />
clay<br />
Himalyan formation<br />
Quarternary<br />
alluvium/ Cagayan<br />
terrace deposits
Critical Physical Factor Category Maps<br />
Road Geologic Landuse Rainfall Slope Soil Network Hazard Hazard Map<br />
Map<br />
Map
Overlaying <strong>of</strong> Critical Physical Factor Category Maps<br />
Slope Hazard Map<br />
Soil Hazard Map<br />
Landuse Hazard Map<br />
Rainfall Hazard Map<br />
Geologic Hazard Map<br />
Road Network Hazard Map
VL = 0.40 Sl + 0.30 R + 0.15 S + 0.10 VC + 0.05 G<br />
Table 4. Rating ranges <strong>of</strong> vulnerability class:<br />
Landslide vulnerability class<br />
Rating Ranges<br />
Very low <strong>Vulnerability</strong> 4.2
Landslide Hazard <strong>Vulnerability</strong> Map<br />
(Physical Factors)
Categorization <strong>of</strong> Critical Anthropogenic Factor Maps<br />
Table 3. Landslide Value Based on Relative Distance from the Road<br />
Rating<br />
<strong>Vulnerability</strong> class<br />
Relative distance from the edge <strong>of</strong> road<br />
1 Very low<br />
vulnerability<br />
>60 meters away from the edge <strong>of</strong> the road<br />
2 Low vulnerability 45.1-60 meters away from the edge <strong>of</strong> the<br />
road<br />
3 Moderate<br />
vulnerability<br />
30.1-45 meters away from the edge <strong>of</strong> the<br />
road<br />
4 Highly vulnerable 15-30 meters away from the edge <strong>of</strong> the road<br />
5 Very highly<br />
vulnerable<br />
Table 2. Landslide hazard values due to farming system<br />
Rating<br />
<strong>Vulnerability</strong><br />
class<br />
1 Very low<br />
vulnerability<br />
2 Low vulnerability<br />
Extend <strong>of</strong> disturbances by farming system<br />
The farming system in the watershed do not favor landslides<br />
The farming system in the watershed slightly favor minor landslide<br />
de<br />
3 Moderate<br />
vulnerability<br />
4 Highly vulnerable<br />
The farming system in the watershed slightly favor major landslide<br />
de<br />
The farming system in the watershed highly favor minor landslide<br />
5 Very highly<br />
vulnerable<br />
The farming system in the watershed highly favor major landslide
Overlaying <strong>of</strong> Categorized Critical Anthropogenic Maps<br />
Landuse Category Map Road Network Category Map
V A = FShv + RDhv / 2<br />
Table 4. Rating ranges <strong>of</strong> vulnerability class<br />
Landslide vulnerability class<br />
Rating Ranges<br />
Very low <strong>Vulnerability</strong> 4.2
Landslide Hazard <strong>Vulnerability</strong> Map<br />
(Anthropogenic Factor)
Overlaying <strong>of</strong> Landslide Hazard <strong>Vulnerability</strong> Maps<br />
(Physical and Anthropogenic Factors)
V L = 0.9Lp + 0.1La<br />
Table 4. Rating ranges <strong>of</strong> vulnerability class<br />
Landslide vulnerability class<br />
Rating Ranges<br />
Very low <strong>Vulnerability</strong> 4.2
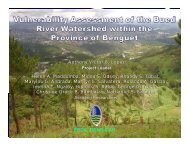
Final Landslide Hazard <strong>Vulnerability</strong> Map <strong>of</strong><br />
<strong>Cugman</strong> <strong>Watershed</strong>
Table 5. Landslide <strong>Vulnerability</strong> <strong>Assessment</strong> (Physical & Anthropogenic Factors)<br />
Barangay<br />
Area (ha)<br />
%<br />
cover<br />
Highly Vulnerable<br />
Area (ha)<br />
%<br />
cover<br />
Moderately<br />
Vulnerable<br />
Area (ha)<br />
%<br />
cover<br />
Low <strong>Vulnerability</strong><br />
Area (ha)<br />
%<br />
cover<br />
Very Low<br />
<strong>Vulnerability</strong><br />
Area (ha)<br />
1 Tablon 1175.1874 11.47 35.1795 2.99 364.0163 30.98 407.3272 34.66 368.6644 31.37<br />
2 <strong>Cugman</strong> 378.3973 3.69 - 22.295 5.89 30.9509 8.18 325.1514 85.93<br />
3<br />
F.S.<br />
Catanico<br />
670.4717<br />
6.54<br />
%<br />
cover<br />
3.0413 0.45 79.239 11.82 99.5334 14.85 488.848 72.91<br />
4 Gango 554.7846 5.41 3.546 0.64 43.9292 7.92 359.0725 64.72 148.257 26.72<br />
5 Palabucan 650.8001 6.35 4.0677 0.63 154.1056 23.68 433.9694 66.68 58.6574 9.01<br />
6 Kiliog 239.2789 2.33 - - 85.05 35.54 45.6663 19.08 108.6139 45.39<br />
7<br />
Poblacion 3953.4092 38.57 58.7288 1.49 852.1337 21.55<br />
2091.753<br />
4<br />
52.91 950.7936 24.05<br />
8 Sta Fe 467.6932 4.56 15.5595 3.33 39.4485 8.43 412.6852 88.24 - -<br />
9 Crossing 198.1756 1.93 4.7597 2.40 50.6814 25.57 142.7363 72.03 - -<br />
10 Laturan 956.5129 9.33 4.9828 0.52 66.2785 6.82 308.7386 32.28 - -<br />
11<br />
San Jose 379.9999 3.71 38.8986 10.26 100.5297 26.52 817.1846<br />
215.0<br />
5<br />
- -<br />
12 Maambong 460.4115 4.49 28.4016 6.17 305.9271 66.44 126.0828 27.38 - -<br />
13 Sil-ipon 164.4627 1.60 2.3851 1.45 162.6776 0.06 - - - -<br />
Total 10,249.59<br />
100<br />
199.542<br />
6<br />
1.95<br />
2326.311<br />
6<br />
22.70<br />
5275.700<br />
6<br />
51.47<br />
2448.985<br />
7<br />
23.89
Landslide Vulnerable Area By Barangay
Soil Erosion Hazard <strong>Vulnerability</strong> <strong>Assessment</strong><br />
The critical physical and anthropogenic factors influencing<br />
landslide are the same factors that influenced soil erosion. Hence,<br />
the categorized physical and anthropogenic factors maps are the<br />
same. It varies only with the assignment <strong>of</strong> weight.<br />
Vse = 0.40 R + 0.20 Sl + 0.20 Lu + 0.15 S + 0.05 G
Overlaying <strong>of</strong> Soil Erosion Hazard <strong>Vulnerability</strong> Maps<br />
(Physical and Anthropogenic Factors) is shown below:
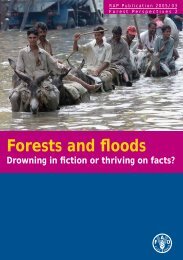
Final Soil Erosion Hazard <strong>Vulnerability</strong> Map<br />
<strong>of</strong> <strong>Cugman</strong> <strong>Watershed</strong>
Table 10. Soil Erosion Hazard <strong>Vulnerability</strong> Area by Barangay<br />
Barangay<br />
Area (ha)<br />
%<br />
Cover<br />
Highly Vulnerable<br />
Area<br />
(ha)<br />
%<br />
cover<br />
Moderately<br />
Vulnerable<br />
Area (ha)<br />
%<br />
cover<br />
Low Vulnerabiliy<br />
Area (ha)<br />
%<br />
cover<br />
Very Low<br />
<strong>Vulnerability</strong><br />
Area (ha)<br />
1 Tablon 1175.1874 11.47 78.841 6.7 490.2849 41.77 286.1173 24.35 320.0849 27.24<br />
2 <strong>Cugman</strong> 378.3973 3.69 44.9304 11.87 93.1601 24.62 240.3068 63.51<br />
3 F.S. Catanico 670.4717 6.54 8.5558 1.28 91.5289 13.65 25.847 3.85 544.536 81.22<br />
4 Gango 554.7846 5.41 75.2816 13.57 396.7263 71.51 82.7767 14.92<br />
5 Palabucan 650.8001 6.35 151.516 23.28 294.744 45.29 204.5401 31.43<br />
6 Kiliog 239.2789 2.33 11.1068 4.64 59.7576 24.97 168.4144 70.38<br />
%<br />
cover<br />
7<br />
Poblacion 3953.4092 38.57 10.2388 0.26 875.1763 22.14 1692.6614 42.81 1875.3327 34.79<br />
8 Sta Fe 467.6932 4.56 6.8796 1.47 103.6911 22.17 357.1225 76.36 - -<br />
9 Crossing 198.1756 1.93 8.7358 4.41 189.4398 95.59 - - - -<br />
10 Laturan 956.5129 9.33 23.1728 2.42 640.8617 67 292.4784 30.58 - -<br />
11 San Jose 379.9999 3.71 4.7102 1.24 302.6385 79.64 72.6512 19.12 - -<br />
12 Maambong 460.4115 4.49 78.371 17.02 283.1241 61.49 98.9744 21.48 - -<br />
13 Sil-ipon 164.4627 1.6 30.7532 18.7 133.7095 81.3 - - - -<br />
Total 10,249.59<br />
99.98<br />
250.2582 2.44 3393.2796 33.12 3670.1802 35.88 2935.9916 28.64
Soil Erosion Vulnerable Area By Barangay
C. Flood Hazard <strong>Vulnerability</strong> <strong>Assessment</strong><br />
Result on the delineation <strong>of</strong> the flood prone areas based from the common observation<br />
that areas below the elevation <strong>of</strong> the highest water landmark are prone to flooding is<br />
shown in map below
RECOMMENDED MITIGATING<br />
MEASURES/INTERVENTION ON HIGHLY<br />
VULNERABLE AREAS<br />
Table 8 and 9 show the recommended mitigating measures/<br />
intervention by barangay on highly vulnerable areas to soil<br />
erosion and landslide respectively.<br />
Table 8. Landslide Hazard Vulnerable Areas by Barangay and<br />
Recommended Mitigating Measures<br />
Table 9. Soil Erosion Hazard <strong>Vulnerability</strong> Area by Barangay and the<br />
Corresponding Recommended Mitigating Measures.
Limitation <strong>of</strong> the <strong>Vulnerability</strong><br />
<strong>Assessment</strong> Study<br />
1. Absence <strong>of</strong> comprehensive soil map.<br />
2. Insufficient geological data.<br />
3. Absence <strong>of</strong> rainfall data within or adjacent to watershed area.<br />
4. Assigning <strong>of</strong> weight to the model is subject to change<br />
depending on the result <strong>of</strong> ground truthing.<br />
5. Inadequate watershed characterization terminal report.