2012 Annual Report - Virginia Department of Transportation
2012 Annual Report - Virginia Department of Transportation
2012 Annual Report - Virginia Department of Transportation

You also want an ePaper? Increase the reach of your titles
YUMPU automatically turns print PDFs into web optimized ePapers that Google loves.
Safety Service Patrol<br />
Assisting motorists quickly and safely - reducing delays and improving<br />
travel in Hampton Roads.<br />
In phase 2 <strong>of</strong> the SSP expansion the number<br />
<strong>of</strong> routes patrolled increased from 8 to 12 and<br />
the number <strong>of</strong> centerline miles covered<br />
increased from 89 to 134!<br />
The large increase in miles covered was<br />
mostly due to the addition <strong>of</strong> the Croaker route.<br />
The Croaker route is the longest route at 15<br />
miles. It covers I-64 from exit 242 near<br />
Williamsburg to exit 220, an area that has never<br />
before been patrolled by the HRTOC SSP.<br />
At the beginning <strong>of</strong> the second quarter <strong>2012</strong><br />
SSPs began patrolling the new areas just once a<br />
shift to become familiar with the routes. As the<br />
SSP department grew in size so did the<br />
frequency <strong>of</strong> patrolling the new routes. By the<br />
end <strong>of</strong> the second quarter the department had<br />
grown to 65 employees and the new routes were<br />
fully patrolled. However, the average response<br />
time had increased to 8.9 minutes. The average<br />
response time was impacted by the new Croaker<br />
route because <strong>of</strong> the distance the SSP may have<br />
to travel after being dispatched to an incident<br />
on the route as well as limited camera coverage<br />
in some areas <strong>of</strong> the route.<br />
When an incident is detected by a source<br />
other than the SSP, control room operators<br />
confirm the incident details, including location,<br />
via CCTV and then dispatch a SSP to the scene.<br />
In the areas with limited camera coverage the<br />
operator dispatches a SSP to the scene based<br />
only on the information provided by the<br />
detection source, such as a motorist phone call.<br />
This information can sometimes be inaccurate<br />
and the SSP may have to drive around until they<br />
can find the actual incident scene.<br />
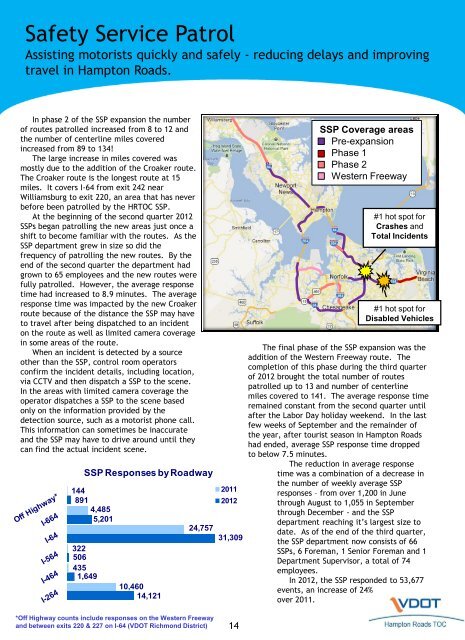
SSP Responses by Roadway<br />
144<br />
891<br />
4,485<br />
5,201<br />
322<br />
506<br />
435<br />
1,649<br />
10,460<br />
14,121<br />
24,757<br />
*Off Highway counts include responses on the Western Freeway<br />
and between exits 220 & 227 on I-64 (VDOT Richmond District)<br />
2011<br />
<strong>2012</strong><br />
31,309<br />
14<br />
SSP Coverage areas<br />
Pre-expansion<br />
Phase 1<br />
Phase 2<br />
Western Freeway<br />
#1 hot spot for<br />
Crashes and<br />
Total Incidents<br />
#1 hot spot for<br />
Disabled Vehicles<br />
The final phase <strong>of</strong> the SSP expansion was the<br />
addition <strong>of</strong> the Western Freeway route. The<br />
completion <strong>of</strong> this phase during the third quarter<br />
<strong>of</strong> <strong>2012</strong> brought the total number <strong>of</strong> routes<br />
patrolled up to 13 and number <strong>of</strong> centerline<br />
miles covered to 141. The average response time<br />
remained constant from the second quarter until<br />
after the Labor Day holiday weekend. In the last<br />
few weeks <strong>of</strong> September and the remainder <strong>of</strong><br />
the year, after tourist season in Hampton Roads<br />
had ended, average SSP response time dropped<br />
to below 7.5 minutes.<br />
The reduction in average response<br />
time was a combination <strong>of</strong> a decrease in<br />
the number <strong>of</strong> weekly average SSP<br />
responses – from over 1,200 in June<br />
through August to 1,055 in September<br />
through December - and the SSP<br />
department reaching it’s largest size to<br />
date. As <strong>of</strong> the end <strong>of</strong> the third quarter,<br />
the SSP department now consists <strong>of</strong> 66<br />
SSPs, 6 Foreman, 1 Senior Foreman and 1<br />
<strong>Department</strong> Supervisor, a total <strong>of</strong> 74<br />
employees.<br />
In <strong>2012</strong>, the SSP responded to 53,677<br />
events, an increase <strong>of</strong> 24%<br />
over 2011.