The use of Control Charts with Composite materials
The use of Control Charts with Composite materials
The use of Control Charts with Composite materials

You also want an ePaper? Increase the reach of your titles
YUMPU automatically turns print PDFs into web optimized ePapers that Google loves.
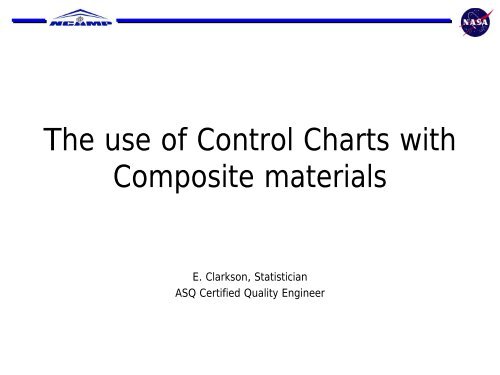
<strong>The</strong> <strong>use</strong> <strong>of</strong> <strong>Control</strong> <strong>Charts</strong> <strong>with</strong><br />
<strong>Composite</strong> <strong>materials</strong><br />
E. Clarkson, Statistician<br />
ASQ Certified Quality Engineer
<strong>Control</strong> <strong>Charts</strong><br />
• Everything varies at least a little bit. How can you<br />
tell when a process is just experiencing normal<br />
variation versus when something out <strong>of</strong> the ordinary<br />
is occurring? <strong>Control</strong> charts were designed to make<br />
that distinction.<br />
Line graph for Fill Compression ETW<br />
Subgroup Average<br />
78<br />
76<br />
74<br />
72<br />
70<br />
68<br />
0 10 20 30 40 50<br />
Subgroup
Example <strong>Control</strong> Chart<br />
X-bar Chart for Fill Compression ETW<br />
X-bar<br />
78<br />
76<br />
74<br />
72<br />
70<br />
CTR = 72.53<br />
UCL = 76.34<br />
LCL = 68.72<br />
68<br />
0 10 20 30 40 50<br />
Subgroup
Why <strong>use</strong> a control chart?<br />
• It’s as important to know when to leave<br />
things alone as it is to know when to<br />
take action. <strong>Control</strong> charts tell us when<br />
we need to take action and when to<br />
leave the process alone. It does this by<br />
distinguishing between “common<br />
ca<strong>use</strong>” variation inherent to the process<br />
and “special ca<strong>use</strong>” variation due to<br />
some change in the process.
Interpreting <strong>Control</strong> <strong>Charts</strong><br />
• As long as all points lie inside the upper and<br />
lower control limits, the variation is presumed<br />
to be normal or common ca<strong>use</strong> variation.<br />
• When a data point falls outside those limits, it<br />
is termed an ‘out-<strong>of</strong>-control’ point and is<br />
considered to be due to ‘special ca<strong>use</strong>’<br />
variation. It indicates that it’s time to look at<br />
the process and figure out what might have<br />
ca<strong>use</strong>d the change.
Interpreting <strong>Control</strong> <strong>Charts</strong><br />
• An Out-<strong>of</strong>-<strong>Control</strong> point signifies that an<br />
investigation needs to be made to<br />
determine the ca<strong>use</strong>. Action should be<br />
taken to ensure that the process<br />
returns to a stable state.<br />
• <strong>The</strong> probability <strong>of</strong> a ‘false alarm’, a<br />
point lying outside the control limits due<br />
to random chance alone is set at 0.3%.
Problems <strong>with</strong> traditional <strong>Control</strong><br />
<strong>Charts</strong><br />
• <strong>Composite</strong>s require extensive testing.<br />
Creating and analyzing dozens <strong>of</strong> different<br />
control charts for each batch may not be the<br />
best approach.<br />
– It’s time consuming to create and interpret so<br />
many charts.<br />
– While each chart only has a small probability <strong>of</strong> a<br />
‘false alarm’, using many different charts can<br />
increase the probability <strong>of</strong> such ‘false alarms’ to<br />
unacceptable levels.
Multivariate <strong>Control</strong> <strong>Charts</strong><br />
• Different measurements can be combined into a single chart,<br />
eliminating the need for all those different charts and reducing<br />
the number <strong>of</strong> ‘false alarms’.<br />
40<br />
Multivariate <strong>Control</strong> Chart<br />
UCL = 27.48<br />
T-Squared<br />
30<br />
20<br />
10<br />
0<br />
0 10 20 30 40 50 60<br />
Subgroup
Why <strong>use</strong> a multivariate control<br />
chart?<br />
• It combines measurements from many<br />
different characteristics into one control chart<br />
• Correlated characteristics are handled<br />
appropriately. Changes that affect more than<br />
one characteristic will be noticed faster.<br />
• Only one chart is needed to make an initial<br />
assessment <strong>of</strong> whether the process is<br />
performing consistently or a change has<br />
occurred.
What type <strong>of</strong> Multivariate <strong>Charts</strong><br />
should be <strong>use</strong>d?<br />
Recommend the Hotelling T 2 control<br />
charts<br />
– <strong>Charts</strong> both subgroup means and variance<br />
(Only the means charts are being shown in this<br />
presentation)<br />
– Independence <strong>of</strong> variables is not required<br />
– Off the shelf s<strong>of</strong>tware is available<br />
Statgraphics was <strong>use</strong>d to create all charts<br />
shown in this presentation
<strong>Control</strong> <strong>Charts</strong> for <strong>Composite</strong>s<br />
40<br />
Multivariate <strong>Control</strong> Chart<br />
UCL = 27.48<br />
T-Squared<br />
30<br />
20<br />
10<br />
0<br />
0 10 20 30 40 50 60<br />
Subgroup<br />
This a T 2 control chart for 10 different tests combined together:<br />
– 90° ETW Compression − 90° RTD Compression<br />
– 90° ETW Tension − 90° RTD Tension<br />
– 0° ETW Compression − 0° RTD Compression<br />
– 0° ETW Tension − 0° RTD Tension<br />
– AI Shear ETW − AI Shear RTD
What does an Out-<strong>of</strong>-<strong>Control</strong> point<br />
signify on a multivariate chart?<br />
• <strong>The</strong> process has changed in some way<br />
• Find out which characteristic(s) was affected.<br />
– Use control ellipses for two or three variables at a<br />
time to identify the problem area.<br />
– Use traditional single variable control charts if<br />
appropriate<br />
• Develop a plan to correct the process based<br />
on what characteristics have been affected<br />
and what the suspected ca<strong>use</strong> is.
<strong>Control</strong> ellipses are <strong>use</strong>d to evaluate the joint<br />
variation <strong>of</strong> two or three variables. <strong>The</strong>se can<br />
be <strong>use</strong>d to identify problem areas.<br />
Tension Compression RTD<br />
135<br />
132<br />
129<br />
126<br />
123<br />
120<br />
<strong>Control</strong> Ellipse<br />
92 95 98 101 104 107 110<br />
Fill Compression RTD
Now that the problem area has been identified,<br />
a traditional X-bar chart shows the problem.<br />
X-bar Chart for Fill Compression RTD<br />
Strength<br />
107<br />
105<br />
103<br />
101<br />
99<br />
UCL = 105.52<br />
CTR = 100.72<br />
LCL = 95.91<br />
97<br />
95<br />
0 10 20 30 40 50<br />
Subgroup
Plotting the data against the Agate Acceptance<br />
Criteria show no problem <strong>with</strong> the material.<br />
Compression 90 RTD <strong>with</strong> Spec Limit<br />
Strength Values<br />
105<br />
103<br />
101<br />
99<br />
97<br />
95<br />
0 10 20 30 40 50<br />
Subgroup<br />
Spec Limit 95.78<br />
Nominal 100.68
Plotting the data against the Agate Acceptance<br />
Criteria show no problem <strong>with</strong> the material.<br />
Individual Values plotted <strong>with</strong> Spec Limit<br />
Compression Strength<br />
120<br />
110<br />
100<br />
90<br />
80<br />
0 10 20 30 40 50<br />
Subgroup<br />
Nominal: 100.68<br />
Spec Limit: 80.86
Advantages <strong>of</strong> <strong>Control</strong> <strong>Charts</strong><br />
• <strong>The</strong> acceptance limits are computed using AGATE method.<br />
• If the Coefficient <strong>of</strong> Variation is unrealistically low for the qualifying<br />
material, it may be adjusted according to the following guidelines<br />
approved by the FAA last year:<br />
– Below 4%, set at 6%<br />
– Between 4% and 8%, set to ½ * C.V.+ 4%<br />
• In this situation, since the co-efficient <strong>of</strong> variation was adjusted up<br />
from 5.05% for the spec limit, the out-<strong>of</strong> control point is still <strong>with</strong>in<br />
tolerance. Thus, the manufacturer can respond to the problem<br />
PRIOR to any out-<strong>of</strong>-spec product being produced.
Potential Difficulties <strong>with</strong><br />
Multivariate <strong>Control</strong> <strong>Charts</strong><br />
• <strong>The</strong> control chart does not identify which<br />
characteristic(s) have ca<strong>use</strong>d a point to fall outside<br />
the control limits. This must be assessed separately.<br />
• If more than one characteristic has contributed to a<br />
point being out-<strong>of</strong>-control, how should the process be<br />
adjusted and monitored to account for all<br />
characteristics affected?<br />
We will be investigating different approaches to<br />
deal <strong>with</strong> these issues.