The use of Control Charts with Composite materials
The use of Control Charts with Composite materials
The use of Control Charts with Composite materials
SHOW LESS

You also want an ePaper? Increase the reach of your titles
YUMPU automatically turns print PDFs into web optimized ePapers that Google loves.
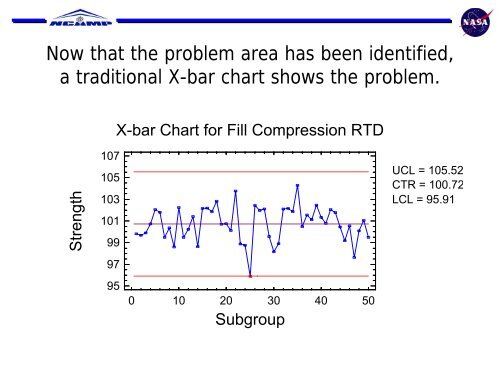
Now that the problem area has been identified,<br />
a traditional X-bar chart shows the problem.<br />
X-bar Chart for Fill Compression RTD<br />
Strength<br />
107<br />
105<br />
103<br />
101<br />
99<br />
UCL = 105.52<br />
CTR = 100.72<br />
LCL = 95.91<br />
97<br />
95<br />
0 10 20 30 40 50<br />
Subgroup