The use of Control Charts with Composite materials
The use of Control Charts with Composite materials
The use of Control Charts with Composite materials

Create successful ePaper yourself
Turn your PDF publications into a flip-book with our unique Google optimized e-Paper software.
<strong>Control</strong> <strong>Charts</strong> for <strong>Composite</strong>s<br />
40<br />
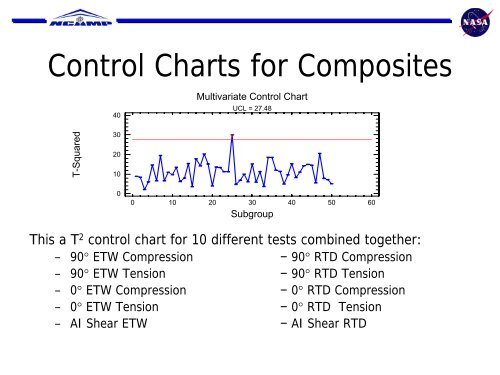
Multivariate <strong>Control</strong> Chart<br />
UCL = 27.48<br />
T-Squared<br />
30<br />
20<br />
10<br />
0<br />
0 10 20 30 40 50 60<br />
Subgroup<br />
This a T 2 control chart for 10 different tests combined together:<br />
– 90° ETW Compression − 90° RTD Compression<br />
– 90° ETW Tension − 90° RTD Tension<br />
– 0° ETW Compression − 0° RTD Compression<br />
– 0° ETW Tension − 0° RTD Tension<br />
– AI Shear ETW − AI Shear RTD