ethical equity fund - New Ireland Assurance
ethical equity fund - New Ireland Assurance
ethical equity fund - New Ireland Assurance

Create successful ePaper yourself
Turn your PDF publications into a flip-book with our unique Google optimized e-Paper software.
Image description.<br />
TRILOGY II<br />
At a glance<br />
Aim<br />
Style<br />
To generate long term capital growth with a sustainable flow of income for the<br />
<strong>fund</strong> by investing in three distinct asset classes (equities, bonds and<br />
property), and using borrowings to increase exposure to property.<br />
Actively Managed<br />
Asset Mix<br />
High Yield Equities, Corporate Bonds, Geared Property<br />
Managed By<br />
Number Of<br />
Stocks<br />
Total Fund Size<br />
Risk<br />
Bloxham<br />
47<br />
€148.0m<br />
High Risk<br />
Performance to 01 July 2011<br />
1 Month -1.6%<br />
3 Months -0.3%<br />
YTD -1.2%<br />
1 Year 5.3%<br />
3 Years -9.6% p.a.<br />
5 Years -9.1% p.a.<br />
10 Years -<br />
Image description.<br />
5 Line Year graph Performance with 1 line to and 01 1827 July 2011<br />
Y scale titled Scale label. points.<br />
Line 1, 1, Trilogy 01/07/2006 II S9.<br />
2, 02/07/2006 3, 03/07/2006 4, 04/07/2006 0%.<br />
5, 05/07/2006 0.3%.<br />
6, 06/07/2006 0.4%.<br />
7, 07/07/2006 0.1%.<br />
8, 08/07/2006 9, 09/07/2006 is 10, 10/07/2006 0.4%.<br />
11, 11/07/2006 0.4%.<br />
12, 12/07/2006 0.7%.<br />
13, 13/07/2006 0.4%.<br />
14, 14/07/2006 15, 15/07/2006 -0.3%.<br />
16, 16/07/2006 17, 17/07/2006 18, 18/07/2006 -0.8%.<br />
19, 19/07/2006 -1.2%.<br />
20, 20/07/2006 -0.7%.<br />
21, 21/07/2006 22, 22/07/2006 0.3%.<br />
23, 23/07/2006 24, 24/07/2006 25, 25/07/2006 0.8%.<br />
26, 26/07/2006 1.6%.<br />
27, 27/07/2006 1.5%.<br />
28, 28/07/2006 1.7%.<br />
29, 29/07/2006 2.1%.<br />
30, 30/07/2006 31, 31/07/2006 32, 01/08/2006 33, 02/08/2006 2.3%.<br />
34, 03/08/2006 2%.<br />
35, 04/08/2006 2.6%.<br />
36, 05/08/2006 2.3%.<br />
37, 06/08/2006 38, 07/08/2006 39, 08/08/2006 40, 09/08/2006 2.8%.<br />
41, 10/08/2006 2.4%.<br />
42, 11/08/2006 20%<br />
2.8%.<br />
43, 12/08/2006 2.3%.<br />
44, 13/08/2006 45, 14/08/2006 46, 15/08/2006 2.4%.<br />
47, 16/08/2006 2.9%.<br />
48, 17/08/2006 3.3%.<br />
49, 18/08/2006 3.4%.<br />
50, 19/08/2006 3.5%.<br />
51, 20/08/2006 52, 21/08/2006 53, 22/08/2006 3.4%.<br />
54, 23/08/2006 3.3%.<br />
55, 24/08/2006 3.9%.<br />
56, 25/08/2006 57, 26/08/2006 3.8%.<br />
58, 27/08/2006 59, 28/08/2006 60, 29/08/2006 3.9%.<br />
61, 30/08/2006 4.1%.<br />
62, 31/08/2006 4.4%.<br />
63, 01/09/2006 4.7%.<br />
64, 02/09/2006 4.5%.<br />
65, 03/09/2006 66, 04/09/2006 67, 05/09/2006 68, 06/09/2006 4.9%. 0%<br />
69, 07/09/2006 4.7%.<br />
70, 08/09/2006 4.2%.<br />
71, 09/09/2006 3.7%.<br />
72, 10/09/2006 73, 11/09/2006 74, 12/09/2006 4.3%.<br />
75, 13/09/2006 4.1%.<br />
76, 14/09/2006 5%.<br />
77, 15/09/2006 5.3%.<br />
78, 16/09/2006 79, 17/09/2006 80, 18/09/2006 81, 19/09/2006 82, 20/09/2006 5.4%.<br />
83, 21/09/2006 5.3%.<br />
84, 22/09/2006 5.8%.<br />
85, 23/09/2006 6%.<br />
86, 24/09/2006 87, 25/09/2006 88, 26/09/2006 6.1%.<br />
89, 27/09/2006 6.4%.<br />
90, 28/09/2006 91, 29/09/2006 -20%<br />
6.9%.<br />
92, 30/09/2006 6.8%.<br />
93, 01/10/2006 94, 02/10/2006 95, 03/10/2006 7%.<br />
96, 04/10/2006 6.8%.<br />
97, 05/10/2006 6.7%.<br />
98, 06/10/2006 7.4%.<br />
99, 07/10/2006 is 7.5%.<br />
100, 08/10/2006 8%.<br />
101, 09/10/2006 102, 10/10/2006 8%.<br />
103, 11/10/2006 7.9%.<br />
104, 12/10/2006 8.1%.<br />
105, 13/10/2006 8%.<br />
106, 14/10/2006 8.5%.<br />
107, 15/10/2006 108, 16/10/2006 109, 17/10/2006 8.7%.<br />
110, 18/10/2006 8.9%.<br />
111, 19/10/2006 8.3%.<br />
112, 20/10/2006 8.8%.<br />
113, 21/10/2006 8.5%.<br />
114, 22/10/2006 115, 23/10/2006 116, 24/10/2006 8.7%.<br />
117, 25/10/2006<br />
-40%<br />
8.9%.<br />
118, 26/10/2006 119, 27/10/2006 9.1%.<br />
120, 28/10/2006 8.9%.<br />
121, 29/10/2006 122, 30/10/2006 123, 31/10/2006 124, 01/11/2006 8.5%.<br />
125, 02/11/2006 8.7%.<br />
126, 03/11/2006 8.9%.<br />
127, 04/11/2006 128, 05/11/2006 129, 06/11/2006 130, 07/11/2006 9.6%.<br />
131, 08/11/2006 10.1%.<br />
132, 09/11/2006 10.2%.<br />
133, 10/11/2006 10.4%.<br />
134, 11/11/2006 10.2%.<br />
135, 12/11/2006 136, 13/11/2006 137, 14/11/2006 10.1%.<br />
138, 15/11/2006 10.2%.<br />
139, 16/11/2006 10%.<br />
140, 17/11/2006 10.1%.<br />
141, 18/11/2006<br />
-60%<br />
10.3%.<br />
142, 19/11/2006 143, 20/11/2006 144, 21/11/2006 10.1%.<br />
145, 22/11/2006 146, 23/11/2006 10.2%.<br />
147, 24/11/2006 10.1%.<br />
148, 25/11/2006 10%.<br />
149, 26/11/2006 150, 27/11/2006 151, 28/11/2006 9.5%.<br />
152, 29/11/2006 8.6%.<br />
153, 30/11/2006 8.5%.<br />
154, 01/12/2006 10%.<br />
155, 02/12/2006 9.8%.<br />
156, 03/12/2006 157, 04/12/2006 158, 05/12/2006 9.6%.<br />
159, 06/12/2006 9.7%.<br />
160, 07/12/2006 10%.<br />
161, 08/12/2006 10.1%.<br />
162, 09/12/2006 10.3%.<br />
163, 10/12/2006 164, 11/12/2006 165, 12/12/2006 10.5%.<br />
166, 13/12/2006 10.8%.<br />
167, 14/12/2006 11.1%.<br />
168, 15/12/2006 11.3%.<br />
169, 16/12/2006 11.7%.<br />
170, 17/12/2006 171, 18/12/2006 172, 19/12/2006 12.1%.<br />
173, 20/12/2006 12.3%.<br />
174, 21/12/2006 12%.<br />
175, 22/12/2006 176, 23/12/2006 13.7%.<br />
177, 24/12/2006 178, 25/12/2006 179, 26/12/2006 180, 27/12/2006 181, 28/12/2006 182, 29/12/2006 183, 30/12/2006 13.8%.<br />
184, 31/12/2006 185, 01/01/2007 186, 02/01/2007 187, 03/01/2007 13.5%.<br />
188, 04/01/2007 14.3%.<br />
189, 05/01/2007 190, 06/01/2007 14.4%.<br />
191, 07/01/2007 192, 08/01/2007 193, 09/01/2007 14.1%.<br />
Point 194, 10/01/2007 is 14%. 14.3%.<br />
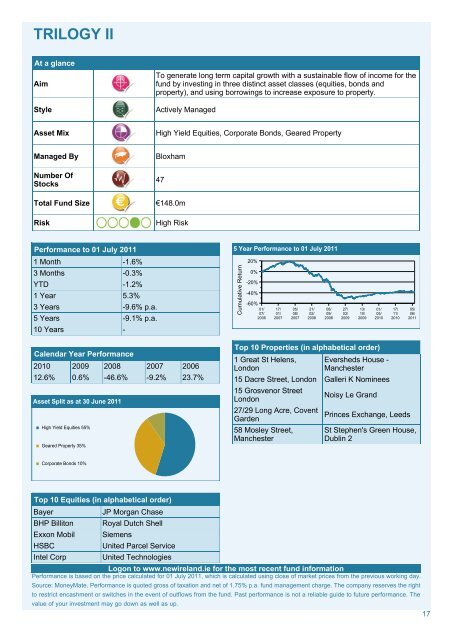
5 Year Performance to 01 July 2011<br />
Cumulative Return<br />
01/<br />
07/<br />
2006<br />
17/<br />
01/<br />
2007<br />
05/<br />
08/<br />
2007<br />
21/<br />
02/<br />
2008<br />
08/<br />
09/<br />
2008<br />
27/<br />
03/<br />
2009<br />
13/<br />
10/<br />
2009<br />
01/<br />
05/<br />
2010<br />
17/<br />
11/<br />
2010<br />
05/<br />
06/<br />
2011<br />
Calendar Year Performance<br />
2010 2009 2008 2007 2006<br />
12.6% 0.6% -46.6% -9.2% 23.7%<br />
Asset Pie chart Split with as 3 at items. 30 June 2011<br />
1, 2, High Geared Yield Property Equities 35% 55% 35. 55.<br />
Item 3, Corporate Bonds 10% 10.<br />
End of image description.<br />
Asset Split as at 30 June 2011<br />
High Yield Equities 55%<br />
Geared Property 35%<br />
Top 10 Properties (in alphabetical order)<br />
1 Great St Helens,<br />
London<br />
Eversheds House -<br />
Manchester<br />
15 Dacre Street, London Galleri K Nominees<br />
15 Grosvenor Street<br />
London<br />
27/29 Long Acre, Covent<br />
Garden<br />
58 Mosley Street,<br />
Manchester<br />
Noisy Le Grand<br />
Princes Exchange, Leeds<br />
St Stephen's Green House,<br />
Dublin 2<br />
Corporate Bonds 10%<br />
Top 10 Equities (in alphabetical order)<br />
Bayer<br />
BHP Billiton<br />
Exxon Mobil<br />
HSBC<br />
Intel Corp<br />
JP Morgan Chase<br />
Royal Dutch Shell<br />
Siemens<br />
United Parcel Service<br />
United Technologies<br />
Logon to www.newireland.ie for the most recent <strong>fund</strong> information<br />
Performance is based on the price calculated for 01 July 2011, which is calculated using close of market prices from the previous working day.<br />
Source: MoneyMate. Performance is quoted gross of taxation and net of 1.75% p.a. <strong>fund</strong> management charge. The company reserves the right<br />
to restrict encashment or switches in the event of outflows from the <strong>fund</strong>. Past performance is not a reliable guide to future performance. The<br />
value of your investment may go down as well as up.<br />
17