ethical equity fund - New Ireland Assurance
ethical equity fund - New Ireland Assurance
ethical equity fund - New Ireland Assurance

You also want an ePaper? Increase the reach of your titles
YUMPU automatically turns print PDFs into web optimized ePapers that Google loves.
Image description.<br />
INDEX FUNDS Managed By SSgA<br />
Index <strong>fund</strong>s offer you a unique opportunity to participate in up to five of the world's major stock market indices. The<br />
key difference from traditional managed <strong>fund</strong>s is that their objective is to track the performance of stock market<br />
indices, rather than to outperform using stock selection research. This is known as passive management.<br />
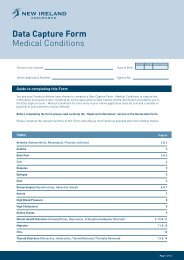
Eurostoxx 50 Fund<br />
Sector Split as at 30 June 2011<br />
Sector Pie chart Split with as 7 at items. 30 June 2011<br />
1, 2, Financials Consumer 29% Goods 29.<br />
3, Other 16% 16. 16% 16.<br />
4, 5, IT Industrials 12% 12.<br />
6, Energy 9% 11% 9. 11.<br />
Item 7, Health Care 7% 7.<br />
End of image description.<br />
Financials 29%<br />
Consumer Goods 16%<br />
Other 16%<br />
IT 12%<br />
Industrials 11%<br />
Energy 9%<br />
Health Care 7%<br />
Top 5 Stocks (in alphabetical<br />
order)<br />
Daimler<br />
Sanofi<br />
Siemens<br />
Telefonica<br />
Total<br />
Performance to 01 July 2011<br />
1 Month -0.4%<br />
3 Months -0.1%<br />
YTD 4.3%<br />
1 Year 13.7%<br />
3 Years -2.5% p.a.<br />
5 Years -2.4% p.a.<br />
S&P 500 Fund<br />
Image description.<br />
Sector Pie chart Split with as 7 at items. 30 June 2011<br />
1, 2, IT Consumer 21% 21.<br />
3, Financials 15% Goods 15. 21% 21.<br />
4, 5, Energy Health Care 13% 12% 13.<br />
6, Industrials 11% 11. 12.<br />
Item 7, Other 7% 7.<br />
End of image description.<br />
Sector Split as at 30 June 2011<br />
IT 21%<br />
Consumer Goods 21%<br />
Financials 15%<br />
Energy 13%<br />
Health Care 12%<br />
Industrials 11%<br />
Other 7%<br />
Top 5 Stocks (in alphabetical<br />
order)<br />
Apple<br />
Chevron<br />
Exxon Mobil<br />
General Electric<br />
International Business Machines<br />
Performance to 01 July 2011<br />
1 Month -2.6%<br />
3 Months -2.4%<br />
YTD -2.7%<br />
1 Year 8.8%<br />
3 Years 4.5% p.a.<br />
5 Years -1.3% p.a.<br />
Nikkei 225 Fund<br />
Image description.<br />
Sector Pie chart Split with as 7 at items. 30 June 2011<br />
1, 2, Consumer IT 25% 25. Goods 26% 26.<br />
3, 4, Industrials Health Care 25% 9% 25.<br />
5, Other 8% 8. 9.<br />
Item 6, 7, Financials Energy 1% 6% 1. 6.<br />
End of image description.<br />
Sector Split as at 30 June 2011<br />
Consumer Goods 26%<br />
IT 25%<br />
Industrials 25%<br />
Health Care 9%<br />
Other 8%<br />
Financials 6%<br />
Energy 1%<br />
Top 5 Stocks (in alphabetical<br />
order)<br />
Fanuc<br />
Fast Retailing<br />
Honda Motor<br />
Kyocera<br />
Softbank<br />
Performance to 01 July 2011<br />
1 Month 0.9%<br />
3 Months 0.7%<br />
YTD -10.6%<br />
1 Year -3.1%<br />
3 Years 0.9% p.a.<br />
5 Years -5.2% p.a.<br />
FTSE 100 Fund<br />
Image description.<br />
Sector Pie chart Split with as 7 at items. 30 June 2011<br />
1, 2, Consumer Financials 20% Goods 20. 21% 21.<br />
3, 4, Energy Other 19% 20% 19. 20.<br />
5, 6, Health IT 8% 8. Care 8% 8.<br />
Item 7, Industrials 4% 4.<br />
End of image description.<br />
Sector Split as at 30 June 2011<br />
Consumer Goods 21%<br />
Financials 20%<br />
Energy 20%<br />
Other 19%<br />
Health Care 8%<br />
IT 8%<br />
Industrials 4%<br />
Top 5 Stocks (in alphabetical<br />
order)<br />
BP<br />
GlaxoSmithKline<br />
HSBC<br />
Royal Dutch Shell<br />
Vodafone<br />
Performance to 01 July 2011<br />
1 Month -3.8%<br />
3 Months -1.3%<br />
YTD -4.2%<br />
1 Year 11.1%<br />
3 Years -0.5% p.a.<br />
5 Years -2.8% p.a.<br />
Nasdaq 100 Fund<br />
Image description.<br />
Sector Pie chart Split with as 5 at items. 30 June 2011<br />
1, 2, IT Consumer 62% 62.<br />
3, Health Care Goods 10% 10. 19% 19.<br />
Item 4, 5, Other Industrials 6% 6. 3% 3.<br />
End of image description.<br />
Sector Split as at 30 June 2011<br />
IT 62%<br />
Consumer Goods 19%<br />
Health Care 10%<br />
Other 6%<br />
Industrials 3%<br />
Top 5 Stocks (in alphabetical<br />
order)<br />
Apple<br />
Google<br />
Intel<br />
Microsoft<br />
Oracle<br />
Performance to 01 July 2011<br />
1 Month -2.8%<br />
3 Months -2.8%<br />
YTD -3.0%<br />
1 Year 12.7%<br />
3 Years 10.6% p.a.<br />
5 Years 4.6% p.a.<br />
Logon to www.newireland.ie for the most recent <strong>fund</strong> information<br />
Performance is based on the price calculated for 01 July 2011, which is calculated using close of market prices from the previous working day.<br />
Source: MoneyMate. Performance is quoted gross of taxation and net of 1.5% p.a. <strong>fund</strong> management charges. Past performance is not a<br />
reliable guide to future performance. The value of your investment may go down as well as up.<br />
29