Randburg - Johannesburg Development Agency
Randburg - Johannesburg Development Agency
Randburg - Johannesburg Development Agency

You also want an ePaper? Increase the reach of your titles
YUMPU automatically turns print PDFs into web optimized ePapers that Google loves.
<strong>Randburg</strong> CBD Performance Survey 2006<br />
Prepared for the JDA by<br />
Martin Wessels<br />
Independent Consultant
1<br />
Executive Summary<br />
The City of <strong>Johannesburg</strong> has adopted a revitalisation project for the <strong>Randburg</strong> CBD to<br />
re-establish <strong>Randburg</strong> as an important business, cultural and entertainment destination in<br />
the metropolitan region. This report continues on the baseline data for the <strong>Randburg</strong> CBD<br />
collected in the previous years and measures the achievements of the JDA relative to the<br />
indicators and targets that have been set.<br />
• Property: Vacancy rates in <strong>Randburg</strong> showed a rapidly rising trend since the end<br />
of 1999. The results over the past year are very encouraging as it shows a<br />
continuous decrease in vacancy rates. Over the course of 2005 vacancy rates have<br />
steadily declined and by the end of 2005, A grade vacancies were down from<br />
17.5% to 6.8%. B grade vacancies showed a good decline through 2005 but rose<br />
to 13.3% in the last quarter.<br />
As regards building plans ~ no satisfactory data on building plans has been<br />
received for 2004 or 2005<br />
• RSC levies in the <strong>Randburg</strong> CBD (proxy area of Ferndale) have shown a<br />
continuous rise since 2002 and stabilized in 2004. In 2005 we have seen turnover<br />
decline by 14% and salaries by 19%. These figures do not align with other results<br />
seen in the 2006 report and we are once again faced with very unstable RSC data<br />
and apparent collection problems exacerbated by the phasing out of RSC levies.
2<br />
• The overall satisfaction of stakeholders in the <strong>Randburg</strong> CBD based on our<br />
business survey for the year 2006 is 53.3 much in line with 53.4 in 2005 - this<br />
represents an increase of 11.5% on the baseline set in 2004.<br />
• Satisfaction of stakeholders regarding cleanliness of <strong>Randburg</strong> – a 5% p.a target<br />
was set in 2004. Stakeholders were asked about the following statement: ‘Over<br />
the past year I have noticed an improvement in the cleanliness of <strong>Randburg</strong>: 22%<br />
agreed, 26% were neutral and the rest disagreed. It scored a 41.4 on the scale<br />
(down from 44.8 in 2005) but still up compared to 39.8 in 2004.<br />
• Crime: We report two sets of indicators for this category, namely subjective<br />
perception based on our survey and objective data released by the SAPS. On the<br />
crime index, respondents were asked the following question: Over the past year I<br />
have noticed a decline in the crime rate in <strong>Randburg</strong>: almost 70% disagreed and<br />
only 13.6% agreed with this statement. It scored 31.8 on the scale down from 32.9<br />
in 2005.<br />
However, when we examine actual crime data for the area as released by the<br />
SAPS we in fact see that crime has declined. Crime has decreased in the area from<br />
7,119 in 2003 to 6,765 in 2004 and 6,050 in 2005 - a decline in crime incidents of<br />
5% in 2004 and 10% in 2005.
3<br />
• Customer satisfaction and awareness of the JDA. There has been a remarkable<br />
turnaround in awareness of the initiatives to establish Improvement Districts in the<br />
<strong>Randburg</strong> CBD area. In 2004 only 39% were aware of these improvement districts, in<br />
2005 it was 68% and this year it rose to 86%. 90% thought that these improvements<br />
districts would make a real positive difference to the <strong>Randburg</strong> CBD environment –<br />
up from 73% in 2004. 80% of respondents had heard of the <strong>Johannesburg</strong><br />
<strong>Development</strong> <strong>Agency</strong> – up from only 45% in 2004 and 61% in 2005. Our JDA proxy<br />
scored 50 on the index for <strong>Randburg</strong> in 2004, 63.7 in 2005 and significantly 87.5 in<br />
2006.
4<br />
• INTRODUCTION<br />
As has been the trend with most CBD’s in South Africa the <strong>Randburg</strong> CBD has been in<br />
steady decline over the past few years. This can be attributed to the mushrooming of new<br />
business and retail districts all over <strong>Johannesburg</strong>. These new districts have drawn<br />
customers away from the CBD. This migration has lead to the <strong>Randburg</strong> CBD suffering<br />
from neglect and underinvestment and this has become very visible.<br />
To address the problems just mentioned the City of <strong>Johannesburg</strong> has started a<br />
revitalisation project for the area. The vision is to ensure that <strong>Randburg</strong> becomes a safe,<br />
clean, attractive and user-friendly CBD that re-establishes <strong>Randburg</strong> as a premier<br />
business, cultural and entertainment destination in the metropolitan region. The broad<br />
goals of the project are as follows:<br />
• To make the <strong>Randburg</strong> CBD safe, clean, attractive and user-friendly by providing<br />
a range of enhanced management services<br />
• To improve the economic well-being of <strong>Randburg</strong><br />
• To facilitate public and private investment in the <strong>Randburg</strong> CBD<br />
• To market and promote the assets of the <strong>Randburg</strong> CBD and the services of the<br />
Improvement District<br />
This report builds on the baseline data developed in previous reports for the <strong>Randburg</strong><br />
CBD upon which performance targets will be based. The actual survey was conducted on<br />
businesses in the area during April 2006.
5<br />
2. RANDBURG CBD TREND DATA<br />
2.1 Proxy for Shoppers in <strong>Randburg</strong><br />
An important dimension of the <strong>Randburg</strong> CBD revitalisation programme is an attempt to<br />
enhance its status as a major shopping node. There are a number of proxies that we can<br />
use to monitor the growth in the number of shoppers in the area. We could not get<br />
turnover figures for the major shopping destination in the <strong>Randburg</strong> CBD, namely the<br />
Sanlam Centre. However, they were willing to provide us with data on the number of<br />
parkers in their paid park area which is a viable proxy for shopping activity. The table<br />
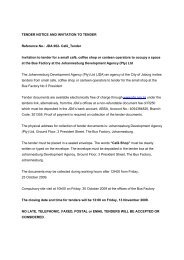
below provides the data on the number of parkers in the Sanlam Centre. The figure<br />
presents the average number of monthly parkers for 2004 and 2005 and shows a declining<br />
trend in casual parking. Unfortunately these parking statistics could be misleading as this<br />
might hide a change in shoppers from a higher to lower socio-economic group. What has<br />
happened in many CBD’s is that retailers that cater to the lower economic groups have<br />
formed clusters in the CBD. The reason being that the public transport infrastructure is<br />
normally well developed in the CBD, with access to buses and taxi ranks. So the Sanlam<br />
centre may merely have transformed itself to cater to a different socio-economic group.
6<br />
Parking in the Sanlam Centre<br />
Sanlam Centre <strong>Randburg</strong> – Parking Trends<br />
Month Number of Casual Parkers Number of Monthly Parkers<br />
May 02 60087 434<br />
June 02 49890 440<br />
July 02 58046 439<br />
August 02 53600 438<br />
Sept 02 52078 442<br />
Oct 02 61401 432<br />
Nov 02 55717 428<br />
Dec 02 54821 429<br />
Jan 03 58082 429<br />
Feb 03 54970 436<br />
March 03 54272 434<br />
April 03 51365 435<br />
May 03 58786 434<br />
June 03 52333 415<br />
July 03 58737 421<br />
Aug 03 66408 422<br />
Sept 03 64855 413<br />
Oct 03 67662 413<br />
Nov 03 60040 411<br />
Dec 03 61270 418<br />
Jan 04 59666 419<br />
Feb 04 56551 416<br />
March 64480 409<br />
April 04 59079 350<br />
May 04 66574 345<br />
June 04 64251 341<br />
July 04 65938 344<br />
Aug 04 64400 340<br />
Sept 04 64562 330<br />
Oct 04 63259 321<br />
Nov 04 65837 322<br />
Dec 04 62351 318<br />
Jan05 60364 317<br />
Feb05 59043 315<br />
Mar05 61717 308<br />
April 05 60931 306<br />
May 05 60393 310<br />
June 05 58730 312<br />
July 05 58501 115<br />
Aug 05 59507 194<br />
Sept 05 56442 195
7<br />
Oct 05 52613 195<br />
Nov 05 55710 191<br />
Dec 05 50534 189<br />
Average monthly casual parkers in the Sanlam Centre<br />
64000<br />
63079<br />
63000<br />
62000<br />
61000<br />
60000<br />
59000<br />
58000<br />
59065<br />
57894<br />
57000<br />
56000<br />
55000<br />
2003 2004 2005
8<br />
2.2 Property<br />
The <strong>Randburg</strong> area is a significant contributor to the office market in <strong>Johannesburg</strong>.<br />
SAPOA’s figures show that it has 366,634 m 2 of rentable A and B grade area and a<br />
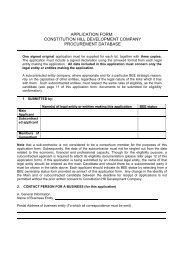
further 136,236 m 2 of C grade property. Vacancy rates (A&B) in <strong>Randburg</strong> have shown a<br />
rapidly rising trend since the end of 1999. For example, A grade property vacancy rates<br />
rose from 3.6% in August 1999 to 23.6% by December 2003. B grade property rose from<br />
5.8% in August 1999 to 24.9% by mid 2003. Partly as a result of these trends, the JDA<br />
has intervened and established a City Improvement District in the area.<br />
The encouraging improvement that we saw in 2004 has continued through 2005. Over the<br />
course of 2005 vacancy rates have continued to fall dramatically. At the end of 2005 A<br />
grade vacancies were down from 17.5% to 6.8%. B grade vacancies showed a good<br />
decline through 2005 but rose to 13.3% in the last quarter. Such a sudden surge can often<br />
be attributed to a tenant vacating a large premise in the quarter. Even with this surge the<br />
vacancy rates for B grade property was still below 2004 highs.<br />
Gross asking median rentals for A grade properties in <strong>Randburg</strong> remained stable at a<br />
mean of R45 m 2 and likewise B grade property remained constant at R35 m 2 during the<br />
past two years.<br />
The table below illustrates the falling vacancy rates in the <strong>Randburg</strong> area over the course<br />
of the past 2 years.
9<br />
SAPOA Vacancy Rates (%) A&B Property in <strong>Randburg</strong><br />
Date of Survey Vacancy Rates A Vacancy Rates B<br />
Feb-97 3.9 11.3<br />
May-97 5.7 11.7<br />
Aug-97 4.2 14.2<br />
Nov-97 4.7 15.1<br />
Feb-98 5.4 15.1<br />
May-98 4.7 13.2<br />
Aug-99 3.6 5.8<br />
Dec-99 3.6 5.8<br />
Mar-00 5.4 7.2<br />
Jun-00 8.3 7.9<br />
Sep-00 8.2 7.7<br />
Dec-00 12.3 12.7<br />
Mar-01 12.2 7.3<br />
Jun-01 13.2 8.2<br />
Sep-01 10.8 11.4<br />
Dec-01 11.6 14<br />
Mar-02 12.2 15.4<br />
Jun-02 10.9 15.2<br />
Sep-02 10.3 20.4<br />
Dec-02 11.5 22.8<br />
Mar-03 17 24.9<br />
Jun-03 17.2 24.9<br />
Sep-03 22 18.8<br />
Dec-03 23.6 14.8<br />
Mar-04 21.1 13.7<br />
Jun-04 20.6 12.9<br />
Sep-04 19.7 13.7<br />
Dec-04 17.5 10.7<br />
Mar-05 13.0 8.8<br />
Jun-05 13 8.8<br />
Sept-05 10 8.9<br />
Dec-05 6.8 13.3
10<br />
The figure below graphically illustrates the continued improving vacancy trends for A<br />
and B grade property in <strong>Randburg</strong>.<br />
Vacancy Rates in <strong>Randburg</strong> 1996-2005<br />
30<br />
25<br />
Vacany Rates (%)<br />
20<br />
15<br />
10<br />
5<br />
0<br />
Feb-97<br />
May-97<br />
Aug-97<br />
Nov-97<br />
Feb-98<br />
May-98<br />
Aug-98<br />
Nov-98<br />
Feb-99<br />
May-99<br />
Aug-99<br />
Nov-99<br />
Feb-00<br />
May-00<br />
Aug-00<br />
Nov-00<br />
Feb-01<br />
Vacancy Rates A-<strong>Randburg</strong><br />
May-01<br />
Date of Survey<br />
Aug-01<br />
Nov-01<br />
Feb-02<br />
May-02<br />
Aug-02<br />
Nov-02<br />
Feb-03<br />
Vacancy Rates B-Ranburg<br />
May-03<br />
Aug-03<br />
Nov-03<br />
Feb-04<br />
May-04<br />
Aug-04<br />
Nov-04<br />
Feb-05<br />
May-05<br />
Aug-05<br />
Nov-05
11<br />
2.3 Building Plans<br />
As regards building plans ~ no satisfactory data on building plans has been received for<br />
2004 or 2005.<br />
2.4 RSC Levies<br />
The table below presents the data for the RSC (Regional Services Council) levies for<br />
<strong>Randburg</strong>. The data is important as these taxes are levied upon business turnover and<br />
their salary expenditure. As a result it gives an indication of trends as regards business<br />
activity and employment levels in the <strong>Randburg</strong> CBD. It should be cautioned, however,<br />
that RSC levies are notoriously volatile. Nevertheless, it remains a useful guide.<br />
We used Ferndale as our proxy for the <strong>Randburg</strong> CBD given that this area covers the<br />
bulk of the business activity that is being targeted. RSC levies on both turnover and<br />
salaries show a steadily rising trend between 2001 and 2003 and stabilising in 2004. In<br />
2005 the trend reversed and turnover declined by 14% to R5,899,057 and salaries by 19%<br />
to R2,508,070.<br />
RSC Levies 2002 - 2005 for the <strong>Randburg</strong> CBD<br />
Turnover Salaries Turnover Salaries Turnover Salaries Turnover Salaries<br />
2005 2004 2003 2002<br />
5,899,057 2,508,070 6,841,955 3,102,169 6,697,565 3,472,385 5,599,271 2,899,623
12<br />
The figures below present the RSC levies based on turnover and salaries for Ferndale<br />
between 2001 and 2005.<br />
RSC Levies in <strong>Randburg</strong> 2002-2005 based on turnover<br />
7,000,000<br />
6,000,000<br />
5,000,000<br />
R<br />
4,000,000<br />
3,000,000<br />
2,000,000<br />
1,000,000<br />
0<br />
2005 2004 2003 2002<br />
RSC Levies in <strong>Randburg</strong> 2002-2005 based on salaries<br />
3,500,000<br />
3,000,000<br />
2,500,000<br />
R<br />
2,000,000<br />
1,500,000<br />
1,000,000<br />
500,000<br />
0<br />
2005 2004 2003 2002
13<br />
2.5 Crime statistics<br />
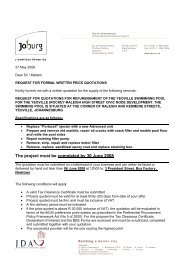
The latest SAPS statistics are very encouraging as they show a steady decline in overall<br />
crime in the <strong>Randburg</strong> area. Crime statistics reported at the <strong>Randburg</strong> police station show<br />
crime falling to 6,050 reported cases. This is just over a 10% improvement on 2004 and<br />
considerably down on 2001 when 7,398 cases were reported.<br />
(Note however, that Douglasdale was ceded from the area in August 1999 and hence the<br />
sharp fall between 2000 and 2001.)<br />
Crime Statistics: <strong>Randburg</strong> 1994-2005<br />
Crime Category<br />
April to March<br />
94/95 95/96 96/97 97/98 98/99 99/00 00/01 01/02 02/03 03/04 04/20<br />
Murder 38 44 35 29 38 27 10 9 11 10 11<br />
Rape 103 74 87 74 63 78 43 39 42 25 21<br />
Attempted murder 59 48 52 39 20 25 20 19 27 26 27<br />
Assault with the intent to<br />
inflict grievous bodily<br />
harm 257 224 260 277 258 228 138 142 167 195 140<br />
Common assault 557 535 456 504 505 311 211 224 257 226 231<br />
Robbery with aggravating<br />
circumstances 490 487 446 657 645 600 446 480 549 599 481<br />
Common robbery 98 150 170 165 259 192 163 193 165 223 267<br />
Indecent assault 8 16 20 7 7 7 7 8 5 4 9<br />
Kidnapping 11 7 11 10 7 15 12 4 1 3 1<br />
Abduction 4 3 3 9 2 4 4 1 6 4 7<br />
Neglect and ill-treatment<br />
of children 3 4 2 5 3 6 1 1 5 4 6<br />
Culpable homicide 45 53 39 75 39 30 18 23 13 18 10<br />
Public violence 2 3 6 12 1 8 2 0 2 3 6<br />
Carjacking (Sub Category<br />
of Robbery Aggravating) - - 106 171 94 90 69 68 46 72 82<br />
Truck hijacking (Sub<br />
Category of Robbery<br />
Aggravating) - - 38 50 36 58 13 19 0 2 1
14<br />
Bank robbery (Sub<br />
Category of Robbery<br />
Aggravating) - - 6 2 11 8 8 1 2 1 5<br />
Robbery of cash in transit<br />
(Sub Category of Robbery<br />
Aggravating) - - 1 1 0 1 4 0 3 2 0<br />
House robbery (Sub<br />
Category of Robbery<br />
Aggravating) - - - - - - - - 61 42 59<br />
Business robbery (Sub<br />
Category of Robbery<br />
Aggravating) - - - - - - - - 75 31 41<br />
Arson 24 13 15 12 15 15 3 6 4 6 5<br />
Malicious damage to<br />
property 611 563 532 639 706 703 452 375 377 422 421<br />
Crimen Injuria 70 47 59 70 50 33 41 45 64 49 39<br />
Burglary at residential<br />
premises 2,759 2,686 2,468 2,608 2,075 1,199 646 701 675 594 566<br />
Burglary at business<br />
premises 209 153 159 229 193 235 297 324 210 219 167<br />
Theft of motor vehicle<br />
and motorcycle 1,384 989 1,077 1,275 1,412 1,042 644 580 493 505 480<br />
Theft out of or from motor<br />
vehicle 1,879 1,454 1,239 1,314 1,487 1,383 862 730 745 495 408<br />
Stock theft 5 6 4 3 2 0 0 0 0 0 0<br />
Illegal possession of<br />
firearms and ammunition 16 13 16 10 16 7 6 8 12 13 9<br />
Drug related crime 53 37 68 28 28 59 51 144 107 103 53<br />
Driving under the<br />
influence of alcohol or<br />
drugs 57 44 77 72 32 16 19 12 16 13 29<br />
All theft not mentioned<br />
elsewhere 2,026 2,177 2,068 2,563 3,669 3,911 2,414 2,109 2,253 2,181 1828<br />
Commercial Crime 481 433 567 707 725 761 626 478 489 490 464<br />
Shoplifting 345 361 353 456 425 256 168 202 237 185 176<br />
TOTAL 11,594 10,624 10,440 12,073 12,823 11,308 7,398 6,945 7,119 6,765 6,050
15<br />
Crime statistics <strong>Randburg</strong> 1994-2005<br />
14,000<br />
12,000<br />
10,000<br />
8,000<br />
6,000<br />
4,000<br />
2,000<br />
0<br />
1994/1995 1995/1996 1996/1997 1997/1998 1998/1999 1999/2000 2000/2001 2001/2002 2002/2003 2003/2004 2004/2005
16<br />
3. <strong>Randburg</strong> Survey<br />
Objective: This section presents the results from a survey that was conducted on<br />
businesses operating in the <strong>Randburg</strong> CBD. The purpose of the research was to gain an<br />
understanding of perceptions of the <strong>Randburg</strong> CBD by businesses operating in the area.<br />
This was done in an effort to monitor the perceived success of the JDA’s interventions in<br />
the study area.<br />
Methodology: The survey was conducted during April 2006. Trained students were sent<br />
out to designated areas within the <strong>Randburg</strong> CBD to administer the questionnaires. Over<br />
80 questionnaires were completed in this manner. The data from the surveys was then<br />
captured and analysed.<br />
Limitations of methodology:<br />
• Whilst every effort was made to ensure that the questionnaire was completed by<br />
the intended person (Senior Manager or Owner), in a few questionnaires it may<br />
have been completed by a less informed person.<br />
• The respondents may not always have given the survey the necessary effort and<br />
attention that it required which may have led to some poor responses.<br />
• Convenient sampling has some shortcomings in terms of representativity.
17<br />
• The <strong>Randburg</strong> CBD was defined in this study as the proposed City Improvement<br />
District zone in <strong>Randburg</strong>. The area is bounded by the following roads:<br />
o Selkirk and Harley in the South<br />
o Dover Street in the North<br />
o Kent Street in the West<br />
o Bourdeaux Street in the East
18<br />
3.1 Business Confidence<br />
The first part of the questionnaire develops a business confidence index for the <strong>Randburg</strong><br />
CBD as per the methodology that has been employed in the <strong>Johannesburg</strong> Inner City<br />
since 2002. The <strong>Randburg</strong> 2006 results are compared with those for 2005 and are<br />
juxtaposed with other areas in <strong>Johannesburg</strong> where relevant.<br />
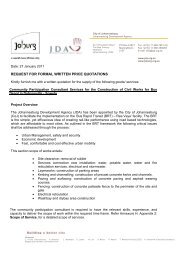
The overall index score for the year 2006 in the <strong>Randburg</strong> CBD is 53.3 much in line with<br />
53.4 in 2005. This still represents an increase of 11.4% over 2004<br />
The responses to the following questions were as follows:<br />
• Over the past year I have noticed an improvement in the management of the<br />
<strong>Randburg</strong> CBD: 25.9% agreed (35% agreed in 2005), and 15% were neutral. It<br />
scored a 42.3 on the scale compared to 46.8 in 2005.<br />
• Over the past year I have noticed an improvement in the cleanliness of the<br />
<strong>Randburg</strong> CBD: 22.2% agreed (compared to 31% in 2005), 26% were neutral and<br />
the rest disagreed. It scored a 41.4 on the scale compared to 44.8 in 2005.<br />
• Over the past year I have noticed an improvement in the orderliness of the<br />
<strong>Randburg</strong> CBD: 27.2 % (44% in 2005) agreed, 27.2% were neutral and 45.7%<br />
disagreed. It scored 45.4, slightly up on 2005’s 44.5 on the scale.<br />
• Over the past year I have noticed a decline in the crime rate in the <strong>Randburg</strong><br />
CBD: 70% disagreed and only 13.6% agreed with this statement (slightly up on<br />
12.5% for 2005). It scored 31.8 on the index – the lowest index score for<br />
<strong>Randburg</strong> and a fall from 32.9 in 2005.<br />
• Over the past year my resolve to remain based in the <strong>Randburg</strong> CBD has risen:<br />
22.2% agreed with this statement, 54.3% were neutral and 23.5% disagreed. It<br />
scored a 50.0 compared to 51.7 in 2005.<br />
• Over the past year I have become more positive/optimistic about the <strong>Randburg</strong><br />
CBD: 33.3% agreed with this statement (down from 50%), and 13.6% disagreed<br />
(down from 23%). 55.2 on the index compared to 55.2 in 2005.
19<br />
• Over the past year my business turnover has risen: 29.6% disagreed (up from<br />
25%), 20% agreed and the rest were neutral. 46.6 on the index compared to 49.1<br />
in 2005.<br />
• Over the past year my employment levels have risen: 17.3% agreed, 68% were<br />
neutral and 13.6% disagreed. It scored 50.9 (from 52.6) on the index.<br />
• Over the coming year I expect my business turnover to rise. 73% of the<br />
respondents agreed (up from 68%), and only 2.5% disagreed. It scored 69.4 on the<br />
<strong>Randburg</strong> index – up from 67.9.<br />
• Over the coming year I expect to increase my employment levels: 76.6% agreed<br />
(up from 67%) and only 4.9% disagreed with this statement. 74.1 on the index –<br />
up from 69.5%.<br />
• Over the coming year I am optimistic that things will improve (crime, grime etc)<br />
in the <strong>Randburg</strong> CBD: Almost 84% of the respondents agreed (significantly up<br />
from 72% in 2005) whilst only 4.9% disagreed. It achieved the best <strong>Randburg</strong><br />
result of 79.0 – up from 70.4 in 2004 on the index – a rise of 8.6%.<br />
• Finally, we have an awareness proxy. It is made up of four questions related to the<br />
awareness of improvement districts, perceived success of these districts, and<br />
awareness of the JDA and its projects. It scored 50 and 63.7 in 2004 and 2005<br />
respectively. This year it showed a massive rise to 87.5.
20<br />
Summary of confidence indices 2004-2006<br />
Index <strong>Randburg</strong> 04 <strong>Randburg</strong> 05 <strong>Randburg</strong> 06<br />
Management 40.8 46.8 42.3<br />
Cleanliness 39.8 44.8 41.4<br />
Orderliness 45.8 44.5 45.4<br />
Crime Decline 37.3 33.0 31.8<br />
Remain Here 46.2 51.7 50.0<br />
Optimism 50 56.5 55.2<br />
Turnover 44 49.1 46.6<br />
Employment 47.7 52.6 50.9<br />
Expected Turnover 58.7 67.9 69.4<br />
Expected<br />
Employment 56.5 69.5 74.1<br />
Future 60 70.5 79.0<br />
Awareness 50 63.7 87.5<br />
Summary of confidence indices 2004-2006<br />
100<br />
90<br />
80<br />
70<br />
Index<br />
60<br />
50<br />
40<br />
30<br />
20<br />
10<br />
0<br />
Management<br />
Cleanliness<br />
Orderliness<br />
Crime Decline<br />
Remain Here<br />
Optimism<br />
Turnover<br />
Employment<br />
Expected Turnover<br />
Expected Employment<br />
Future<br />
Awareness<br />
<strong>Randburg</strong> 04 <strong>Randburg</strong> 05 <strong>Randburg</strong> 06
21<br />
3.2 <strong>Randburg</strong> Image<br />
• 50% of respondents maintained that their image of the <strong>Randburg</strong> CBD was that it<br />
was dirty and unsafe (up from 32%). A further 37% argued that it was not yet<br />
satisfactory but that there were signs of improvement (down from 58% in 2005).<br />
What is your 'image' of the area?<br />
60<br />
58<br />
%<br />
50<br />
40<br />
30<br />
20<br />
10<br />
0<br />
36.3<br />
31.8<br />
50.6<br />
10<br />
DIRTY & UNSAFE CLEAN & SAFE<br />
8<br />
3.7 4 2.3<br />
4.9<br />
ATTRACTIVE &<br />
WELCOMING<br />
2.5 0 1.2<br />
44<br />
VIBRANT<br />
37<br />
NOT YET<br />
SATISFACTORY<br />
BUT IT IS<br />
IMPROVING<br />
2004 2005 2006<br />
• 6% (down from 38% in 2005) felt that there was not enough entertainment in the<br />
<strong>Randburg</strong> CBD. While 74% felt there was not enough entertainment but that it<br />
was improving. When asked what sort of entertainment would improve the<br />
experience in the area, the dominant responses were the similar to previous years:<br />
more upmarket restaurants, cinemas, clubs, and malls.<br />
• 82% believe that the current variety and choice of shops is adequate or improving<br />
in the <strong>Randburg</strong> CBD. Those that were unhappy would like to see more of the
22<br />
following in the area (much like previous years): a proper mall, more anchor<br />
tenants, more upmarket clothing stores, better supermarkets (like Pick ‘n Pay,<br />
Woolworths), more banks, fast food outlets (Steers, McDonalds), department<br />
stores, Gyms, coffee shops etc.<br />
• Respondent were asked how they would like to see the <strong>Randburg</strong> CBD in the<br />
future? 41% would like to see a clean and safe place, 34% as a well managed and<br />
promoted area and 12% as a major shopping node.<br />
How would you most like to see the <strong>Randburg</strong> CBD in the future?<br />
%<br />
50<br />
45<br />
40<br />
35<br />
30<br />
25<br />
20<br />
15<br />
10<br />
5<br />
21.6<br />
3.4<br />
11.9<br />
9.1<br />
1.2 2.5<br />
45.5<br />
40.7<br />
26.1<br />
29.9<br />
17<br />
34.6<br />
11.2<br />
25<br />
12.3<br />
0<br />
24 Hour City with<br />
active street life<br />
Attractive<br />
environment<br />
Clean and safe area<br />
Well Managed and<br />
Promoted Area<br />
A major shopping<br />
area/node attraction<br />
2004 2005 2006
23<br />
3.3 Economic Health<br />
• Businesses were asked which single attribute of the <strong>Randburg</strong> CBD do they feel<br />
has the most positive effect on their business and similarly draws most people to<br />
the area? The most frequent responses (similar to previous years) are listed below:<br />
o Accessibility to bus routes and taxi rank<br />
o Visible security personnel<br />
o Increase in people visiting CBD<br />
o The <strong>Randburg</strong> Mall<br />
o Diversity of shoppers and residents<br />
o The flea market<br />
o The corporate sector<br />
o Central location in North of <strong>Johannesburg</strong><br />
o New developments<br />
• As regards the most negative effect on their business, the following responses<br />
were forthcoming:<br />
o Crime and Grime (most frequent response)<br />
o Informal hawkers (blamed for most of the grime)<br />
o Not vibrant enough to attract youth
24<br />
• Respondents were asked what public sector improvements would most improve the<br />
economic health of the <strong>Randburg</strong> CBD? The responses in order of frequency were as<br />
follows:<br />
o<br />
Cleaner public environment<br />
o Greater security presence<br />
o Capital upgrading of existing buildings<br />
o Promotion and Marketing<br />
o Improvement in the transport infrastructure
25<br />
3.4 Safety and Security<br />
• 30% of respondents do not feel safe outdoors in the <strong>Randburg</strong> CBD (slightly down<br />
from 32%), whilst a further 52% (up from 44% in 2005) do not feel safe but do<br />
believe it is improving.<br />
• 57% do feel safe indoors in the <strong>Randburg</strong> CBD and only 14% do not (much the same<br />
as 2005); the rest feel that it is improving.<br />
Do you feel safe outdoors in the <strong>Randburg</strong> CBD?<br />
60<br />
50<br />
%<br />
40<br />
30<br />
20<br />
2004<br />
2005<br />
2006<br />
10<br />
0<br />
Yes No No-But it is improving<br />
• 55% respondents argued that crime has increased over the past year.<br />
• 43.2% of respondents stated that current policing initiatives were not effective in the<br />
<strong>Randburg</strong> CBD (up from 21.6% in 2005). A further 45.7% felt that they were not yet<br />
effective but that there was improvement.
26<br />
• When asked to rate the overall security situation in the <strong>Randburg</strong> CBD versus the rest<br />
of <strong>Johannesburg</strong>, 27% felt that it was about the same, 54% felt that it was better and<br />
only 16% that it was worse.<br />
• When asked what it would take to make them feel safer almost all respondents<br />
maintain that they would feel safer in the <strong>Randburg</strong> CBD if there were a more visible<br />
police and security presence. There were also calls for control over informal traders<br />
and the overnight homeless people. Others also suggested better lighting at night and<br />
surveillance cameras.
27<br />
How do you rate the overall security situation in the <strong>Randburg</strong> CBD<br />
versus the rest of <strong>Johannesburg</strong>?<br />
60<br />
50<br />
40<br />
44.3<br />
53.1<br />
39.8<br />
%<br />
30<br />
27.2<br />
20<br />
10<br />
0<br />
13.6<br />
8<br />
4.5<br />
1.2<br />
2.3 2.5<br />
Much Better Slightly Better Average-Same Slightly Worse Much Worse<br />
2005 2006<br />
3.5 Appearance<br />
• 44% of respondents felt that street and pavement lightening in the <strong>Randburg</strong> area was<br />
inadequate whilst only 9% felt that it was adequate.<br />
• 51% of respondents argued that litter on pavements was a major problem in the<br />
<strong>Randburg</strong> CBD (down from 69% in 2005). 40.7% of respondents stated that illegal<br />
posters and graffiti was a problem in the area, whilst 58% did not believe this to be<br />
the case.
28<br />
• 71.6% of respondents stated that refuse removal had improved over the past year in<br />
the area (an improvement over 2004). When asked to rate the overall cleanliness of<br />
the <strong>Randburg</strong> CBD versus the rest of <strong>Johannesburg</strong>, 60.5% of respondents felt that it<br />
was better, 25% that it was about the same and only 11% that it was worse.<br />
How do you rate the overall cleanliness of the <strong>Randburg</strong> CBD<br />
versus the rest of <strong>Johannesburg</strong><br />
60<br />
53.1<br />
50<br />
40<br />
% 30<br />
20<br />
10<br />
9.1 7.4<br />
43.2<br />
29.5<br />
24.7<br />
18.2<br />
11.1<br />
0<br />
Much Better Slightly Better Average-Same Slightly Worse Much Worse<br />
0<br />
2.5<br />
2005 2006
29<br />
3.6 Informal Trading<br />
• Encouragingly, 88.9% (71.6% in 2005) of respondents supported the concept of<br />
informal trading in principle, with 9.9% (26% in 2005) not supporting the concept.<br />
• 95% felt that the relocation of informal trading to designated areas would have a<br />
positive impact on the <strong>Randburg</strong> CBD. When asked why they felt this would have a<br />
positive impact, the reasons included:<br />
o Cleaner pavements and more walking space<br />
o It would reduce crime<br />
o Controlled environment<br />
o Less interference with formal business<br />
o Prevent overtrading<br />
3.7 Marketing<br />
• 94% stated that it would be beneficial to have events to attract people to the area.<br />
30% felt they should take place over lunch hours. 20% felt that these events should<br />
take place over weekends and 24% at month end.
30<br />
3.8 Transportation<br />
• Only 27% stated that parking was a problem in the <strong>Randburg</strong> CBD.<br />
• Only 10% believed that the flow of traffic was a concern in the <strong>Randburg</strong> CBD whilst<br />
88% did not believe that this was the case.<br />
• 63% do not want the taxi rank in <strong>Randburg</strong> to be relocated, with only 35% arguing<br />
for its relocation. Respondents indicated that the taxi rank brought in business but that<br />
it was not sufficiently controlled and managed.<br />
• 31% perceived the public bus system favourably, 52% felt that it was average, whilst<br />
17% perceived it negatively.<br />
• 65% of the respondents rated the standard of road signage in the <strong>Randburg</strong> CBD as<br />
better than the rest of <strong>Johannesburg</strong>. 33% rated it as about the same, whilst no one<br />
rated it worse.
31<br />
3.9 Public Environment<br />
• 21% of the respondents (down from 41% in 2004) felt that there were not enough<br />
public facilities in the <strong>Randburg</strong> CBD (information points, public toilets, bus shelter,<br />
public seating etc.). 44% of respondents felt that these facilities were adequate. Public<br />
seating and toilets were again the most frequently requested facilities by the<br />
respondents. The other most common request was for information points.<br />
• 26% described the quality of the public environment in the <strong>Randburg</strong> CBD as good or<br />
excellent, 38% as average and 34% as fair or poor. 43% argued that there were not<br />
enough natural elements (such as parks, trees etc.) and a further 46% saw<br />
improvement in this dimension.
32<br />
How would you describe the quality of the public environment?<br />
40<br />
35<br />
30<br />
25<br />
%<br />
20<br />
15<br />
10<br />
5<br />
0<br />
Excellent Good Average Fair Poor<br />
2005 2006
33<br />
3.10 City Improvement Districts<br />
• The remarkable turnaround in awareness of the initiatives to establish Improvement<br />
Districts in the <strong>Randburg</strong> CBD area seen in 2005, continued in 2006 with 86% of<br />
respondents being aware of the initiatives, up from 68% in 2005.<br />
Are you aware of initiative to establish Improvement Districts in the<br />
<strong>Randburg</strong> CBD?<br />
90<br />
80<br />
70<br />
60<br />
%<br />
50<br />
40<br />
30<br />
20<br />
10<br />
0<br />
2004 2005 2006<br />
Yes<br />
No
34<br />
• 90% thought that these Improvements Districts would make a real positive difference<br />
to the <strong>Randburg</strong> CBD environment – up from 73% in 2004 and 85% in 2005.<br />
Do you think these Improvement Districts will make a real<br />
difference to the <strong>Randburg</strong> CBD?<br />
2.5<br />
90.1<br />
Yes<br />
No
35<br />
3.11 The <strong>Johannesburg</strong> <strong>Development</strong> <strong>Agency</strong><br />
• 80% of respondents had heard of the <strong>Johannesburg</strong> <strong>Development</strong> <strong>Agency</strong> – up from<br />
61% last year.<br />
Proportion of Respondents that were aware of the JDA<br />
80<br />
%<br />
80<br />
70<br />
60<br />
50<br />
40<br />
30<br />
20<br />
10<br />
0<br />
45<br />
61<br />
2004 2005 2006<br />
• 80% of respondents were not aware of the initiatives and projects planned to improve<br />
conditions of the <strong>Randburg</strong> CBD.<br />
• Only 13.6% had any dealings with the <strong>Johannesburg</strong> <strong>Development</strong> <strong>Agency</strong> and<br />
roughly half of them were satisfied with the service that had been provided by the<br />
<strong>Agency</strong>.<br />
• When asked whether they felt confident that the <strong>Johannesburg</strong> <strong>Development</strong> <strong>Agency</strong><br />
had the capability to manage projects in the <strong>Randburg</strong> CBD, 82% said yes, which is<br />
much in line will last year.
36<br />
Do you feel that the JDA has the capability to run projects in the<br />
<strong>Randburg</strong> CBD?<br />
Yes<br />
No<br />
3.12 Conclusion of survey<br />
Respondents were lastly asked a number of open-ended questions regarding<br />
developments in the <strong>Randburg</strong> CBD.<br />
1. What has been the most positive development in the <strong>Randburg</strong> CBD in the past<br />
two years?<br />
• The <strong>Randburg</strong> taxi rank<br />
• The Public transportation system<br />
• Public toilets<br />
• The Post Office moving
37<br />
• Improved cleanliness: ‘The street sweepers in the blue and orange overalls’<br />
• Improved security<br />
2. What has been the most negative development in the <strong>Randburg</strong> CBD in the past<br />
two years?<br />
• Uncontrolled informal trading<br />
• Congestion<br />
• Crime and grime<br />
• Decay of CBD buildings<br />
• Outflow of businesses from CBD<br />
• Invasion by illegal immigrants<br />
3. What does the JDA need to address most urgently in the <strong>Randburg</strong> CBD?<br />
• Crime –most frequent response<br />
• Control informal trading<br />
• Illegal immigrants<br />
• More meetings with <strong>Randburg</strong> business community to discuss ways to<br />
improve<br />
• Continue improving cleanliness<br />
It is clear that the Improvement District in the <strong>Randburg</strong> CBD is bearing fruit. Results<br />
this year show a continued improvement over those of 2005. It is important that visible<br />
delivery keeps continuing to maintain buy-in by the <strong>Randburg</strong> business community.