AAR/ARCI Freight Car Fatigue Task Force II - Marts-rail.org
AAR/ARCI Freight Car Fatigue Task Force II - Marts-rail.org
AAR/ARCI Freight Car Fatigue Task Force II - Marts-rail.org

You also want an ePaper? Increase the reach of your titles
YUMPU automatically turns print PDFs into web optimized ePapers that Google loves.
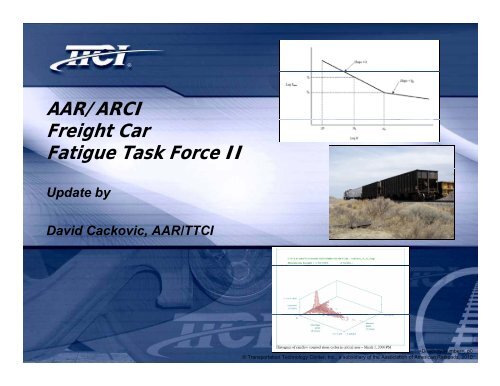
<strong>AAR</strong>/<strong>ARCI</strong><br />
<strong>Freight</strong> <strong>Car</strong><br />
<strong>Fatigue</strong> <strong>Task</strong> <strong>Force</strong> <strong>II</strong><br />
Update by<br />
David Cackovic, <strong>AAR</strong>/TTCI<br />
, p0<br />
© Transportation Technology Center, Inc., a subsidiary of the Association of American Railroads, 2010
Acknowledgements<br />
-- MARTS<br />
-- <strong>AAR</strong>/<strong>ARCI</strong> <strong>Fatigue</strong> <strong>Task</strong> <strong>Force</strong><br />
-- Kevin Koch, TTCI<br />
-- Roger Sims, SPE<br />
-- John Coulborn, Trinity<br />
, p0<br />
© Transportation Technology Center, Inc., a subsidiary of the Association of American Railroads, 2010
Today’s Presentation:<br />
ti<br />
♦Why Updating is Needed<br />
♦How we are updating the<br />
<strong>Fatigue</strong> Guidelines and<br />
Prioritizing <strong>Car</strong> Types<br />
♦Test Program Execution<br />
and Results<br />
®<br />
© TTCI/<strong>AAR</strong>, 2010, Filename p3
Why Updating is Needed<br />
Current Guidelines Based on:<br />
♦Old Environment<br />
• Different roadbed today<br />
− Continuous welded <strong>rail</strong><br />
− Concrete ties<br />
− Better ballast systems<br />
• Longer, heavier trains today<br />
• Higher tractive effort and high adhesion<br />
locomotives<br />
• Vibration was not addressed<br />
®<br />
© TTCI/<strong>AAR</strong>, 2010, Filename p4
Why Updating is Needed<br />
Current Guidelines Based on:<br />
♦1970’s and Older <strong>Car</strong> designs<br />
♦<strong>Car</strong>s used for tests all out of<br />
production<br />
♦263K GRL and lighter vs. today’s<br />
286K GRL<br />
♦Today’s tare weights are often<br />
lower<br />
♦Materials today are higher strength<br />
♦Today use of aluminum is common<br />
®<br />
© TTCI/<strong>AAR</strong>, 2010, Filename p5
Why Updating is Needed<br />
<strong>Fatigue</strong> is the number one structural problem<br />
♦Draft D systems on steel<br />
gondolas<br />
♦Side sills of well cars<br />
♦Top chords of coal cars<br />
♦Container supports of well cars<br />
♦Center sills of spine cars<br />
♦Shear plate on stub sill cars<br />
♦Center beams<br />
♦And more<br />
®<br />
© TTCI/<strong>AAR</strong>, 2010, Filename p6
Why Updating is Needed<br />
<strong>Fatigue</strong> failures are a safety<br />
issue<br />
♦Pull P aparts<br />
♦Collapsed cars<br />
♦Lost loads<br />
♦Improper or poor quality<br />
repairs<br />
Stress state issues<br />
♦<strong>AAR</strong> Standard S-286 requires<br />
fatigue analysis<br />
♦Defective wheels damage the<br />
car as well as the <strong>rail</strong><br />
®<br />
© TTCI/<strong>AAR</strong>, 2010, Filename p7
Why Updating is Needed<br />
A Little More Background:<br />
The original <strong>Fatigue</strong> <strong>Task</strong> <strong>Force</strong> began work in the mid-<br />
70’s as an <strong>ARCI</strong> endeavor.<br />
Later the <strong>ARCI</strong> joined forces with the <strong>AAR</strong> and the work<br />
progressed under the Track Train Dynamics program.<br />
Road testing began in 1984.<br />
®<br />
© TTCI/<strong>AAR</strong>, 2010, Filename p8
Why Updating is Needed<br />
The pathway to lighter, better cars requires accurate<br />
fatigue analysis<br />
Without new tools development stops or we go down<br />
the wrong pathway<br />
The industry has chosen the right pathway for<br />
improving the fatigue analysis tools by …………….<br />
®<br />
© TTCI/<strong>AAR</strong>, 2010, Filename p9
Reforming the FCFTF<br />
<strong>Freight</strong> <strong>Car</strong> <strong>Fatigue</strong> <strong>Task</strong> <strong>Force</strong> <strong>II</strong> reformed September 29, 2004<br />
♦John Coulborn – Trinity Rail Group – Co-Chairman<br />
♦Shaun Richmond – Trinity Rail Group – Co-Chairman<br />
♦Members included: UP, CSX, BNSF, NS, FCA, Gunderson, NSC,<br />
Union Tank <strong>Car</strong>, Sims Engineering, FRA, Sharma and Associates,<br />
TTX, Columbus Steel Castings, and ASF-Keystone<br />
♦David Cackovic and Kevin Koch – <strong>AAR</strong>/TTCI<br />
Work Together: Jointly work to update the specification requirements<br />
and to gather the new fatigue load environment data.<br />
®<br />
© TTCI/<strong>AAR</strong>, 2010, Filename p10
Approach Taken /<br />
This <strong>Task</strong> <strong>Force</strong>’s<br />
Goals<br />
Today’s Presentation:<br />
♦Why Updating is Needed<br />
♦Updating the <strong>Fatigue</strong> Guidelines and Prioritizing <strong>Car</strong><br />
Types<br />
♦Test Program Execution and Results<br />
®<br />
© TTCI/<strong>AAR</strong>, 2010, Filename p11
Revised <strong>AAR</strong> Specification<br />
M-1001 Chapter V<strong>II</strong><br />
<strong>Fatigue</strong> Analysis Calculation Method<br />
♦Method M d by original i 1970’s <strong>Task</strong> <strong>Force</strong><br />
retained<br />
♦Updated Empty-Load Ratios<br />
♦Retained Miner’s Rule, the most commonly<br />
used cumulative damage theory to calculate<br />
fatigue damage<br />
♦Added Section 7.7: Guidelines for FEA<br />
♦Retained original joint configurations<br />
♦Identified new joint configurations to add<br />
later<br />
♦Retained original REPOS until updates are<br />
done<br />
®<br />
© TTCI/<strong>AAR</strong>, 2010, Filename p12
Revised Chapter V<strong>II</strong><br />
Over-the-road testing<br />
♦Established authority of EEC over tests<br />
♦Updated test methods and parameters<br />
♦Updated the format for data reduction<br />
♦Established the initial list of car types to be tested<br />
♦Established the initial priority of the tests<br />
• Coal, Tank and Intermodal first<br />
• Others to follow<br />
• Specific cars selected for testing are approved by the<br />
<strong>AAR</strong> Equipment Engineering g Committee and the <strong>Task</strong><br />
<strong>Force</strong>. <strong>Car</strong>s will be obtained for testing through<br />
donation agreements.<br />
®<br />
© TTCI/<strong>AAR</strong>, 2010, Filename p13
Update <strong>Fatigue</strong> Guidelines<br />
Revised Chapter V<strong>II</strong> Implemented<br />
♦MSRP Section C, Volume 2 was Released May 7, 2007 by the<br />
<strong>AAR</strong> and the Equipment Engineering Committee via <strong>AAR</strong><br />
Circular Letter C-10493.<br />
♦Includes Chapter V<strong>II</strong>.<br />
®<br />
© TTCI/<strong>AAR</strong>, 2010, Filename p14
Today’s Presentation:<br />
♦Why Updating is Needed<br />
♦Updating the <strong>Fatigue</strong> Guidelines and Prioritizing <strong>Car</strong> Types<br />
♦Test Program Execution and Results<br />
®<br />
© TTCI/<strong>AAR</strong>, 2010, Filename p15
Test Program<br />
<strong>Fatigue</strong> Test Requirements for Updating <strong>Freight</strong> <strong>Car</strong><br />
REPOS (Road Environment Percent Occurrence<br />
Spectra)<br />
♦ In the late 70’s and 80’s the basic test methodology was developed<br />
and implemented. The resulting output was test data required for<br />
<strong>rail</strong>car fatigue analysis and the specification “Chapter 7 - <strong>Fatigue</strong><br />
Design of New <strong>Freight</strong> <strong>Car</strong>s.”<br />
♦ Load spectra for the following cars were published:<br />
• High side 263K GRL coal gondola in unit train service<br />
• 263K GRL open top hopper<br />
• 263K GRL stub sill tank car<br />
• 70-Ton boxcar<br />
• 5-unit articulated TOFC spine car for 65K t<strong>rail</strong>ers<br />
®<br />
© TTCI/<strong>AAR</strong>, 2010, Filename p16
Test Program<br />
♦These tests are funded by the <strong>AAR</strong> Strategic Research Program<br />
and the RSI/<strong>ARCI</strong> <strong>Car</strong> Builders.<br />
♦This cooperative testing is tentatively planned for future years,<br />
until the need for current design spectra has been met.<br />
As a side note, the FRA has joined the <strong>AAR</strong> and<br />
RSI/<strong>ARCI</strong> <strong>Car</strong> Builders in funding “sister” tests to obtain<br />
data for tank cars.<br />
®<br />
© TTCI/<strong>AAR</strong>, 2010, Filename p17
Test Program<br />
Test <strong>Car</strong> Selection and Loading<br />
♦Only loaded testing is to be conducted. Experience has<br />
shown that empty car operation has a minimal effect on<br />
fatigue life, so only the Tank <strong>Car</strong>s were tested in the empty<br />
configuration.<br />
♦Coal, Tank and Intermodal first.<br />
®<br />
© TTCI/<strong>AAR</strong>, 2010, Filename p18
Test Program<br />
Test Route Selection<br />
♦The test route for each car type will be determined by the <strong>Task</strong><br />
<strong>Force</strong> and approved by the Equipment Engineering Committee.<br />
Routes selected will be the most appropriate service and train<br />
makeup for the car type.<br />
Train Makeup<br />
♦The test conductor will work to ensure that the car is located in<br />
the middle third of the train consists, as much as is reasonably<br />
possible.<br />
®<br />
© TTCI/<strong>AAR</strong>, 2010, Filename p19
Test Program<br />
♦Data Acquisition System -- Unattended<br />
• A relatively small, self contained system<br />
• 16 channels of data, 256 digital samples per<br />
second, and low-pass filtered at 30 Hz<br />
• Data storage size sufficient to need only two down<br />
loads in 10,000 miles.<br />
♦Calibration of Transducers<br />
♦System S t Check-out tin<br />
Controlled Environment<br />
®<br />
© TTCI/<strong>AAR</strong>, 2010, Filename p20
Test Program<br />
Chapter V<strong>II</strong> Updating and Data Formatting<br />
Upon review and approval by<br />
the <strong>Freight</strong> <strong>Car</strong> <strong>Fatigue</strong> <strong>Task</strong><br />
<strong>Force</strong> and the EEC, the new<br />
load spectra data will be<br />
added to Section 7.3<br />
(“Environment Load<br />
Spectra”) of Chapter V<strong>II</strong>,<br />
either as an augmentation of<br />
existing data or as a<br />
replacement of existing data.<br />
®<br />
© TTCI/<strong>AAR</strong>, 2010, Filename p21
®<br />
© TTCI/<strong>AAR</strong>, 2010, Filename p22
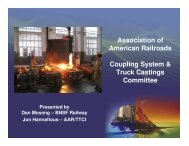
Test Program – Coal <strong>Car</strong><br />
FCFTF coal car testing became part of <strong>AAR</strong><br />
Strategic Research Initiative 14D “In Service Load<br />
Monitoring” Program<br />
♦Monitor the stress state in <strong>rail</strong>road service<br />
♦Build database for 286K GRL coal service<br />
®<br />
© TTCI/<strong>AAR</strong>, 2010, Filename p23
Test Program – Coal <strong>Car</strong><br />
SRI 14D Instrumentation<br />
♦2 <strong>Force</strong> measuring wheels<br />
♦2 Axles to measure strain<br />
♦Accelerations on body both ends<br />
• One brake valve<br />
♦Brake beam strains<br />
♦Top chord strains<br />
FCFTF Instrumentation<br />
♦Bolster strains and forces<br />
♦Side bearing loads<br />
♦Coupler <strong>Force</strong><br />
♦Side frame loads<br />
♦Top chord strains<br />
®<br />
© TTCI/<strong>AAR</strong>, 2010, Filename p24
Test Program – Coal <strong>Car</strong><br />
MEASUREMENT<br />
Transducer Type,<br />
Comment<br />
Data Type, Analysis<br />
MEASURMENT<br />
Center Plate Vertical Load<br />
Side Bearing Load Bridge<br />
Longitudinal Coupler Load<br />
Strain Gage, calibrated in<br />
load frame<br />
Instrumented Coupler<br />
Time History, Rainflow<br />
Cycle Counting Post<br />
Test Processing<br />
SYSTEM MEASUREMENTS<br />
Power System Time History<br />
GPS Train Speed GPS Time History<br />
GPS Train Location GPS Time History<br />
CAR BODY STRUCTURAL MEASUREMENTS<br />
<strong>Car</strong> Body Strain Locations<br />
(Key locations, twist, etc.)<br />
Strain gage, locations<br />
based on car type (history,<br />
analysis)<br />
Time History, Rainflow<br />
Post Processing<br />
BOLSTER AND SIDEFRAME LOAD SPECTRA<br />
Bolster Load<br />
SF Vertical Load<br />
SF Lateral Load<br />
Strain Gage, calibrated in<br />
load frame<br />
Time History, Rainflow<br />
Post Processing<br />
®<br />
© TTCI/<strong>AAR</strong>, 2010, Filename p25
Test Program – Coal <strong>Car</strong><br />
1 & 2 3 & 4<br />
5 & 6<br />
®<br />
© TTCI/<strong>AAR</strong>, 2010, Filename p26
Test Program – Coal <strong>Car</strong><br />
Phase I Tests, with instrumentation<br />
coach, conducted in 2006<br />
♦ Western and Eastern RR<br />
♦ 3,200 miles of loaded car data<br />
• Wyoming to NY on UP / CSX<br />
• Wyoming to Ge<strong>org</strong>ia on BNSF /<br />
NS<br />
♦ Aluminum coal cars in front of coal<br />
train<br />
Phase <strong>II</strong> Tests, unattended<br />
♦ Most measurements obtained 4,900<br />
loaded miles of data, some<br />
measurements obtained 5,200 miles.<br />
Mine<br />
GPS Position Loaded Train<br />
Cities<br />
Chicago<br />
Dunkirk<br />
Cleveland<br />
Omaha<br />
North Platte<br />
®<br />
© TTCI/<strong>AAR</strong>, 2010, Filename p27
Test Program – Coal <strong>Car</strong><br />
Top chord strains<br />
Approached buckling limit i in body bounce<br />
motions<br />
Bending strains not as significant<br />
Highest stress at speeds above 45 mph<br />
Will evaluate coupler force link to high strains<br />
®<br />
© TTCI/<strong>AAR</strong>, 2010, Filename p28
Test Program – Coal <strong>Car</strong><br />
Large top chord stresses were recorded<br />
Top Chord<br />
Location on Route<br />
Test<br />
Speed<br />
(mph)<br />
Compressive<br />
Axial<br />
Stress<br />
Bending<br />
Stress<br />
Vertical<br />
Wheel<br />
<strong>Force</strong><br />
Clinton Sub., MP 148.13,<br />
13<br />
Right Switch<br />
Columbus Sub., MP<br />
86.49, Bridge<br />
Columbus Sub., MP<br />
88.23, Culvert<br />
South Morrill Sub., MP<br />
62.89, Road<br />
Crossing<br />
Clinton Sub, MP 159.31 -<br />
culvert<br />
51.8 20,820 2,320 76,710710<br />
49.5 18,210 2,190 73,460<br />
50.00 17,520 2,030 68,230<br />
50.0 16,270 1,680 56,560<br />
43.1 15,960 2,150 65,450<br />
Calculated Critical Compressive Stress for Buckling – 22,300 psi.<br />
Maximum compressive stress 93% of calculated limit<br />
®<br />
© TTCI/<strong>AAR</strong>, 2010, Filename p29
Test Program – Coal <strong>Car</strong><br />
100<br />
10<br />
Even nts per Mile<br />
1<br />
0.1<br />
0.01<br />
0.001<br />
0 500 1000 1500<br />
3600 Miles 2006 Data<br />
5625 Miles 83'-85' Data<br />
0.0001<br />
LCF P-P Kips<br />
®<br />
© TTCI/<strong>AAR</strong>, 2010, Filename p30
Test Program – Coal <strong>Car</strong><br />
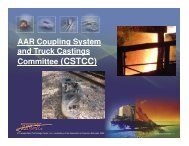
Bolster and side frame loads have been useful for <strong>AAR</strong> Coupling<br />
System & Truck Castings Committee (CS&TCC) efforts<br />
2,500,000<br />
<strong>AAR</strong> M-202 Minimum<br />
Qualification<br />
800,000<br />
Equivalent<br />
<strong>Fatigue</strong> Test Mileage E<br />
2,000,000<br />
1,500,000<br />
1,000,000<br />
500,000<br />
700,000<br />
600,000<br />
500,000<br />
400,000<br />
300,000<br />
200,000<br />
100,000<br />
cles<br />
<strong>Fatigue</strong> Test Cyc<br />
0<br />
SF<br />
SF<br />
SF<br />
SF<br />
SF<br />
SF<br />
SF<br />
A<br />
A<br />
A<br />
A<br />
A<br />
A<br />
A<br />
PEI<br />
PEI<br />
PEI<br />
PEI<br />
Test Location<br />
TT TCI<br />
TT TCI<br />
TT TCI<br />
TT TCI<br />
TT TCI<br />
TT TCI<br />
TT TCI<br />
0<br />
®<br />
© TTCI/<strong>AAR</strong>, 2010, Filename p31
Test Program – Coal <strong>Car</strong><br />
<br />
Coupler loads have been useful for <strong>AAR</strong> CS&TCC efforts<br />
M-216 Specification<br />
Knuckle <strong>Fatigue</strong> Test Load Cycles Proposed<br />
Segment<br />
Number of Total Cycle Load<br />
Cycles Elapsed Range<br />
(Sinusoidal Cycles<br />
form)<br />
1 4 4 10 – 300 kips<br />
2 2 6 10 – 280 kips<br />
3 7 13 10 – 260 kips<br />
4 10 23 10 – 240 kips<br />
5 31 54 10 – 220 kips<br />
6 77 131 10 – 200 kips<br />
7 65 196 10 – 180 kips<br />
8 73 269 10 – 160 kips<br />
9 89 358 10 – 140 kips<br />
10 105 463 10 – 120 kips<br />
11 129 592 10 – 100 kips<br />
12 187 779 10 – 80 kips<br />
13 279 1058 10 – 60 kips<br />
Thanks to NS for significant ifi effort on this<br />
test plan development!<br />
®<br />
© TTCI/<strong>AAR</strong>, 2010, Filename p32
Test Program – Intermodal <strong>Car</strong><br />
5-Unit Intermodal Well <strong>Car</strong><br />
This car was a combination of five well units,<br />
supported by six trucks. Each unit was<br />
designed to carry 40 ft. or 20 ft. long freight<br />
containers.<br />
A special non-revenue, dedicated payload was<br />
used for this test. Standard freight<br />
containers loaded with 55 gallon barrels,<br />
filled with concrete were utilized. The<br />
payload for each unit was as follows:<br />
♦ BU Unit – 56,400 lb. 40 ft. container mounted<br />
on top of a 69,400 lb. 40 ft. container<br />
♦ C Unit – Empty 10,000 lb. 40 ft. container<br />
mounted on top of two 50,000 lb. 20 ft.<br />
containers.<br />
♦ D, E, and A Units – A single 40 ft. 49,000 lb.<br />
unit in each.<br />
®<br />
© TTCI/<strong>AAR</strong>, 2010, Filename p33
Test Program – Intermodal <strong>Car</strong><br />
Instrumentation installed<br />
♦ Truck (100-ton)<br />
• Truck bolster load<br />
• Side Bearing (brackets)<br />
• Centerbowl load<br />
♦ <strong>Car</strong> body strain measurements<br />
Began over-the-road testing<br />
December 3, 2007<br />
Placement target is rear two-thirds of<br />
the train consists, in Chicago to west<br />
cost<br />
Approximately 8,900 – 12,000 miles<br />
of data has been collected,<br />
depending on measurement reliability<br />
®<br />
© TTCI/<strong>AAR</strong>, 2010, Filename p34
Test Program – Intermodal <strong>Car</strong><br />
®<br />
© TTCI/<strong>AAR</strong>, 2010, Filename p35
Test Program – Intermodal <strong>Car</strong><br />
®<br />
© TTCI/<strong>AAR</strong>, 2010, Filename p36
Results for Intermodal <strong>Car</strong> Testing<br />
The primary result of the data processing was a set of cycle<br />
counted histograms containing the maximum value,<br />
minimum value and number of cycles for each load<br />
magnitude “bin”.<br />
♦ This data can<br />
then be used in<br />
fatigue damage<br />
calculations for<br />
critical areas of<br />
each car<br />
design. An<br />
example of a<br />
few rows of a<br />
longitudinal<br />
coupler force<br />
histogram is<br />
shown.<br />
®<br />
© TTCI/<strong>AAR</strong>, 2010, Filename p37
Results for Intermodal <strong>Car</strong> Testing<br />
Test “Percent Occurrence” the number of cycles counted for a<br />
particular maximum and minimum value divided by the total number of<br />
cycles counted.<br />
♦ Time domain data<br />
was always available<br />
to confirm maximum<br />
or minimum values<br />
that were observed in<br />
the histogram data.<br />
Examples of time<br />
domain coupler force<br />
data are shown.<br />
®<br />
© TTCI/<strong>AAR</strong>, 2010, Filename p38
Results for Intermodal <strong>Car</strong> Testing<br />
In order to observe the character of the data and perhaps compare<br />
results with those of similar tests, the histograms were converted to<br />
two-dimensional, force range versus event per mile form.<br />
♦ The range is just the<br />
minimum value of a cycle<br />
subtracted from the<br />
maximum value. All cycles<br />
from each range “bin” are<br />
then added together.<br />
♦ The cycles for each range bin<br />
are then divided by the total<br />
test mileage for that<br />
particular channel to produce<br />
a cycle or “event per mile”<br />
number.<br />
♦ Stress range is a significant<br />
factor in the calculation of<br />
fatigue damage.<br />
LE<br />
EVENTS PER MI<br />
LONG. COUPLER FORCE EVENTS PER MILE - DTTX751062<br />
100<br />
10<br />
1<br />
0.1<br />
0.01<br />
0.001<br />
0.0001<br />
0.00001<br />
0 50 100 150 200 250 300<br />
FORCE RANGE KIPS<br />
®<br />
© TTCI/<strong>AAR</strong>, 2010, Filename p39
Testing and Simulations for the Development of<br />
New <strong>AAR</strong> Rail <strong>Car</strong> <strong>Fatigue</strong> Design Spectra<br />
Data Validation<br />
The data collected through these tests, while using technically<br />
rigorous testing methods, must be validated prior to being required<br />
for freight car design.<br />
In the case of each car type, steps were taken to:<br />
• Check the realism of predicted fatigue life of various welded joints<br />
in the design (of each car type)<br />
• Check the lives of members where owners/builders had<br />
experienced shortened fatigue life in the field<br />
• Evaluate differences in calculation methodology to determine<br />
appropriate industry techniques<br />
®<br />
© TTCI/<strong>AAR</strong>, 2010, Filename p40
Testing and Simulations for the Development of<br />
New <strong>AAR</strong> Rail <strong>Car</strong> <strong>Fatigue</strong> Design Spectra<br />
Methodology<br />
Regarding the issue of how to treat the S–N diagram in the<br />
application of Miner’s Rule of Accumulated Damage (reference <strong>AAR</strong><br />
MSRP M-1001, Chapter V<strong>II</strong>), the figure below shows the two portions<br />
of the curve for a typical welded joint.<br />
®<br />
© TTCI/<strong>AAR</strong>, 2010, Filename p41
Testing and Simulations for the Development of<br />
New <strong>AAR</strong> Rail <strong>Car</strong> <strong>Fatigue</strong> Design Spectra<br />
To revisit the fatigue analysis procedures in Chapter V<strong>II</strong> of M-1001 –<br />
three (3) calculations l with variations in method were made to predict<br />
lives of a particular coal car welded joint. The fatigue results were<br />
very similar thus proving that the M-1001 methods were still<br />
appropriate and the Coal <strong>Car</strong> data was valid.<br />
®<br />
© TTCI/<strong>AAR</strong>, 2010, Filename p42
Testing and Simulations for the Development of<br />
New <strong>AAR</strong> Rail <strong>Car</strong> <strong>Fatigue</strong> Design Spectra<br />
®<br />
© TTCI/<strong>AAR</strong>, 2010, Filename p43
Testing and Simulations for the Development of<br />
New <strong>AAR</strong> Rail <strong>Car</strong> <strong>Fatigue</strong> Design Spectra<br />
For the intermodal car data validation, much more was required<br />
because the predicted lives of well car joints near center of car<br />
(pictured) were too high. After vehicle dynamic’s analysis, it was<br />
determined to do more testing at TTC, and to use the coal car<br />
longitudinal coupler load data for designs in the interim.<br />
®<br />
© TTCI/<strong>AAR</strong>, 2010, Filename p44
Status:<br />
Chapter 7, Section C, Part <strong>II</strong>, Volume 1 of the MSRP is in the final<br />
stages for release for industry comment, and then for reprinting.<br />
New coal and five-unit intermodal car designs will be required to<br />
meet the new data requirements. In addition, new data for tank cars<br />
will be included.<br />
®<br />
© TTCI/<strong>AAR</strong>, 2010, Filename p45
Acknowledgements<br />
-- MARTS<br />
-- <strong>AAR</strong>/<strong>ARCI</strong> <strong>Fatigue</strong> <strong>Task</strong> <strong>Force</strong><br />
-- Kevin Koch, TTCI<br />
-- Roger Sims, SPE<br />
-- John Coulborn, Trinity<br />
QUESTIONS?<br />
, p0<br />
© Transportation Technology Center, Inc., a subsidiary of the Association of American Railroads, 2010