review and analysis of wheel impact load detector ... - Marts-rail.org
review and analysis of wheel impact load detector ... - Marts-rail.org
review and analysis of wheel impact load detector ... - Marts-rail.org

You also want an ePaper? Increase the reach of your titles
YUMPU automatically turns print PDFs into web optimized ePapers that Google loves.
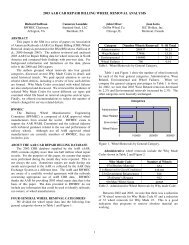
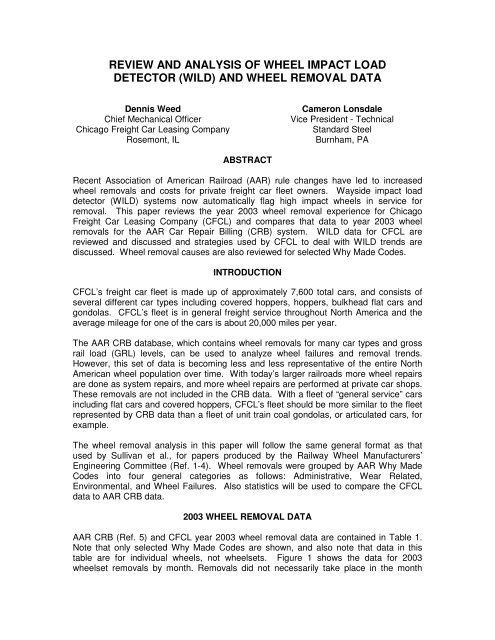
REVIEW AND ANALYSIS OF WHEEL IMPACT LOADDETECTOR (WILD) AND WHEEL REMOVAL DATADennis WeedChief Mechanical OfficerChicago Freight Car Leasing CompanyRosemont, ILCameron LonsdaleVice President - TechnicalSt<strong>and</strong>ard SteelBurnham, PAABSTRACTRecent Association <strong>of</strong> American Railroad (AAR) rule changes have led to increased<strong>wheel</strong> removals <strong>and</strong> costs for private freight car fleet owners. Wayside <strong>impact</strong> <strong>load</strong><strong>detector</strong> (WILD) systems now automatically flag high <strong>impact</strong> <strong>wheel</strong>s in service forremoval. This paper <strong>review</strong>s the year 2003 <strong>wheel</strong> removal experience for ChicagoFreight Car Leasing Company (CFCL) <strong>and</strong> compares that data to year 2003 <strong>wheel</strong>removals for the AAR Car Repair Billing (CRB) system. WILD data for CFCL are<strong>review</strong>ed <strong>and</strong> discussed <strong>and</strong> strategies used by CFCL to deal with WILD trends arediscussed. Wheel removal causes are also <strong>review</strong>ed for selected Why Made Codes.INTRODUCTIONCFCL’s freight car fleet is made up <strong>of</strong> approximately 7,600 total cars, <strong>and</strong> consists <strong>of</strong>several different car types including covered hoppers, hoppers, bulkhead flat cars <strong>and</strong>gondolas. CFCL’s fleet is in general freight service throughout North America <strong>and</strong> theaverage mileage for one <strong>of</strong> the cars is about 20,000 miles per year.The AAR CRB database, which contains <strong>wheel</strong> removals for many car types <strong>and</strong> gross<strong>rail</strong> <strong>load</strong> (GRL) levels, can be used to analyze <strong>wheel</strong> failures <strong>and</strong> removal trends.However, this set <strong>of</strong> data is becoming less <strong>and</strong> less representative <strong>of</strong> the entire NorthAmerican <strong>wheel</strong> population over time. With today’s larger <strong>rail</strong>roads more <strong>wheel</strong> repairsare done as system repairs, <strong>and</strong> more <strong>wheel</strong> repairs are performed at private car shops.These removals are not included in the CRB data. With a fleet <strong>of</strong> “general service” carsincluding flat cars <strong>and</strong> covered hoppers, CFCL’s fleet should be more similar to the fleetrepresented by CRB data than a fleet <strong>of</strong> unit train coal gondolas, or articulated cars, forexample.The <strong>wheel</strong> removal <strong>analysis</strong> in this paper will follow the same general format as thatused by Sullivan et al., for papers produced by the Railway Wheel Manufacturers’Engineering Committee (Ref. 1-4). Wheel removals were grouped by AAR Why MadeCodes into four general categories as follows: Administrative, Wear Related,Environmental, <strong>and</strong> Wheel Failures. Also statistics will be used to compare the CFCLdata to AAR CRB data.2003 WHEEL REMOVAL DATAAAR CRB (Ref. 5) <strong>and</strong> CFCL year 2003 <strong>wheel</strong> removal data are contained in Table 1.Note that only selected Why Made Codes are shown, <strong>and</strong> also note that data in thistable are for individual <strong>wheel</strong>s, not <strong>wheel</strong>sets. Figure 1 shows the data for 2003<strong>wheel</strong>set removals by month. Removals did not necessarily take place in the month
shown due to billing cycle delays. Note the “seasonality” trend <strong>of</strong> removals with anincrease seen in the Spring after winter months when <strong>wheel</strong>/<strong>rail</strong> adhesion is lower <strong>and</strong>air brake problems are typically more common.AAR Why Made Code Category AAR CRB CFCL7 Obsolete material Administrative 654 211 Removed good condition Administrative 236,102 1,56223 Government Requirement Administrative 816 3425 Owner’s request Administrative 912 2490 Mate <strong>wheel</strong> scrapped Administrative 48,205 15565 High <strong>impact</strong> <strong>wheel</strong> – WILD Environmental 33,011 20267 Out-<strong>of</strong>-round - Gage Environmental 10,230 7074 Thermal crack Environmental 3,926 4575 Shelling Environmental 62,689 38076 Tread built-up Environmental 7,655 6878 Tread slid flat Environmental 23,576 11580 Scrape/dent/gouge Environmental 3,887 3360 Flange thin Wear Related 18,952 9364 Flange high Wear Related 41,397 11573 Rim thin Wear Related 12,843 4398 Not meeting reap. limit Wear Related 4,226 2866 Flange cracked/broken Wheel Failure 171 468 Cracked rim Wheel Failure 320 371 Shattered rim Wheel Failure 143 072 Rim spread Wheel Failure 100 3Total all Why Made Codes (not only those listed) 513,739 3,014Table 1. Year 2003 <strong>wheel</strong> removal data for AAR CRB <strong>and</strong> CFCL.160140120100806040200Jan Feb Mar Apr May Jun Jul Aug Sep Oct Nov DecMonth In Year 2003Figure 1. CFCL 2003 Wheelsets Changed Out.The CFCL cars operate throughout North America on several different <strong>rail</strong>roads <strong>and</strong>therefore are subject to repair at many locations. Figure 2 shows <strong>wheel</strong>set repairs by<strong>rail</strong>road while Figure 3 shows the miles that CFCL cars traveled on different <strong>rail</strong>roads in
2003. Figures 2 <strong>and</strong> 3 show logical trending in that the number <strong>of</strong> <strong>wheel</strong> removals on a<strong>rail</strong>road decreases with a fewer number <strong>of</strong> miles traveled on that <strong>rail</strong>road. However,note that the “others” category in Figure 2 is a significant number – this categorycontains <strong>wheel</strong>set changeouts made at private car repair facilities. CFCL performsapproximately 20% <strong>of</strong> <strong>wheel</strong>set changes at private shops to allow for proactivemaintenance <strong>and</strong> to control costs.7006005004003002001000RR1 RR2 RR3 RR4 RR5 RR6 OthersRailroad Or Shop Making RepairFigure 2. CFCL 2003 Wheelset Changeouts By Railroad/Shop.6050403020100RR1 RR2 RR3 RR4 RR5 RR6 RR7 RR8 OthersRailroad Upon Which Cars Are OperatingFigure 3. CFCL 2003 Miles By Railroad.Figure 4 is a graph showing year 2003 CFCL <strong>wheel</strong> removals according to the category<strong>of</strong> <strong>wheel</strong>set removals. Note that Environmental causes are the top reason for CFCL<strong>wheel</strong>set removals – <strong>wheel</strong>s are thus not wearing out as is desired by the car owner <strong>and</strong>resources are being wasted. Roller bearings are the second most frequent reason for<strong>wheel</strong>set removals. We note that CFCL does not account for Why Made Code 11(removed good condition) in the "Administrative" category, rather the proper cause <strong>of</strong> the
<strong>wheel</strong>set removal is recorded. As an example, if a <strong>wheel</strong>set is removed for reasonsrelated to the roller bearings, the <strong>wheel</strong>set is not shown to be removed for Why MadeCode 11.Figure 5 shows the four year industry <strong>wheel</strong> removal trend (2000-2003) for WearRelated <strong>wheel</strong> removals. The graph shows the percent <strong>of</strong> <strong>wheel</strong>s removed for the givenWhy Made Code. Note that the number <strong>of</strong> <strong>wheel</strong>s removed for wear related causes hastrended downwards due to the reduction in <strong>wheel</strong>s changed out for high flange.8007006005004003002001000Envir R/B Wear De<strong>rail</strong> Admin Wheel/Fail AxleCause For Wheelset ChangeoutFigure 4. CFCL 2003 Changeout Groups.Flange Thin Flange High Rim Thin141210864202000 2001 2002 2003Year Of Wheel RemovalFigure 5. Four Year Wheel Removal Trend (Industry).WHY MADE CODE 65 – HIGH IMPACT WHEEL, DETECTORWhy Made Code 65 was established as <strong>of</strong> January 1, 2003 <strong>and</strong> applies for removal <strong>of</strong><strong>wheel</strong>s that have been identified by <strong>wheel</strong> <strong>impact</strong> <strong>load</strong> <strong>detector</strong> (WILD) systems. The
development <strong>of</strong> the new removal code is part <strong>of</strong> an effort by North American <strong>rail</strong>roads toreduce the “stress state” <strong>of</strong> the <strong>rail</strong>road. High <strong>impact</strong> <strong>wheel</strong>s damage <strong>rail</strong>s, carcomponents, <strong>wheel</strong>s, lading, etc., <strong>and</strong> are said to significantly increase trackmaintenance costs for <strong>rail</strong>roads.Wheel <strong>impact</strong> <strong>load</strong> in service must be 90,000 pounds or greater for <strong>wheel</strong>s to beremoved (Ref. 6). AAR rules also have established that the WILD <strong>detector</strong> must becalibrated per manufacturer’s instructions, must reliably measure peak <strong>impact</strong>s <strong>and</strong> mustprovide printable records. Device calibration records also must be maintained. Wheelsthat have been slid flat by the h<strong>and</strong>ling line are not to be billed as out-<strong>of</strong>-round.Until 2003, rules for out-<strong>of</strong>-round <strong>wheel</strong> (Why Made Code 67) removal were considerablydifferent. Wheels were required to have a wayside <strong>impact</strong> <strong>load</strong> <strong>of</strong> 90,000 pounds <strong>and</strong>have been verified with an approved gage/measuring system to have a 0.070 inchesout-<strong>of</strong> -round “runout” measurement. Currently, Why Made Code 67 (<strong>wheel</strong> out-<strong>of</strong>-rounddetected by gage) applies for <strong>wheel</strong>s removed using the latter gage method.For CFCL, 6.7% <strong>of</strong> <strong>wheel</strong> removals in 2003 were for the new Why Made Code 65. AARCRB data shows that 6.4% <strong>of</strong> removals were for Why Made Code 65. However, morerecent data (January 2004 through end <strong>of</strong> April 2004) shows that approximately 12.5%<strong>of</strong> CFCL <strong>wheel</strong> removals are due to Why Made Code 65. This suggests that perhapsCFCL’s car fleet is somehow different than the AAR overall car fleet, or is experiencingdifferent service conditions, since the percentage for high <strong>impact</strong> <strong>wheel</strong>s is twice as high.Perhaps the higher percentage <strong>of</strong> Why Made Code 65 removals on CFCL cars is relatedto h<strong>and</strong>brake usage <strong>and</strong> <strong>wheel</strong> sliding in service.SLIDING RELATED DEFECTSSeveral Why Made Codes for <strong>wheel</strong> removals are associated with <strong>wheel</strong> sliding eventsin service. These include Why Made Codes 65, 67, 75, 76 <strong>and</strong> 78. It must be noted thatWhy Made Code 75 removals can be caused by two other service conditions – trueshelling (rolling contact fatigue) <strong>and</strong> thermal-mechanical shelling (rolling contact fatiguewith tread heating from drag braking). However, it has been generally accepted thatmost North American removals for Why Made Code 75 in general freight service are dueto <strong>wheel</strong> sliding <strong>and</strong> subsequent martensite formation.There are many papers in the literature that deal specifically with the causes <strong>of</strong> WhyMade Code 75. Wheels with sliding related defects can eventually lead to high <strong>impact</strong><strong>load</strong>s in service <strong>and</strong> removal under Why Made Code 65 or 67.Wheel sliding can be caused by many factors, including, but not limited to, the following:• H<strong>and</strong>brake left on• Air brake system problem• Empty/<strong>load</strong> system not working properly• Cars on rear <strong>of</strong> train pulled/not released• Slippery <strong>rail</strong>• Wheel/<strong>rail</strong> pr<strong>of</strong>ile issue• Train h<strong>and</strong>ling/braking• Truck steering issues
Figure 6 shows AAR CRB data for <strong>wheel</strong> removals related to <strong>wheel</strong> sliding for the fouryearperiod 2000 through 2003. For Figure 6, these causes include Why Made Codes65, 75, 76 <strong>and</strong> 78. Note the large increase in removals during 2003 caused by the newWhy Made Code 65 for high <strong>impact</strong> <strong>wheel</strong>s.Figure 7 shows the number <strong>of</strong> <strong>wheel</strong>sets changed out by month for the various removalcategories as follows: 1) Why Made Code 65, 2) Other Environmental removals, <strong>and</strong> 3)Non-Environmental removals.30Shelling Slid Flat Built-Up Tread High Impact Wheel25201510502000 2001 2002 2003Year Of Wheel RemovalFigure 6. Four Year Sliding Wheel Defect Trend (Industry).160Non-Env Other Env WM 65140120100806040200Jan Feb Mar Apr May Jun Jul Aug Sep Oct Nov DecMonth <strong>of</strong> Wheelset ChangeoutFigure 7. CFCL 2003 Wheel Sets Changed Out By Month.
CHI-SQUARE STATISTICAL COMPARISONSThe Chi-square statistical test can be used to compare two samples to determine if thereis a statistically significant difference in performance between the two samples. In ourcase we desire to compare AAR CRB <strong>and</strong> CFCL <strong>wheel</strong> removals to see if there aresimilarities. The Chi-square test uses attribute data (i.e., “good” <strong>and</strong> “bad”) for thecomparison <strong>and</strong> the values in Table 2. For example, to compare <strong>wheel</strong> shelling, the 380Why Made Code 75 removals for CFCL are considered as “bad” while the remaining2,634 are considered “good” since they were not removed for Why Made Code 75.Minitab® statistical s<strong>of</strong>tware is used for the Chi-square test. The s<strong>of</strong>tware calculates a“P-value” <strong>and</strong> the expected number <strong>of</strong> values given the samples. If the P-value is lessthan 0.05, there is a statistically significant difference between the two samples. If the P-value is greater than 0.05, there is no difference in performance.Comparisons for Why Made Codes 65, 67 <strong>and</strong> 75 showed no statistically significantdifference in performance between AAR CRB <strong>and</strong> CFCL data. Comparisons for WhyMade Codes 74, 76, 78 showed that there is indeed a statistically significant differencein performance between AAR CRB <strong>and</strong> CFCL data. For Why Made Codes 74 <strong>and</strong> 76,CFCL had more than expected removals, thus performance is considered to be worsethan AAR CRB data. However, we note that CFCL had fewer than expected removalsfor slid flat <strong>wheel</strong>s. A final comparison was made for <strong>wheel</strong> failures using grouped WhyMade Codes 66, 68, 71, <strong>and</strong> 72. There was a statistically significant difference inperformance between AAR CRB data <strong>and</strong> CFCL data, <strong>and</strong> CFCL had more <strong>wheel</strong>failures than the calculated expected number (10 actual vs. 4.3 expected).The similarity in data between AAR CRB <strong>and</strong> CFCL is not surprising since the CFCLfleet is made up largely <strong>of</strong> general service cars, <strong>and</strong> the majority <strong>of</strong> CFCL <strong>wheel</strong>setrepairs are made by <strong>rail</strong>roads – thus are reported into the AAR CRB system. Data aresummarized in Table 3.AAR WhyMade CodeCFCLor AARActual Number<strong>of</strong> RemovalsExpected Number<strong>of</strong> RemovalsStatisticallySignificantDifference?65, Impact CFCL 202 194 No, P = 0.537<strong>detector</strong> AAR 33, 011 33,01967, Out-<strong>of</strong>roundCFCL 70 60 No, P = 0.195AAR 10,230 10,24074, Thermal CFCL 45 23 Yes, P = 0cracks AAR 3,926 3,94875, Shelling CFCL 380 368 No, P = 0.498AAR 62,689 62,70176, Tread CFCL 68 45 Yes, P = 0.001built-up AAR 7,655 7,67878, Slid flat CFCL 115 138 Yes, P = 0.043AAR 23,576 23,55366, 68, 71,72, FailuresCFCL 10 4.34 Yes, P = 0.006AAR 734 739Table 3. Chi-square comparisons, CFCL vs. AAR CRB.
SPEED/LOAD CORRECTION AND DEALING WITH WHEEL IMPACTSThere are several variables related to WILD <strong>detector</strong>s that could potentially lead todifferences in <strong>load</strong> readings as <strong>wheel</strong>s pass over them. These include, but are notlimited to: 1) speed <strong>of</strong> train, 2) type <strong>of</strong> ties used, 3) stiffness <strong>and</strong> stability <strong>of</strong> subgrade, 4)type <strong>of</strong> sensor grid used, etc. As speeds increase the recorded <strong>load</strong> also increases.Thus a reading <strong>of</strong> 90,000 pounds at 60 mph is more likely than at 30 mph. AAR hasbeen studying the issue <strong>of</strong> speed correction in recent years.For 286,000 pound GRL cars, the typical <strong>wheel</strong> <strong>load</strong> should be 286,000/8, or 35,750pounds. For 263,000 pound GRL cars, the typical <strong>wheel</strong> <strong>load</strong> is 32,875 pounds. CFCLuses a “rule <strong>of</strong> thumb value” <strong>of</strong> 34,000 pounds for all <strong>load</strong>ed cars, then adds 7,000pounds for a total <strong>of</strong> 41 kips, which is a typical value for the majority <strong>of</strong> <strong>load</strong>ed CFCL<strong>wheel</strong>s at about 56 mph in service. If a <strong>wheel</strong> has an <strong>impact</strong> <strong>load</strong> value <strong>of</strong> more than 41kips this provides an indication that the <strong>wheel</strong> is trending in the wrong direction. If the<strong>impact</strong> <strong>load</strong> reaches 65 kips in service, a “yellow flag” is applied to the car record <strong>and</strong> anotification is sent to the car shop to have the <strong>wheel</strong> inspected.Figure 10 is a photo showing the R3 <strong>wheel</strong> from car CRDX 13648 – the <strong>wheel</strong> wasremoved following a <strong>load</strong>ed <strong>impact</strong> reading <strong>of</strong> 75 kips in service. After the <strong>impact</strong>reading was detected, CFCL’s car shop was notified to inspect <strong>and</strong> hold the <strong>wheel</strong>. Notethe visible tread defects, clearly caused by <strong>wheel</strong> sliding. With rare exceptions (selectedservice cases where thermal mechanical shelling or true rolling contact fatigue areindeed taking place), <strong>wheel</strong> sliding causes general freight service <strong>wheel</strong> <strong>impact</strong>s.Figure 10. R3 Wheel From CRDX 13648.CFCL, like many other private fleet owners, uses data to help manage the <strong>wheel</strong> <strong>impact</strong>situation on cars. AAR/TTCI InteRISS data allows fleet owners to track the condition <strong>of</strong>cars <strong>and</strong> proactively manage high <strong>impact</strong> <strong>wheel</strong> changeouts. Figure 11 shows thedistribution <strong>of</strong> all <strong>wheel</strong> <strong>load</strong>s for the CFCL fleet during a particular day in June 2004while Figure 12 shows the same information for <strong>wheel</strong>sets. The majority <strong>of</strong> <strong>wheel</strong>sets
are well below the condemnable limit <strong>of</strong> 90 kips <strong>and</strong> in fact the vast majority are lessthan 44 kips. Figure 12, which deals with <strong>wheel</strong>sets, is most relevant to CFCL from amanagement <strong>and</strong> cost control perspective. Although AAR CRB data for <strong>wheel</strong>s arebased upon individual <strong>wheel</strong>s, CFCL sees the most value in using <strong>wheel</strong>sets. Repaircosts are based upon exchange <strong>of</strong> the entire <strong>wheel</strong>set, even if only one <strong>wheel</strong> isremoved for a particular defect.250002000015000100005000012000Wheel Impact Load, kipsFigure 11. CFCL Fleet Kip Distribution For Wheels.1000080006000400020000< 44KIPS45-49KIPS50-54KIPS55-59KIPS60-64KIPS65-69KIPS70-74KIPS75-79KIPS80-84KIPS85-89KIPS90-94KIPS95-99KIPS100-104KIPS105-109KIPS110-114KIPS115-119KIPS120-124KIPS125-129KIPS>130KIPSFigure 12. CFCL Wheelset Kip Distribution.CFCL assigns a “flag type” to <strong>wheel</strong>s with different wayside <strong>impact</strong> <strong>load</strong> <strong>detector</strong> kipvalues. A red flag is assigned to <strong>wheel</strong>s with greater than 90 kips, a yellow flag to an<strong>impact</strong> range <strong>of</strong> 66-90 kips, <strong>and</strong> no flag to <strong>impact</strong> readings less than 65 kips. Figure 13,14 <strong>and</strong> 15 show the <strong>impact</strong> <strong>load</strong> distribution for <strong>wheel</strong>s with no flag, yellow flag <strong>and</strong> redflag, respectively for the same day in June 2004. Yellow flag <strong>wheel</strong>s are scheduled forrepair in advance <strong>of</strong> being repaired by <strong>rail</strong>roads as this helps to control costs <strong>and</strong>prevent delays to <strong>load</strong>ed cars in service.
2500020000150001000050000 130Wheel Impact Load, kipsFigure 15. Red Flag Wheel Impact Load Distribution.
CFCL also looks for increases in empty car <strong>impact</strong> <strong>load</strong> readings. If a car can beshopped for <strong>wheel</strong>set changeout while empty, it will prevent delays to customershipments. Additionally, use <strong>of</strong> databases can allow for detection <strong>of</strong> repeat <strong>of</strong>fender cars<strong>and</strong> for root cause <strong>analysis</strong>.CONCLUDING REMARKSDetermination <strong>of</strong> <strong>wheel</strong> defect root cause is important for prevention <strong>of</strong> future <strong>wheel</strong>removals <strong>and</strong> keeping maintenance costs under control. Unfortunately, if a <strong>wheel</strong> isremoved for Why Made Code 65, the true reason for the <strong>wheel</strong> removal is not known.Was the air brake system on the car defective? Was the h<strong>and</strong>brake left applied <strong>and</strong> thecar moved? Without answers to such questions, problems will surely happen again.CFCL, like all private car owners, is dedicated to removing damaging <strong>wheel</strong>s fromservice. High <strong>impact</strong> <strong>wheel</strong>s, with <strong>impact</strong> <strong>load</strong>s over 90,000 pounds every 9.4 feet inservice (for a 36 inch diameter <strong>wheel</strong>), are not doing anyone or anything any good.However, an AAR sponsored study group recently concluded that 97% <strong>of</strong> the economicbenefits from WILD <strong>detector</strong>s will accrue to <strong>rail</strong>roads. A better system <strong>of</strong> sharing bothcosts <strong>and</strong> benefits with all stakeholders in the <strong>rail</strong>road industry will surely lead to bettercooperation <strong>and</strong> problem solving.Also, we feel that having private car owners take a more active role, perhaps even avoting role, in the AAR rule making process will be useful for our industry.REFERENCES1. Richard Sullivan, Cameron Lonsdale <strong>and</strong> John Coughlin, “1999 AAR Car RepairBilling Wheel Removal Analysis,” Proceedings <strong>of</strong> the Railway Wheel Manufacturers’Engineering Committee 2000 Technical Conference, C. P. Lonsdale, ed., RailwayWheel Manufacturers’ Engineering Committee, Chicago, IL, September 19, 2000, pp.38-46.2. Richard Sullivan, Cameron Lonsdale <strong>and</strong> Paul Kezmarsky, “2000 AAR Car RepairBilling Wheel Removal Analysis,” Proceedings <strong>of</strong> the Railway Wheel Manufacturers’Engineering Committee 2001 Technical Conference, C. P. Lonsdale, ed., RailwayWheel Manufacturers’ Engineering Committee, Chicago, IL, September 25, 2001, pp.32-42.3. Richard Sullivan, Cameron Lonsdale <strong>and</strong> John Oliver, “2001 AAR Car Repair BillingWheel Removal Analysis,” Proceedings <strong>of</strong> the Railway Wheel Manufacturers’Engineering Committee 2002 Technical Conference, C. P. Lonsdale, ed., RailwayWheel Manufacturers’ Engineering Committee, Chicago, IL, September 23, 2002, pp.22-30.4. Richard Sullivan, Cameron Lonsdale <strong>and</strong> John Oliver, “2002 AAR Car Repair BillingWheel Removal Analysis,” Proceedings <strong>of</strong> the Railway Wheel Manufacturers’Engineering Committee 2002 Technical Conference, C. P. Lonsdale, ed., RailwayWheel Manufacturers’ Engineering Committee, Chicago, IL, September 22, 2003, pp.19-29.
5. AAR 2003 Car Repair Billing Data, Association <strong>of</strong> American Railroads, Washington,D.C.6. AAR 2004 Field Manual <strong>of</strong> the Interchange Rules, Rule 41 – Wheels, Association <strong>of</strong>American Railroads, Washington, D. C.