

Report-Oregon-Property-Tax-Capitalization-FINAL
Report-Oregon-Property-Tax-Capitalization-FINAL
Report-Oregon-Property-Tax-Capitalization-FINAL

You also want an ePaper? Increase the reach of your titles
YUMPU automatically turns print PDFs into web optimized ePapers that Google loves.
22<br />
OREGON PROPERTY TAX CAPITALIZATION: EVIDENCE FROM PORTLAND<br />
IV. ESTIMATION RESULTS<br />
Tables II through V present regression results using variables and methodology discussed in<br />
previous sections. We estimated the effects of property tax capitalization using multiple<br />
specifications.<br />
Because the main purpose of this study is to<br />
estimate the effects of property tax<br />
differences on home values, we utilize three<br />
different measures of property taxes:<br />
AV/RMV ratio, combined AV/RMV ratio and<br />
compression ratio, and effective property<br />
tax rate (defined as taxes paid divided by<br />
RMV). All model specifications include the<br />
three measures, denoted as (a), (b) and (c),<br />
respectively. Across all three measures, we<br />
find that home values are generally higher<br />
when the property taxes are relatively lower<br />
compared to other properties with similar<br />
characteristics. However, the magnitude of<br />
influence varied significantly across model<br />
specifications.<br />
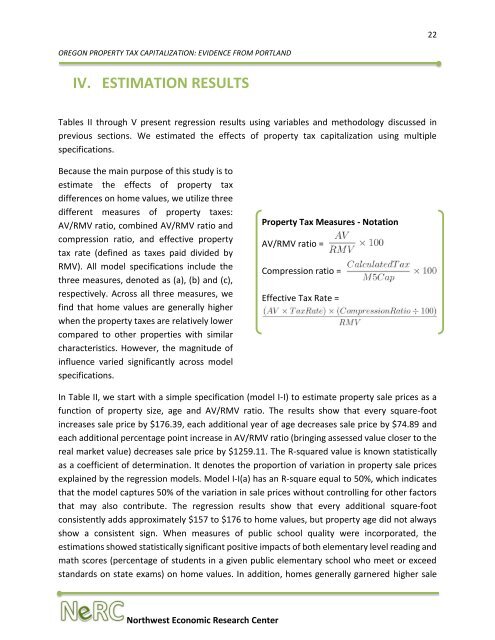
<strong>Property</strong> <strong>Tax</strong> Measures - Notation<br />
AV/RMV ratio =<br />
Compression ratio =<br />
Effective <strong>Tax</strong> Rate =<br />
In Table II, we start with a simple specification (model I-I) to estimate property sale prices as a<br />
function of property size, age and AV/RMV ratio. The results show that every square-foot<br />
increases sale price by $176.39, each additional year of age decreases sale price by $74.89 and<br />
each additional percentage point increase in AV/RMV ratio (bringing assessed value closer to the<br />
real market value) decreases sale price by $1259.11. The R-squared value is known statistically<br />
as a coefficient of determination. It denotes the proportion of variation in property sale prices<br />
explained by the regression models. Model I-I(a) has an R-square equal to 50%, which indicates<br />
that the model captures 50% of the variation in sale prices without controlling for other factors<br />
that may also contribute. The regression results show that every additional square-foot<br />
consistently adds approximately $157 to $176 to home values, but property age did not always<br />
show a consistent sign. When measures of public school quality were incorporated, the<br />
estimations showed statistically significant positive impacts of both elementary level reading and<br />
math scores (percentage of students in a given public elementary school who meet or exceed<br />
standards on state exams) on home values. In addition, homes generally garnered higher sale<br />
<strong>Oregon</strong>’s Electric Vehicle Industry<br />
Northwest Economic Research Center