ISO/TC 34/SC 005 - Izba Mleka
ISO/TC 34/SC 005 - Izba Mleka
ISO/TC 34/SC 005 - Izba Mleka

Create successful ePaper yourself
Turn your PDF publications into a flip-book with our unique Google optimized e-Paper software.
© <strong>ISO</strong> 2010 – All rights reserved© <strong>ISO</strong> 2010 – All rights reserved© <strong>ISO</strong> 2010 – All rights reserved<br />
<strong>ISO</strong>/<strong>ISO</strong>/<strong>ISO</strong>/<strong>TC</strong> <strong>34</strong><strong>34</strong><strong>34</strong>/<strong>SC</strong> <strong>005</strong><strong>005</strong><strong>005</strong><br />
Date: 2010-12-72010-12-72010-12-7<br />
<strong>ISO</strong>/DIS 16297<strong>ISO</strong>/DIS 16297<strong>ISO</strong>/DIS 16297<br />
IDF 161<br />
<strong>ISO</strong>/<strong>ISO</strong>/<strong>ISO</strong>/<strong>TC</strong> <strong>34</strong><strong>34</strong><strong>34</strong>/<strong>SC</strong> <strong>005</strong><strong>005</strong><strong>005</strong>/WG<br />
Secretariat: NENNENNEN<br />
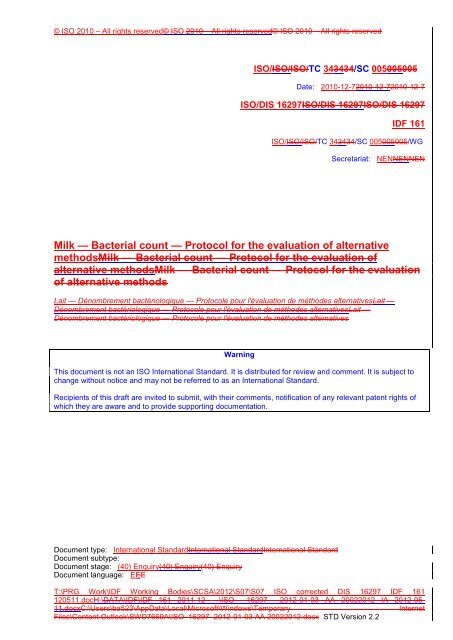
Milk — Bacterial count — Protocol for the evaluation of alternative<br />
methodsMilk — Bacterial count — Protocol for the evaluation of<br />
alternative methodsMilk — Bacterial count — Protocol for the evaluation<br />
of alternative methods<br />
Lait — Dénombrement bactériologique — Protocole pour l'évaluation de méthodes alternativesLait —<br />
Dénombrement bactériologique — Protocole pour l'évaluation de méthodes alternativesLait —<br />
Dénombrement bactériologique — Protocole pour l'évaluation de méthodes alternatives<br />
Warning<br />
This document is not an <strong>ISO</strong> International Standard. It is distributed for review and comment. It is subject to<br />
change without notice and may not be referred to as an International Standard.<br />
Recipients of this draft are invited to submit, with their comments, notification of any relevant patent rights of<br />
which they are aware and to provide supporting documentation.<br />
Document type: International StandardInternational StandardInternational Standard<br />
Document subtype:<br />
Document stage: (40) Enquiry(40) Enquiry(40) Enquiry<br />
Document language: EEE<br />
T:\PRG Work\IDF Working Bodies\<strong>SC</strong>SA\2012\S07\S07 <strong>ISO</strong> corrected DIS 16297 IDF 161<br />
120511.docH:\DATA\IDF\IDF 161 2011-12 ---\<strong>ISO</strong> 16297 2012-01-03 AA 20022012 IA 2012-05-<br />
11.docxC:\Users\ba523\AppData\Local\Microsoft\Windows\Temporary<br />
Internet<br />
Files\Content.Outlook\SWD7669A\<strong>ISO</strong> 16297 2012-01-03 AA 20022012.docx STD Version 2.2
<strong>ISO</strong>/DIS 16297<br />
Copyright notice<br />
This <strong>ISO</strong>-IDF document is an International Technical Specification and is copyright-protected by <strong>ISO</strong> and<br />
IDF. Except as permitted under the applicable laws of the user's country, neither this <strong>ISO</strong>-IDF document nor<br />
any extract from it may be reproduced, stored in a retrieval system or transmitted in any form or by any<br />
means, electronic, photocopying, recording or otherwise, without prior written permission being secured.<br />
Requests for permission to reproduce this document for the purpose of selling it should be addressed as<br />
shown below or to <strong>ISO</strong>'s member body in the country of the requester:<br />
<strong>ISO</strong> copyright office<br />
IDF Central Secretariat<br />
Case postale 56° Silver Building Boulevard Auguste Reyers 70<br />
CH-1211 Geneva 20 Swiss<br />
1030 Brussels Belgium<br />
Tel. + 41 22 749 01 11 Tel. + 32 2 733 98 88<br />
Fax + 41 22 749 09 47 Fax + 32 2 733 04 13<br />
E-mail copyright@iso.ch<br />
E-mail info@fil-idf.org<br />
Web www.iso.ch<br />
Web www.fil-idf.org<br />
Reproduction for sales purposes may be subject to royalty payments or a licensing agreement.<br />
Violators may be prosecuted.<br />
ii<br />
© <strong>ISO</strong> 2010 – All rights reserved© <strong>ISO</strong> 2010 – All rights<br />
reserved© <strong>ISO</strong> 2010 – All rights reserved
<strong>ISO</strong>/DIS 16297<br />
Contents<br />
Page<br />
Foreword ...................................................................................................................................................... iviviv<br />
Foreword ......................................................................................................................................................... vvv<br />
Introduction .................................................................................................................................................. vivivi<br />
1 Scope .................................................................................................................................................. 111<br />
2 Normative reference .......................................................................................................................... 111<br />
3 Terms and definitions ....................................................................................................................... 111<br />
4 Transformation of results ................................................................................................................. 111<br />
5 Attributes of the alternative method ................................................................................................ 111<br />
5.1 Description of the method to be evaluated......................................................................................... 2<br />
5.2 Measuring range .................................................................................................................................... 2<br />
5.3 Carry-over .......................................................................................................................................... 444<br />
5.4 Calibration and standardizationError! Bookmark not defined.Fel! Bokmärket är inte definierat.Fel! Bokmärket<br />
5.5 Precision............................................................................................................................................. 666<br />
5.6 Evaluation of factors affecting the results...................................................................................... 777<br />
6 The alternative method as an estimate of the reference method ................................................. 777<br />
6.1 Evaluation of factors affecting the estimation ............................................................................... 777<br />
6.2 Measurement protocol ...................................................................................................................... 888<br />
6.3 Calculations ....................................................................................................................................... 888<br />
6.4 Range of validity ................................................................................................................................ 988<br />
6.5 Accuracy of the estimate .................................................................................................................. 999<br />
6.6 Attributes of the alternative method expressed in units of the reference method .................... 999<br />
7 Rating of the elaborated attributes ............................................................................................ 101010<br />
Annex A (informative) EXPRESSION OF PRECISION PARAMETERS ................................................. 111111<br />
Bibliography .............................................................................................................................................. 121212<br />
© <strong>ISO</strong> 2010 – All rights reserved© <strong>ISO</strong> 2010 – All rights<br />
reserved© <strong>ISO</strong> 2010 – All rights reserved<br />
iii
<strong>ISO</strong>/DIS 16297<br />
Foreword<br />
<strong>ISO</strong> (the International Organization for Standardization) is a worldwide federation of national standards<br />
bodies (<strong>ISO</strong> member bodies). The work of preparing International Standards is normally carried out through<br />
<strong>ISO</strong> technical committees. Each member body interested in a subject for which a technical committee has<br />
been established has the right to be represented on that committee. International organizations, governmental<br />
and non-governmental, in liaison with <strong>ISO</strong>, also take part in the work. <strong>ISO</strong> collaborates closely with the<br />
International Electrotechnical Commission (IEC) on all matters of electrotechnical standardization.<br />
International Standards are drafted in accordance with the rules given in the <strong>ISO</strong>/IEC Directives, Part 2.<br />
The main task of technical committees is to prepare International Standards. Draft International Standards<br />
adopted by the technical committees are circulated to the member bodies for voting. Publication as an<br />
International Standard requires approval by at least 75 % of the member bodies casting a vote.<br />
Attention is drawn to the possibility that some of the elements of this document may be the subject of patent<br />
rights. <strong>ISO</strong> shall not be held responsible for identifying any or all such patent rights.<br />
<strong>ISO</strong> 16297|IDF 161 was prepared by Technical Committee <strong>ISO</strong>/<strong>TC</strong> <strong>34</strong>, Food products, Subcommittee <strong>SC</strong> 5,<br />
Milk and milk products and the International Dairy Federation (IDF). It is being published jointly by <strong>ISO</strong> and<br />
IDF.<br />
All work was carried out by the Joint <strong>ISO</strong>-IDF Project Group of the Standing Committee on Statistics and of<br />
Automation under the aegis of its project leader, Mrs. I. Andersson (SE) .<br />
iv<br />
© <strong>ISO</strong> 2010 – All rights reserved© <strong>ISO</strong> 2010 – All rights<br />
reserved© <strong>ISO</strong> 2010 – All rights reserved
<strong>ISO</strong>/DIS 16297<br />
Foreword<br />
IDF (the International Dairy Federation) is a non-profit organization representing the dairy sector worldwide.<br />
IDF membership comprises National Committees in every member country as well as regional dairy<br />
associations having signed a formal agreement on cooperation with IDF. All members of IDF have the right to<br />
be represented at the IDF Standing Committees carrying out the technical work. IDF collaborates with <strong>ISO</strong> in<br />
the development of standard methods of analysis and sampling for milk and milk products.<br />
The main task of Standing Committees is to prepare International Standards. Draft International Standards<br />
adopted by the Standing Committees are circulated to the National Committees for endorsement prior to<br />
publication as an International Standard. Publication as an International Standard requires approval by at least<br />
50 % of IDF National Committees casting a vote.<br />
Attention is drawn to the possibility that some of the elements of this document may be the subject of patent<br />
rights. IDF shall not be held responsible for identifying any or all such patent rights.<br />
<strong>ISO</strong> 16297|IDF 161 was prepared by Technical Committee <strong>ISO</strong>/<strong>TC</strong> <strong>34</strong>, Food products, Subcommittee <strong>SC</strong> 5,<br />
Milk and milk products and the International Dairy Federation (IDF). It is being published jointly by <strong>ISO</strong> and<br />
IDF.<br />
All work was carried out by Joint <strong>ISO</strong>-IDF Project Group (S07) of the Standing Committee on Statistics and<br />
Automation under the aegis of its project leader, Mrs. I. Andersson (SE) .<br />
This first edition of <strong>ISO</strong> 16297|IDF 161 cancels and replaces IDF 161A:1995, which has been technically<br />
revised.<br />
© <strong>ISO</strong> 2010 – All rights reserved© <strong>ISO</strong> 2010 – All rights<br />
reserved© <strong>ISO</strong> 2010 – All rights reserved<br />
v
<strong>ISO</strong>/DIS 16297<br />
Introduction<br />
Any quantitative measurement in microbiology should consider that the microbiological state in a sample must<br />
be regarded as one point within the co-ordinates of a multidimensional system, which is to be projected onto<br />
the one-dimensional scale of the method applied i.e. plate count, flow cytometry. Aspects such as flora (types<br />
and numbers of micro-organisms and their distribution), growth phase, sub-lethal damage, metabolic activity<br />
and history, influence to a greater or lesser extent any parameter that is measured. It is evident that any<br />
projection of an n-dimensional situation onto an one-dimensional scale is bound to provide a picture of the real<br />
situation that will be rather restricted. In this respect one has to bow to the inevitable, regardless of which<br />
method of measurement is preferred.<br />
The term reference (or official or anchor) method in this International Standard means a method internationally<br />
recognized by experts, used in legislation, or by agreement between the parties. The evaluation of an<br />
alternative method has to refer to the reference method and has to be based on the examination of suitable<br />
samples for its intended use.<br />
vi<br />
© <strong>ISO</strong> 2010 – All rights reserved© <strong>ISO</strong> 2010 – All rights<br />
reserved© <strong>ISO</strong> 2010 – All rights reserved
DRAFT INTERNATIONAL STANDARD <strong>ISO</strong>/DIS 16297<br />
Milk — Bacterial count — Protocol for the evaluation of<br />
alternative methods<br />
1 Scope<br />
This International Standard gives guidelines for the evaluation of alternative methods for bacterial count in raw<br />
milk from animals of different species.<br />
Note: The document is considered complementary to <strong>ISO</strong> 16140 and <strong>ISO</strong> 8196|IDF 128.<br />
2 Normative references<br />
The following referenced documents are indispensable for the application of this document. For dated<br />
references, only the edition cited applies. For undated references, the latest edition of the referenced<br />
document (including any amendments) applies.<br />
<strong>ISO</strong> 5725-1, Accuracy (trueness and precision) of measurement methods and results -- Part 1: General<br />
principles and definitions<br />
<strong>ISO</strong> 5725-2, Accuracy (trueness and precision) of measurement methods and results -- Part 2: Basic method<br />
for the determination of repeatability and reproducibility of a standard measurement method<br />
<strong>ISO</strong> 8196-1 | IDF 128-1, Milk — Definition and evaluation of the overall accuracy of alternative methods of<br />
milk analysis — Part 1: Analytical attributes of alternative methods<br />
<strong>ISO</strong> 8196-2 | IDF 128-2, Milk — Definition and evaluation of the overall accuracy of alternative methods of<br />
milk analysis — Part 2: Calibration and quality control in the dairy laboratory<br />
<strong>ISO</strong> 11095, Linear calibration using reference materials<br />
<strong>ISO</strong> 16140, Microbiology of Food and animal feeding stuffs – Protocol for the validation of alternative methods<br />
<strong>ISO</strong> 21187 | IDF 196:2004, Milk – Quantitative determination of bacteriological quality – Guidance for<br />
establishing a conversion relationship between routine method results and anchor method results and its<br />
verification<br />
3 Terms and definitions<br />
For the purposes of this document, the terms and definitions given in <strong>ISO</strong> 8196-1|IDF 128-1 and <strong>ISO</strong> 8196-<br />
2|IDF 128-2 apply.<br />
4 Transformation of results<br />
A prerequisite for statistics most common in the evaluation of measuring methods is the approximation of a<br />
normal distribution of the data. The exponential multiplication of microorganisms usually leads to a right-tailed<br />
distribution of quantitative microbiological parameters. Thus, in general transformation of the raw data is<br />
necessary for approximation of normality. This is usually a common logarithmic transformation or a square<br />
root transformation for low bacteria levels. The most appropriate transformation can be checked by comparing<br />
histograms. In the examples outlined in the following, not corresponding to low bacteria levels, common<br />
logarithmic transformation was used. All statistics are then computed from the transformed data and only the<br />
final results are re-transformed to give a more expressive idea of the situation to the user (see also Annex A).<br />
5 Attributes of the alternative method<br />
© <strong>ISO</strong> 2010 – All rights reserved© <strong>ISO</strong> 2010 – All rights<br />
reserved© <strong>ISO</strong> 2010 – All rights reserved<br />
1
<strong>ISO</strong>/DIS 16297<br />
NOTE The parameters outlined in the following text do not need to be evaluated completely for every alternative<br />
method. For example the measuring range (see 5.2) of the plate loop method is determined by the loop(s) used.<br />
NOTE<br />
Results are expressed in the units of the routine method unless specified otherwise.<br />
5.1 Description of the method to be evaluated<br />
5.1.1 Description<br />
The description of the method under study should be in line with the checklist in 5.1.2.<br />
Most of the information is found in the specification of the method given by the responsible supplier or any<br />
other source (author) of the described technique.<br />
5.1.2 Checklist<br />
a) Principle of the method.<br />
b) Parameter and/or unit.<br />
c) Technical design of the measurement procedure.<br />
d) Field of application:<br />
1) Purpose: for example, research, screening, milk grading, etc.;<br />
2) Substrate: for example, raw milk, fermented milk products. from cows<br />
e) Supplier(s) of instrument, reagents, standards.<br />
f) Specification of the method given by producer or author:<br />
1) Prerequisites for sampling (often compared to the situation of fat analysis);<br />
2) Possibilities for sample preservation (reagent(s), storage condition(s));<br />
3) Quantitative (units: method under study and/or reference method) and qualitative (the kind of microorganisms<br />
covered) spectrum;<br />
4) Precision (in units of the method under study and/or in reference method units);<br />
5) Accuracy of the estimate (in reference method units);<br />
6) Samples per hour;<br />
7) List of references.<br />
5.2 Measuring range<br />
5.2.1 Lower limit of quantification<br />
The lower limit of quantification is defined as the average of blank values of the reagents plus the n-fold of its<br />
standard deviation; generally, n = 10. See also <strong>ISO</strong> 16140.<br />
5.2.2 Upper limit of quantification<br />
2 © <strong>ISO</strong> 2010 – All rights reserved© <strong>ISO</strong> 2010 – All rights<br />
reserved© <strong>ISO</strong> 2010 – All rights reserved
<strong>ISO</strong>/DIS 16297<br />
The upper limit of quantification is determined by the highest possible reading of the method or<br />
methodological limitations, for example, coincidence effects, inaccuracy in the upper measuring range,<br />
clogging of filters. Coincidence is when two or more elements of the measurand are detected simultaneously<br />
and identified as only one unit. For example with flow cytometry, if two cells pass the detector simultaneously<br />
they will be detected as one. The coincidence effect will be higher with higher concentrations of a measurand.<br />
For the assessment of the upper limit of quantification the following procedure is recommended:<br />
A total of 10 milk samples with very high bacterial counts are diluted with low count milk in steps of 0,25 times<br />
the common logarithm, which is equivalent to a dilution factor of 1,78. Each dilution step is analysed.<br />
For each of the 10 samples a dilution that is not influenced by coincidence or methodological background<br />
noise is chosen as basis for the evaluation. Starting from the measuring value of this dilution step the<br />
expected values for each of the other dilution steps are computed.<br />
For a given level of measurand coincidence effect is characterized by the coincidence factor, that is the<br />
number or fraction of elements interpreted as only one and expressed by the ratio of expected value to the<br />
measured (observed) value<br />
f c = C exp /C obs , where<br />
C exp is the mean concentration expected from the dilution ratio;<br />
C obs is the mean concentration measured<br />
The coincidence factor is plotted against the measuring level. By visual inspection of the plot the values which<br />
are not yet influenced by coincidence can be derived. An example is given in Figure 1.<br />
In many cases it might be possible to correct for the coincidence effect, because in general it is a systematic<br />
effect and has a functional relation to the level of the parameter.<br />
10<br />
f c<br />
8<br />
6<br />
LOQ u<br />
4<br />
2<br />
0<br />
4 5 6 7<br />
x<br />
Key<br />
x<br />
f c<br />
Log bacterial count of milk samples<br />
Coincidence factor<br />
f c for individual milk samples<br />
Trendline<br />
Square markers<br />
Dashed line<br />
Solid line Coincidence factor: 1,0<br />
LOQ u<br />
Upper limit of quantification<br />
Figure 1 — Coincidence factor with regard to total bacterial count in raw milk<br />
© <strong>ISO</strong> 2010 – All rights reserved© <strong>ISO</strong> 2010 – All rights<br />
reserved© <strong>ISO</strong> 2010 – All rights reserved<br />
3
<strong>ISO</strong>/DIS 16297<br />
5.2.3 Linearity of the instrument signal<br />
The relationship between the instrument readings and the expected values should be linear within the<br />
concerned range of microbial bacterial counts. Deviations from linearity may stem from non-specific signals<br />
and coincidence effects.<br />
A linearity check is at first performed visually using appropriate figures graphsso as to obtain an clear picture<br />
impression of the shape of the relationship. Whenever deviation from linearity appears evident, a quantitative<br />
parameter is used as a testcalculated to indicate whether the observed trend is acceptable or not.<br />
To achieve this, use can be made of a high microbial bacterial count milk diluted serially with low microbial<br />
bacterial count milk, resulting in a set of at least five eight samples covering the concentration range of<br />
interest.<br />
Measure all samples at least four times and calculate the average result for each sample. This gives the<br />
measured value per sample. Use the measured values for Measure the high microbial count milk and the low<br />
microbial count milk in at least quadruplicate and calculate the average result for each sample. to Ccalculate<br />
values for the intermediate samples from the applied mixing ratios. per sample, resultingThis results in an<br />
expected value for each sample. Then measure all samples in at least quadruplicate and calculate the<br />
average result for each sample, which is equivalent to the measured value per sample. Aapply linear<br />
regression with the expected values per sample on the x-axis and the measured values per sample on the y-<br />
axis. Calculate the residuals e i = y i – (b*x i + a) from the regression. Plot the residuals e i (y axis) versus the<br />
expected values (x axis) on a graph. A visual inspection of the data points will usually yield sufficient<br />
information about the linearity of the signal. Any outlying residual should lead to delete deletion of the related<br />
result and to renewal of the calculation process before applying the further test.<br />
When observed, tThe curving can be expressed by the ratio, r, by using the following equation:<br />
r <br />
where<br />
<br />
e<br />
e<br />
<br />
max min<br />
( M<br />
max<br />
M<br />
min<br />
100<br />
)<br />
e max<br />
e min<br />
is the numerical value of the maximum residual from the regression;<br />
is the numerical value of the minimum residual from the regression;<br />
M max is the numerical value of the upper measured value for the concerned set of sampleshigh count<br />
milk;<br />
M min<br />
is the numerical value of the lower measured value for the concerned set of sampleslow count milk<br />
The ratio, r, should be less than 4 5 % (?).<br />
5.3 Carry-over<br />
Carry-over effects might occur in analytical systems that operate continuously. It derives from the transfer of a<br />
certain portion of sample material from one test sample to the next or further sample(s).<br />
Due to the design of the mechanized process of analysis not only the next sample but also samples in a later<br />
position can be influenced as e.g. due to incubation wellsvials with a periodic circulation.<br />
This effect can be tested by analysing consecutively milk with high bacterial count and blank samples. Carryover<br />
will cause an increase of blank sample values compared to normal blank sample value (value of blank<br />
sample analysed after another blank sample).<br />
The carry-over can be expressed as percentage of the corresponding preceding milk sample,<br />
4 © <strong>ISO</strong> 2010 – All rights reserved© <strong>ISO</strong> 2010 – All rights<br />
reserved© <strong>ISO</strong> 2010 – All rights reserved
<strong>ISO</strong>/DIS 16297<br />
For evaluation of carry-over, the number of samples and the bacterial count of the milk samples should be<br />
high enough to estimate the carry- over with sufficient certainty. The samples should be representative of the<br />
routine samples, especially regarding the storage time (longer storage time leading to higher milk viscosity<br />
and potentially higher carry over). Relative uncertainty of the estimation should be less than 20%. One way of<br />
setting up the test is described in the example below.<br />
For detailed and theoretical aspects and alternative setups of carry-over estimation it is referred to <strong>ISO</strong> 8196-3<br />
| IDF 128-3 [1].<br />
Example:<br />
One way to estimate the carry overcarry-over effect is to analyse at least 10 sets of samples, each set<br />
containing one milk sample with very high bacterial count followed by two blank samples. Blank samples could<br />
be water or milk with negligible bacterial count.<br />
(milk, blank 1 , blank 2 ) 1 , (milk, blank 1 , blank 2 ) 2 , … (milk, blank 1 , blank 2 ) n ,<br />
The relative carry-over (%) can be calculated for each sample set and then averaged:<br />
x 100,<br />
, where<br />
COR i = relative carry-over in the i th sample set<br />
c b1i = result of the first blank sample in the i th sample set<br />
c b2i = result of the second blank sample in the i th sample set<br />
c mi = result of the milk sample in the i th sample set<br />
COR = relative carry-over<br />
n = number of sample sets<br />
Even a very low carry-over effect might be relevant if the corresponding preceding sample has a very high<br />
level in comparison to the next one. It might even cause the result of the next sample to exceed a given limit.<br />
In many cases it is possible to correct for the carry-over effect, because, in general, it is a systematic effect<br />
and has a functional relation to the level of the corresponding preceding sample. Carry-over should preferably<br />
be below 1 %.<br />
An example of carry-over effect is given in Figure 2. The results of blank solutions analysed immediately after<br />
high count samples (blank 1 ) are plotted against the results of the corresponding preceding milk samples. From<br />
the graph the measuring level of preceding milk samples which can lead to an increase of the blank values<br />
above the accepted level can be derived. The relation between sample and blank values can be approximated<br />
by a function, e.g. a polynomial.<br />
© <strong>ISO</strong> 2010 – All rights reserved© <strong>ISO</strong> 2010 – All rights<br />
reserved© <strong>ISO</strong> 2010 – All rights reserved<br />
5
<strong>ISO</strong>/DIS 16297<br />
Key<br />
x<br />
Bacterial count of milk samples in units/ml<br />
Bacterial count of blank solution analysed after milk sample in<br />
units/ml<br />
Results with individual sample sets<br />
Trend line<br />
y<br />
Square markers<br />
Dashed line<br />
Solid line Carry-over: 0%<br />
Carry over in this example is 1%<br />
5.4 Stability<br />
Figure 2 — Carry-over effect with regard to total bacterial count in raw milk<br />
It is essential to check the stability of the instrument with suitable samples.<br />
For many microbiological methods, reference materials of the measured component are not available or its<br />
widespread application under field conditions is not possible, due to short shelf life and thus restricted<br />
transportability.<br />
This deficiency has to be compensated for by a reference material substitute or a ring test procedure. The<br />
relevant characteristics of a reference material substitute should be as similar as possible to the nature of the<br />
components and the substrate in which the measurement takes place.<br />
In those cases where reference material substitutes with longer shelf life are available, the stability of<br />
instrumental methods should be checked throughout the working day and also during the period between<br />
instrument standardization operations (quality control in the laboratory).<br />
Protocols for standardization and stability checks are described in <strong>ISO</strong> 8196-2 | IDF 128-2.<br />
5.5 Precision<br />
5.5.1 Terms and definitions<br />
For the definitions of precision, repeatability and reproducibility, and guidance on their determination, see <strong>ISO</strong><br />
5725-1, <strong>ISO</strong> 5725-2, <strong>ISO</strong> 8196-1|IDF 128-1 and <strong>ISO</strong> 16140.<br />
5.5.2 Repeatability<br />
6 © <strong>ISO</strong> 2010 – All rights reserved© <strong>ISO</strong> 2010 – All rights<br />
reserved© <strong>ISO</strong> 2010 – All rights reserved
<strong>ISO</strong>/DIS 16297<br />
The repeatability can be estimated from a large number (n = 50 - 100) of measurements in duplicate made<br />
from samples covering the whole measuring range. If the repeatability is dependent on the level, it should be<br />
specified as a function of the level, otherwise an average value will suffice.<br />
For total bacterial count Tthe acceptability limits for the intra-laboratory repeatability standard deviation (s r )<br />
are:<br />
0,09 log 10 units for contamination levels ≥ 2 x 10 4 cfu/ml<br />
0,12 log 10 units for contamination levels < 2 x 10 4 cfu/ml.<br />
5.5.3 Reproducibility<br />
The reproducibility should be estimated through an interlaboratory study according to <strong>ISO</strong>-5725-2 from<br />
duplicate measurements in representative samples at lower, medium and upper level in the measuring range,<br />
preferably obtained from at least 8 collaborators.<br />
The organizer, using all recorded data shall determine which results are suitable for use in data analysis. The<br />
organizer shall examine the raw data and other collected information to ascertain that all collaborators have<br />
performed the analyses as prescribed. When there is evidence that results might be obtained under<br />
inappropriate conditions and/or the method has not been followed strictly, these or all results from the<br />
collaborator are excluded for further analysis. No outlier tests are performed on the selected data.<br />
If no relationship exists between repeatabilty and the level, this can also be assumed to be true for the<br />
reproducibilty. If there is a relationship between the reproducibilty and the level, it should be specified.<br />
For total bacterial count tThe acceptability limit for the reproducibility standard deviation (s R ) is 0,16 log 10 units.<br />
5.6 Evaluation of factors affecting the results<br />
All non-bacteriological factors associated with the properties of the milk sample which could disturb the<br />
measurements by the alternative method should be evaluated. Examples of factors are somatic cell count,<br />
composition of milk, history of milk, sampling of milk, preservation of milk, species and breed of animals.<br />
It should be carefully considered which effects different factors may cause, and experiments should be<br />
designed taking these into account.<br />
Examples<br />
If it can be expected that the linearity may be affected by a certain factor (e.g. fat content), the linearity test<br />
should be repeated using samples with a low and high content of this affecting factor. If it is expected that the<br />
repeatability may be affected, the repeatability test should be repeated using samples with high and low<br />
content. Certain preservatives may affect the level of counts, to check for this analyse a series of samples with<br />
and without addition of preservative.<br />
6 The alternative method as an estimate of the reference method<br />
This clause addresses the analysis of the interrelations between the results of the alternative method and the<br />
reference method. For the establishment and verification of a conversion relationship, see <strong>ISO</strong> 21187 | IDF<br />
196.<br />
The analysis of the relation between two methods is based on the examination of test materials with both<br />
methods, covering the field of application and its spectrum of samples to be analysed with the method under<br />
study.<br />
6.1 Evaluation of factors affecting the estimation<br />
All factors (bacteriological and non-bacteriological) associated with the properties of the milk sample that<br />
could affect the estimation - that is, the relation between reference and routine method - are to be considered<br />
© <strong>ISO</strong> 2010 – All rights reserved© <strong>ISO</strong> 2010 – All rights<br />
reserved© <strong>ISO</strong> 2010 – All rights reserved<br />
7
<strong>ISO</strong>/DIS 16297<br />
in order to make sure that . Ssamples chosen to evaluate the relationship should beare representative to the<br />
normal routine samples regarding these properties.<br />
Factors influencing the relation can be bacteriological or non-bacteriological, for example.<br />
These influences can be type of bacteria, growth phase, storage condition, sample preservation, geographic<br />
differences, seasonal variations, species and breed of the animals from which the milk originates, method of<br />
milking, disinfection, feeding methods or individual supplier.<br />
6.2 Measurement protocol<br />
6.2.1 Design<br />
The evaluation of the alternative method as an estimate of the reference method requires a great amount of<br />
different samples (typically 100 per log step). A minimum number of samples can be calculated according to<br />
<strong>ISO</strong> 21187 | IDF 196:2004, Annex A.<br />
Samples should:<br />
a) be natural milk samples;<br />
b) uniformly cover the whole range of interest;<br />
c) be representative of the routine samples to be analysed especially taken into account the above<br />
mentioned factors.<br />
Samples are analysed in duplicate with the reference method as well as with the alternative method at the<br />
same time or close to it.<br />
6.3 Calculations<br />
6.3.1 Visual check of a scatter diagram<br />
Before any calculation is made a scatter diagram should be checked visually to obtain a first impression of the<br />
character of the relationship and determine whether the expected relationship between the methods is<br />
approximated.<br />
6.3.2 Regression<br />
To find a useful function to describe the relationship, several statistic approaches can be used which all have<br />
their particularities and limits, but by combining the results a sufficiently exact solution can be approximated.<br />
6.3.2.1 Regression models<br />
After suitable (usually logarithmic) data transformation, the relationship between the alternative method and<br />
the reference method is assumed to be linear within the range of interest. In that case the relationship can be<br />
calculated by means of a simple linear regression model (y = abx + ba).<br />
If the relationship is not linear, it is recommended to seek advice from a statistician. Methods to check for<br />
linearity are specified in <strong>ISO</strong> 8196-3 | IDF 128-3, or use a regression program which gives the probability of<br />
lack of fit or non-linearity.<br />
If the repeatability error on for one or both methods after data transformation is still dependent on the level,<br />
apply a weighted least-squares method in accordance with <strong>ISO</strong> 11095. In such cases, it is recommended to<br />
seek advice from a statistician.<br />
In the general case where regression is applied to calibration, the vertical y-axis (dependent variable) is used<br />
for the reference method and the horizontal x-axis (independent variable) is used for the alternative method<br />
8 © <strong>ISO</strong> 2010 – All rights reserved© <strong>ISO</strong> 2010 – All rights<br />
reserved© <strong>ISO</strong> 2010 – All rights reserved
<strong>ISO</strong>/DIS 16297<br />
(Ordinary Least Square regression) since it is assumed that the repeatability error of the reference method is<br />
generally much larger than the repeatability error of the alternative method (ratio >2). When necessary, the<br />
random error of the alternative method can be reduced with more replicates (see <strong>ISO</strong> 8196-2).<br />
6.3.2.2 Outliers<br />
Outliers should be carefully scrutinized. No data should be discarded unless there is a sound microbiological<br />
reason to do so. For outlier evaluation see <strong>ISO</strong> 21187 | IDF 196.<br />
6.4 Range of validity<br />
The range that can be adequately described by a chosen function shall be expressed in units of the reference<br />
method.<br />
6.5 Accuracy of the estimate<br />
The accuracy of the estimate is a measure of the reliability of the estimation of the value with one method from<br />
the measured value of the other.<br />
The residual standard deviation s y,x from the linear regression (y = abx + ba) gives an average measure for the<br />
accuracy of the estimate throughout the whole range where this linear regression is valid. It should be<br />
estimated for the circumstances that also apply in the routine application of the alternative method. If, for<br />
example, the alternative method is routinely applied in singular, single results of the alternative method<br />
against the average of duplicate results of the reference method should be used for the estimation of s y,x .<br />
In general the value of the reference method has to be estimated from the routine result. Thus, in accordance<br />
with <strong>ISO</strong> 8196-3 | IDF 128-3, the routine results are regarded as the independent variable x and the reference<br />
results as dependent variable y (see Figure 3). The accuracy of the estimate is expressed in units of the<br />
reference method and is independent on whether or not the method is properly calibrated and standardized.<br />
This has the advantage that different routine methods can be compared with respect to this attribute.<br />
For total bacterial count the acceptability limit for the accuracy standard deviation (s y,x ) is 0,40 log 10 units.<br />
6.6 Attributes of the alternative method expressed in units of the reference method<br />
Again, the results hereafter depend on the function by which the relation is described. Thus, the function used<br />
has to be clearly stated.<br />
After the appropriate regression function is identified, all attributes of the alternative method, which are<br />
expressed in the units of the alternative method, can be transformed onto the reference scale by using the<br />
regression formula.<br />
For all parameters elaborated in clause 5, which are expressed in the units of the alternative method,<br />
equivalence in units of the reference method can be computed using the regression function. If in the example<br />
given in Figure 3Fel! Hittar inte referenskälla., 5 000 units of the routine method (lg value = 3,7) corresponds<br />
to a certain attribute, e.g. the limit of quantification, that value has to be included in the regression function as<br />
x. The value calculated for y is the corresponding average reference value lg value =3,12 or 1 318 units).<br />
The corresponding confidence level can be derived by including sy,x.<br />
© <strong>ISO</strong> 2010 – All rights reserved© <strong>ISO</strong> 2010 – All rights<br />
reserved© <strong>ISO</strong> 2010 – All rights reserved<br />
9
<strong>ISO</strong>/DIS 16297<br />
Key<br />
x<br />
y<br />
Round markers<br />
Solid line<br />
Routine method results (logarithmic values)<br />
Reference/anchor method results (logarithmc values)<br />
Results of individual milk samples<br />
Trendline<br />
Figure 3 — Relation between the results of a routine method and a reference method<br />
In this way the measuring range (5.2), the carry-over (5.2.3) and the precision (5.5) of the alternative method<br />
can be translated onto the scale of the reference method. Thus, once evaluated for different alternative<br />
methods, these parameters can be compared.<br />
7 Rating of the elaborated attributes<br />
In general a final report should summarize the elaborated attributes of the alternative method under study. A<br />
rating of the results should be given by expert opinion, especially in the light of the requirements set for the<br />
alternative method by its intended use.<br />
Among others the following aspects might be of special importance.<br />
a) Range of the parameter of the routine method to be expected under the conditions of its intended use. For<br />
example with milk grading, the routine method should have adequate discriminative power in the range of<br />
interest, thereby also having still a margin for situations where a future shift to stricter grading limits is<br />
anticipated.<br />
b) If a grading scheme is not based on single results but on the averages of the results of several<br />
measurements (for example, throughout a month), an appropriate measuring range of the routine method<br />
with regard to the parameter’s distribution in the population is of special importance: low measurements<br />
must not be disturbed by method background noise, otherwise the "buffer" to compensate for accidentally<br />
high measurements in a series is lost. This may lead to an unfair grading.<br />
c) The representativeness of sampling and preservation facilities plays an important role in the rating of a<br />
routine method for the quantitative determination of the bacteriological quality of milk.<br />
10 © <strong>ISO</strong> 2010 – All rights reserved© <strong>ISO</strong> 2010 – All rights<br />
reserved© <strong>ISO</strong> 2010 – All rights reserved
<strong>ISO</strong>/DIS 16297<br />
Annex A<br />
(informative)<br />
Expression of precision parameters<br />
This tThe text in this Annex is in line toline with the one described bysuggestions prepared by Piton & Grappin<br />
[11].<br />
To take into account the fact that the logarithmic transformation of data does not provide parameters which<br />
are easy to use, it is proposed to characterize the repeatability and reproducibility of microbiological methods<br />
by the following three different parameters:<br />
a) the logarithmic standard deviation;<br />
b) the geometric relative standard deviation;<br />
c) the critical difference between duplicates.<br />
The repeatability and reproducibility standard deviations s r * and s R *, expressed on a logarithmic scale, are the<br />
most straightforward statistical parameters and should be reported.<br />
Unfortunately, these values cannot be used directly to draw inferences about the range of dispersion of results<br />
one may expect when performing replicate measurements. If the geometric mean = gives a<br />
satisfactory measure of the location of the median of the original log-normal population, the geometric<br />
standard deviation (s g = ) should be used as a multiplication factor to measure the dispersion of the data<br />
about the geometric mean.<br />
When considering the distribution curve of microbiological analytical data before and after logarithmic<br />
transformation, where z = lg x, the range for z of * ± s* is equivalent to that for x being obtained by multiplying<br />
and dividing by . In other words, * + s* is equivalent to × and * - s* is equivalent to / .<br />
A geometric coefficient of variation (GCV), expressed as a percentage, can be substituted, using the formula<br />
C V,g = ( 1) × 100. This GCV will be the second parameter to be used to characterize the repeatability<br />
and reproducibility of the method. For example, if s r * = 0,07, then C V,g = ( - 1) × 100 = 17,5 %. The limits<br />
of the range of variation of the original results about the geometric mean corresponding to ± s* will be<br />
× [(100+17,5)/100] = × 1,175 and / [(100 +17, 5)/100] = / 1,175.<br />
The third parameter, which is very useful for the analyst, is the critical relative difference between two<br />
measurements (or RD 95 ) which indicates that, when two measurements are performed according to the same<br />
technique under conditions of repeatability or reproducibility, the highest result should not exceed the lowest<br />
by more than ( - 1) x100 in 95 % of the cases. For example, with s r * = 0,07, the critical relative<br />
difference between two results is: RD 95 = ( - 1) x 100 = 57 %.<br />
In other words, when performing two independent measurements, the highest result should not exceed the<br />
lowest by more than 57 % in 95 % of cases. If the lowest result is 100 000 cfu/ml, the highest should be lower<br />
than 157 000 cfu/ml in 95 % of cases.<br />
© <strong>ISO</strong> 2010 – All rights reserved© <strong>ISO</strong> 2010 – All rights<br />
reserved© <strong>ISO</strong> 2010 – All rights reserved<br />
11
<strong>ISO</strong>/DIS 16297<br />
Bibliography<br />
[1] <strong>ISO</strong> 8196-3 | IDF 128-3, Milk — Definition and evaluation of the overall accuracy of alternative methods of<br />
milk analysis — Part 3: Protocol for the evaluation of alternative quantitative methods of milk analysis<br />
[2] Deming, W.E., Statistical Adjustment of Data. John Wiley & Sons, New York 1943.<br />
[3] GRAPPIN, R., DASEN, A., FAVENNEC, P., Numération automatique et rapide des bactéries du lait cru à l'aide<br />
du BactoScan [Rapid automatic enumeration of bacteria in untreated milk using BactoScan]. Lait 1985,<br />
65, pp. 123-147.<br />
[4] JARVIS, B., EASTER, M.C., Rapid methods in the assessment of microbiological quality; experiences and<br />
needs. Journal of Applied Microbiology 1987, 63, pp. 115s-126s.<br />
[5] KREYSZIG, E. 2 ed. Statistische Methoden und Anwendungen. Vandenhoeck und Ruprecht, Göttingen<br />
1967.<br />
[6] MANDEL, J., Fitting Straight Lines When Both Variables are Subject to Error. Journal of Quality Technology<br />
1984, 16, pp. 1-14.<br />
[7] MANNERS, J.G., Trends in microbiological testing of milk and dairy products. Australian Journal of Dairy<br />
Technology 1985, 40, pp. 73-75.<br />
[8] NIEUWENHOF, F.F.J., HOOLWERF, J.D., Suitability of Bactoscan for the estimation of the bacteriological<br />
quality of raw milk. Milchwissenschaft 1988, 43, pp. 577-580, 585-586.<br />
[9] NIEUWENHOF, F.F.J., HOOLWERF, J.D., LANGEVELD, L.P.M., WAALS, C.B.V.D., Modern methods of assessing<br />
the bacteriological quality of milk. Zuivelzicht 1985, 77, pp. 668-671, 699-701.<br />
[10] O'CONNOR, F., Rapid test methods for assessing microbiological quality of milk. Australian Journal of Dairy<br />
Technology 1984, 39, pp. 61-65.<br />
[11] PITON, C., GRAPPIN, R., A model for statistical evaluation of precision parameters of microbiological<br />
methods: application to dry rehydratable film methods and IDF reference methods for enumeration of total<br />
aerobic mesophilic flora and coliforms in raw milk. Journal - Association of Official Analytical Chemists<br />
1991, 74, pp. 92-103.<br />
[12] REICHMUTH, J., SUHREN, G., UBBEN, E.H., HEE<strong>SC</strong>HEN, W., Assessment of a routine method: suitability as<br />
measuring method with regard to the reference method by the example of fluorescence microscopic<br />
counting of individual microorganisms and macrocolony counting in raw milk. Kieler Milchwirtschaftliche<br />
Forschungsberichte 1989, 41, pp. 15-33.<br />
12 © <strong>ISO</strong> 2010 – All rights reserved© <strong>ISO</strong> 2010 – All rights<br />
reserved© <strong>ISO</strong> 2010 – All rights reserved