ANNEXURE OF TABLES - Teacher Education
ANNEXURE OF TABLES - Teacher Education
ANNEXURE OF TABLES - Teacher Education

Create successful ePaper yourself
Turn your PDF publications into a flip-book with our unique Google optimized e-Paper software.
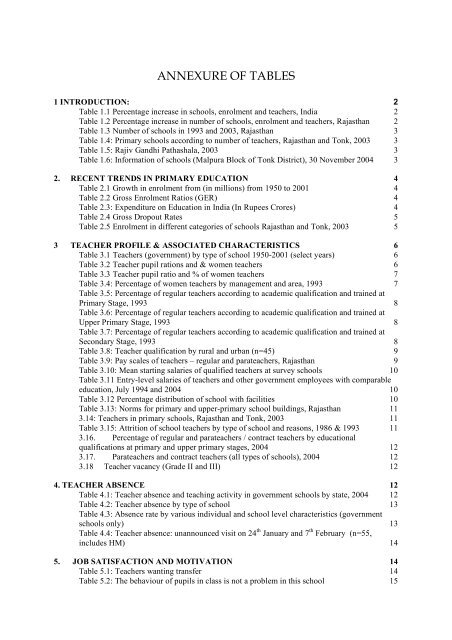
<strong>ANNEXURE</strong> <strong>OF</strong> <strong>TABLES</strong><br />
1 INTRODUCTION: 2<br />
Table 1.1 Percentage increase in schools, enrolment and teachers, India 2<br />
Table 1.2 Percentage increase in number of schools, enrolment and teachers, Rajasthan 2<br />
Table 1.3 Number of schools in 1993 and 2003, Rajasthan 3<br />
Table 1.4: Primary schools according to number of teachers, Rajasthan and Tonk, 2003 3<br />
Table 1.5: Rajiv Gandhi Pathashala, 2003 3<br />
Table 1.6: Information of schools (Malpura Block of Tonk District), 30 November 2004 3<br />
2. RECENT TRENDS IN PRIMARY EDUCATION 4<br />
Table 2.1 Growth in enrolment from (in millions) from 1950 to 2001 4<br />
Table 2.2 Gross Enrolment Ratios (GER) 4<br />
Table 2.3: Expenditure on <strong>Education</strong> in India (In Rupees Crores) 4<br />
Table 2.4 Gross Dropout Rates 5<br />
Table 2.5 Enrolment in different categories of schools Rajasthan and Tonk, 2003 5<br />
3 TEACHER PR<strong>OF</strong>ILE & ASSOCIATED CHARACTERISTICS 6<br />
Table 3.1 <strong>Teacher</strong>s (government) by type of school 1950-2001 (select years) 6<br />
Table 3.2 <strong>Teacher</strong> pupil rations and & women teachers 6<br />
Table 3.3 <strong>Teacher</strong> pupil ratio and % of women teachers 7<br />
Table 3.4: Percentage of women teachers by management and area, 1993 7<br />
Table 3.5: Percentage of regular teachers according to academic qualification and trained at<br />
Primary Stage, 1993 8<br />
Table 3.6: Percentage of regular teachers according to academic qualification and trained at<br />
Upper Primary Stage, 1993 8<br />
Table 3.7: Percentage of regular teachers according to academic qualification and trained at<br />
Secondary Stage, 1993 8<br />
Table 3.8: <strong>Teacher</strong> qualification by rural and urban (n=45) 9<br />
Table 3.9: Pay scales of teachers – regular and parateachers, Rajasthan 9<br />
Table 3.10: Mean starting salaries of qualified teachers at survey schools 10<br />
Table 3.11 Entry-level salaries of teachers and other government employees with comparable<br />
education, July 1994 and 2004 10<br />
Table 3.12 Percentage distribution of school with facilities 10<br />
Table 3.13: Norms for primary and upper-primary school buildings, Rajasthan 11<br />
3.14: <strong>Teacher</strong>s in primary schools, Rajasthan and Tonk, 2003 11<br />
Table 3.15: Attrition of school teachers by type of school and reasons, 1986 & 1993 11<br />
3.16. Percentage of regular and parateachers / contract teachers by educational<br />
qualifications at primary and upper primary stages, 2004 12<br />
3.17. Parateachers and contract teachers (all types of schools), 2004 12<br />
3.18 <strong>Teacher</strong> vacancy (Grade II and III) 12<br />
4. TEACHER ABSENCE 12<br />
Table 4.1: <strong>Teacher</strong> absence and teaching activity in government schools by state, 2004 12<br />
Table 4.2: <strong>Teacher</strong> absence by type of school 13<br />
Table 4.3: Absence rate by various individual and school level characteristics (government<br />
schools only) 13<br />
Table 4.4: <strong>Teacher</strong> absence: unannounced visit on 24 th January and 7 th February (n=55,<br />
includes HM) 14<br />
5. JOB SATISFACTION AND MOTIVATION 14<br />
Table 5.1: <strong>Teacher</strong>s wanting transfer 14<br />
Table 5.2: The behaviour of pupils in class is not a problem in this school 15
Table 5.3: <strong>Teacher</strong> transfers are managed well and fairly 15<br />
Table 5.4: <strong>Teacher</strong>s are respected in the community 15<br />
Table 5.5: Membership to trade union and mean number of meetings attended in the last year<br />
(n=45) 15<br />
1 Introduction:<br />
Table 1.1 Percentage increase in schools, enrolment and teachers, India<br />
INDIA<br />
Percentage increase in # of schools 1986-93 1993-2003<br />
Primary 7.89 14.18<br />
Upper Primary 17.11 50.65<br />
Secondary 24.74 38.43<br />
Higher Secondary 53.00 85.74<br />
Percentage increase in enrolment 1986-93 1993-2003<br />
Classes 1-5 12.94 26.15<br />
Classes 6-8 24.93 37.49<br />
Classes 9-10 32.11 43.21<br />
Classes 11-12 55.72 28.73<br />
Percentage increase in # of teachers 1986-93 1993-2003<br />
Primary 8.75 17.83<br />
Upper Primary 12.73 40.01<br />
Secondary 14.62 20.09<br />
Higher Secondary 44.30 68.68<br />
Source: 6th All India <strong>Education</strong>al Survey, 1998 and 7 th All India <strong>Education</strong>al Survey, NCERT, 2004<br />
Table 1.2 Percentage increase in number of schools, enrolment and teachers,<br />
Rajasthan<br />
Percentage increase in # of schools 1986-93 1993-2003<br />
Percentage Percentage<br />
Primary (regular) 18.67 -1.19*<br />
Upper Primary 22.10 127.80<br />
Secondary 51.16 68.65<br />
Higher Secondary 28.36 142.11<br />
Percentage increase in enrolment 1986-93 1993-2003<br />
Classes 1-5 19.69 55.09<br />
Classes 6-8 33.12 63.59<br />
Classes 9-10 45.02 44.40<br />
Classes 11-12 158.39 61.47<br />
Percentage increase in # of teachers 1986-93 1993-2003<br />
Primary NA 5.15<br />
Upper Primary NA 90.32<br />
Secondary NA 37.87<br />
Higher Secondary NA 58.09<br />
Source: 6th All India <strong>Education</strong>al Survey, 1998 and 7 th All India <strong>Education</strong>al Survey, NCERT, 2004
Table 1.3 Number of schools in 1993 and 2003, Rajasthan<br />
Number of regular school Number of regular school<br />
in 1993<br />
in 2003<br />
Primary (regular) 33349 32953<br />
Upper Primary 10176 23181<br />
Secondary 3330 5616<br />
Higher Secondary 1204 2915<br />
Source: 6th All India <strong>Education</strong>al Survey, NCERT, 1998 and 7 th All India <strong>Education</strong>al Survey,<br />
NCERT, 2004<br />
Table 1.4: Primary Schools According to Number of <strong>Teacher</strong>s Rajasthan and Tonk,<br />
2003<br />
Schools<br />
0 1 2 3 4 5<br />
More Than Having<br />
Total<br />
5<br />
Female<br />
<strong>Teacher</strong>s *<br />
Tonk, Rural 2 21 479 77 60 54 56 749 268<br />
Tonk, Urban 0 4 16 13 12 11 21 77 63<br />
Tonk, Total 2 25 495 90 72 65 77 826 331<br />
Rajasthan, Rural 73 3979 15279 4335 2412 1575 1785 29438 10496<br />
Rajasthan, Urban 24 198 855 607 508 499 824 3515 2700<br />
Rajasthan, Total 97 4177 16134 4942 2920 2074 2609 32953 13196<br />
Note: * -<strong>Teacher</strong>s include parateachers also but exclude part-time teachers<br />
Source: 7 th <strong>Education</strong>al Survey 2003, NCERT Website 2004<br />
Table 1.5: Rajiv Gandhi Pathashala, 2003<br />
District / State 2001-02 2002-03 2003-04<br />
Enrolment Centres Enrolment Centres Enrolment Centres<br />
Tonk District 14,346 428 20,732 332 17,616 342<br />
Rajasthan 7,61,651 21,339 12,13,574 20,559 13,34,435 21,306<br />
Source: Government of Rajasthan, December 2004<br />
Table 1.6: Information of Schools (Malpura Block of Tonk District), 30 November 2004<br />
Type of Schools<br />
Sr.<br />
Upper Shiksha<br />
Secondary Primary<br />
primary karmi<br />
Secondary<br />
Rajiv<br />
Gandhi<br />
Pathashala<br />
Alternative<br />
6 hours<br />
School<br />
Alternative<br />
4 hours Madarsa Total<br />
School<br />
Number of Schools 24 56 111 23 72 23 27 11 347<br />
Sanction Posts<br />
Of teachers<br />
72 329 344 60 86 26 29 17 963<br />
Filled Posts 72 320 308 60 84 24 29 17 914<br />
Vacant Posts 0 9 36 0 2 2 0 0 49<br />
Enrolment<br />
Boys 2305 6836 5190 850 2044 478 247 346 18296<br />
Girls 1018 5603 4843 721 1746 616 1100 349 15996<br />
Total 3323 12439 10033 1571 3790 1094 1347 695 34292<br />
Out of School children (According to survey done by teachers for SSA): 720<br />
Source: Block <strong>Education</strong> Officer, Tonk, December 2004
2. RECENT TRENDS IN PRIMARY EDUCATION<br />
Table 2.1 Growth in enrolment from (in millions) from 1950 to 2001<br />
Primary Upper Primary Secondary<br />
Year<br />
%<br />
%<br />
%<br />
Boys Girls Total Boys Girls Total Boys Girls Total<br />
Girls<br />
Girls<br />
Girls<br />
1950-51 13.8 5.4 19.2 28.13 2.6 0.5 3.1 16.13 1.3 0.2 1.5 13.33<br />
1960-61 23.6 11.4 35 32.57 5.1 1.6 6.7 23.88 2.7 0.7 3.4 20.59<br />
1990-91 57 40.4 97.4 41.48 21.5 12.5 34 36.76 12.8 6.3 19.1 32.98<br />
2000-01 64 49.8 113.8 43.76 25.3 17.5 42.8 40.89 16.9 10.7 27.6 38.77<br />
Source: Select <strong>Education</strong> Statistics, Department of <strong>Education</strong>, MHRD, GOI, 2000-01<br />
Years<br />
Table 2.2 Gross Enrolment Ratios (GER)<br />
(Includes underage and overage children. Therefore percentage may be more than 100)<br />
PRIMARY UPPER PRIMARY ELEMENTARY - CLASS 1 TO VIII<br />
BOYS GIRLS TOTAL BOYS GIRLS TOTAL BOYS GIRLS TOTAL<br />
1950-51 60.6 24.8 42.6 20.6 4.6 12.7 46.4 17.70 32.1<br />
1960-61 82.6 41.4 32.4 33.2 11.3 22.5 65.2 30.90 48.7<br />
1990-91 114 85.5 100.1 76.6 47 62.1 100 70.80 86<br />
2000-01* 104.9 85.9 95.7 66.7 49.9 58.6 90.3 72.40 81.6<br />
GROSS ENROLMENT RATIOS (GER) SC<br />
(Includes underage and overage children. Therefore percentage may be more than 100)<br />
1986-87 103.8 64.8 84.8 52.7 26.6 40.4 85.1 50.80 68.4<br />
1990-91 125.5 86.2 106.4 68.7 35.8 52.7 100.60 63.5 82.5<br />
2000-01* 107.3 85.8 96.8 76.2 53.3 65.3 97.3 75.50 86.8<br />
GROSS ENROLMENT RATIOS (GER) ST<br />
(Includes underage and overage children. Therefore percentage may be more than 100)<br />
1986-87 111 68 90.1 45.6 21.9 34.1 87.1 51.10 69.6<br />
1990-91 125.4 81.4 104 53.9 26.7 40.7 99.6 60.20 80.4<br />
2000-01* 116.9 85.5 101.1 72.5 47.7 60.2 102.5 73.50 88<br />
Source: Select <strong>Education</strong> Statistics, Department of <strong>Education</strong>, MHRD, GOI, 2000-01<br />
Table 2.3: Expenditure on <strong>Education</strong> in India (In Rupees Crores)<br />
Total<br />
GDP expenditure at % of education<br />
Total<br />
expenditure<br />
current prices (all expenditure to all<br />
expenditure<br />
on education<br />
factor cost) base sectors<br />
on all sectors<br />
and training<br />
year 1993-94 expenditure<br />
1951-51 64.46 814.13 10080 7.92 0.64<br />
1960-61 239.56 1997.93 16220 11.99 1.48<br />
1990-91 19615.85 14677.53 510954 13.37 3.93<br />
2000-01 77847 (BE) 574436.07 1895843 13.55<br />
% of education<br />
expenditure to<br />
GDP
Year<br />
Table 2.4 Gross Dropout Rates<br />
PRIMARY UPPER PR CLASS 1 TO X<br />
Boys Girls Total Boys Girls Total Boys Girls Total<br />
1960-61 61.7 70.9 64.9 75 85 78.3 NA NA NA<br />
1970-71 64.5 70.9 67 74.6 83.4 77.9 NA NA NA<br />
1980-81 56.2 62.5 58.7 68 79.4 72.7 79.8 86.60 82.5<br />
1990-91 40.1 46 42.6 59.1 65.1 60.9 67.5 76.90 71.3<br />
2000-01* 39.7 41.9 40.7 50.3 57.7 53.7 66.4 71.50 68.58<br />
Source: Select <strong>Education</strong> Statistics, Department of <strong>Education</strong>, MHRD, GOI, 2000-01<br />
Table 2.5 Enrolment in different categories of schools Rajasthan and Tonk, 2003<br />
District<br />
Primary Schools Upper Primary Schools Secondary Schools<br />
Boys Girls Total Boys Girls Total Boys Girls Total<br />
Tonk, Rural 40472 34511 74983 49628 30918 80546 12629 4292 16921<br />
Tonk, Urban 6779 7261 14040 13593 9246 22839 7071 3974 11045<br />
Tonk, Total 47251 41772 89023 63221 40164 103385 19700 8266 27966<br />
Rajasthan, Rural 1760483 1514184 3274667 2248033 1549534 3797567 655843 312523 968366<br />
Rajasthan, Urban 246673 238936 485609 654572 477942 1132514 362144 223257 585401<br />
Rajasthan, Total 2007156 1753120 3760276 2902605 2027476 4930081 1017987 535780 1553767<br />
Source: 7 th <strong>Education</strong>al Survey 2003, NCERT Website 2004
3 TEACHER PR<strong>OF</strong>ILE & ASSOCIATED<br />
CHARACTERISTICS<br />
Table 3.1 <strong>Teacher</strong>s (government) by type of school 1950-2001 (select years)<br />
In 000’<br />
Year<br />
Primary<br />
Upper primary High and higher secondary<br />
(Classes 1 to 5) (Classes 6 to 8) (Classes 9 to 12)<br />
Male Female Total Male Female Total Male Female Total<br />
1950-51 456 82 538 73 13 86 107 20 127<br />
1960-61 615 127 742 262 83 345 234 62 296<br />
1990-91 1143 473 1616 717 356 1073 917 417 1334<br />
1995-96 1176 558 1734 758 424 1182 1030 519 1549<br />
2000-01 1221 675 1896 820 506 1326 1184 577 1761<br />
Source: Selected <strong>Education</strong> Statistics, Government of India, 2001<br />
Table 3.2 <strong>Teacher</strong> pupil rations and & women teachers<br />
(Primary and Junior Basic Schools (upper primary))<br />
States Total teachers T P R Women % Women<br />
Andhra Pradesh 136879 47 48090 35.13<br />
Arunachal Pradesh 3229 35 991 30.69<br />
Assam 87009 38 25976 29.85<br />
Bihar 115486 63 22158 19.19<br />
Goa 2764 20 1020 36.90<br />
Gujarat 35040 51 17450 49.80<br />
Haryana 48199 43 23915 49.62<br />
Himachal Pradesh 27532 24 9660 35.09<br />
J & K 22113 30 8225 37.20<br />
Karnataka 60540 32 26408 43.62<br />
Kerala 45599 45 32669 71.64<br />
Madhya Pradesh 239414 44 68774 28.73<br />
Maharashtra 165875 35 82355 49.65<br />
Manipur 9412 21 3379 35.90<br />
Meghalaya 10978 41 5158 46.98<br />
Mizoram 4882 26 2360 48.34<br />
Nagaland 6847 26 2794 40.81<br />
Orissa 111040 37 27508 24.77<br />
Punjab 45907 41 29002 63.18<br />
Rajasthan 94812 54 26538 27.99<br />
Sikkim 3482 18 1583 45.46<br />
Tamil Nadu 120484 36 69565 57.74<br />
Tripura 13831 29 5428 39.25<br />
Uttar Pradesh 318992 42 82261 25.79<br />
West Bengal 150546 54 35147 23.35<br />
Source: Selected <strong>Education</strong> Statistics, Government of India, 2001<br />
(Number of teachers does not include parateachers)
Table 3.3 <strong>Teacher</strong> pupil ratio and % of women teachers<br />
(Middle and senior basic schools)<br />
States<br />
Total<br />
Women<br />
TPR<br />
teachers<br />
teachers<br />
% Women<br />
Andhra Pradesh 69117 47 29870 43.22<br />
Arunachal Pradesh 2630 35 717 27.26<br />
Assam 57059 38 11621 20.37<br />
Bihar 99181 63 22625 22.81<br />
Goa 678 20 429 63.27<br />
Gujarat 142200 51 69618 48.96<br />
Haryana 8119 43 2723 33.54<br />
Himachal Pradesh 6666 24 1660 24.90<br />
J & K 23362 30 8824 37.77<br />
Karnataka 142580 32 65823 46.17<br />
Kerala 48500 45 32428 66.86<br />
Madhya Pradesh 110843 44 33311 30.05<br />
Maharashtra 181340 35 73163 40.35<br />
Manipur 6730 21 2573 38.23<br />
Meghalaya 4743 41 1894 39.93<br />
Mizoram 4962 26 1210 24.39<br />
Nagaland 4919 26 2017 41.00<br />
Orissa 38914 37 5724 14.71<br />
Punjab 15584 41 8023 51.48<br />
Rajasthan 118650 54 30238 25.49<br />
Sikkim 1701 18 621 36.51<br />
Tamil Nadu 58395 36 24662 42.23<br />
Tripura 8811 29 1962 22.27<br />
Uttar Pradesh 106688 42 23890 22.39<br />
West Bengal 23346 54 5751 24.63<br />
Source: Selected <strong>Education</strong> Statistics, Government of India, 2001<br />
(Number of teachers does not include parateachers)<br />
Table 3.4: Percentage of women teachers by management and area, 1993<br />
Area/management Primary Upper primary Secondary Higher secondary Total<br />
Rural 23.50 25.40 23.09 17.84 23.46<br />
Urban 61.29 60.60 55.45 43.52 55.00<br />
Total 31.61 35.97 34.68 33.18 33.62<br />
Government 28.39 25.88 29.74 33.66 28.70<br />
Local Body 26.79 36.64 24.30 31.41 29.64<br />
Private aided 57.45 52.99 35.84 26.90 39.69<br />
Private Unaided 51.97 51.15 52.24 57.65 52.63<br />
Source: Sixth All India <strong>Education</strong>al Survey, NCERT, 1999
Table 3.5: Percentage of regular teachers according to academic qualification and<br />
trained at Primary Stage, 1993<br />
Area Trained Academic qualifications<br />
Up to<br />
secondary<br />
Higher<br />
secondary<br />
Graduate and<br />
above<br />
Total 86.68 53.31 24.72 22.45 0.52<br />
Rural<br />
Female 88.59 56.39 22.41 20.55 0.65<br />
SC 86.80 51.00 27.73 20.77 0.50<br />
Urban<br />
Total<br />
Other<br />
qualifications<br />
ST 62.91 60.98 25.79 12.75 0.48<br />
Total 80.58 39.14 21.67 38.44 0.77<br />
Female 81.77 40.76 20.33 38.14 0.77<br />
SC 85.77 49.74 22.42 27.00 0.84<br />
ST 73.48 57.20 22.98 19.14 0.68<br />
Total 85.13 48.96 23.75 26.51 0.58<br />
Female 85.43 49.13 21.46 28.71 0.71<br />
SC 86.63 50.80 26.88 21.77 0.55<br />
ST 63.69 60.63 25.53 13.34 0.50<br />
Table 3.6: Percentage of regular teachers according to academic qualification and<br />
trained at Upper Primary Stage, 1993<br />
Area Trained Academic qualifications<br />
Up to<br />
secondary<br />
Higher<br />
secondary<br />
Graduate and<br />
above<br />
Total 86.38 33.46 19.91 45.77 0.86<br />
Rural<br />
Female 88.97 42.67 17.23 38.99 1.11<br />
SC 88.68 37.52 22.78 39.04 0.66<br />
Urban<br />
Total<br />
Other<br />
qualifications<br />
ST 66.88 46.25 25.29 27.84 0.62<br />
Total 88.03 28.45 15.30 55.27 0.98<br />
Female 89.39 32.04 13.87 53.05 1.04<br />
SC 92.20 41.65 18.39 38.48 1.48<br />
ST 78.95 42.65 23.31 33.15 0.89<br />
Total 86.90 31.86 18.44 48.80 0.90<br />
Female 89.19 36.97 15.42 46.54 1.07<br />
SC 89.52 38.50 21.73 38.91 0.86<br />
ST 68.91 45.64 24.97 28.73 0.66<br />
Table 3.7: Percentage of regular teachers according to academic qualification and<br />
trained at Secondary Stage, 1993<br />
Area Trained Academic qualifications<br />
Up to<br />
secondary<br />
Higher<br />
secondary<br />
Graduate and<br />
above<br />
Total 89.41 0.00 69.32 29.45 1.23<br />
Rural<br />
Female 90.55 0.00 73.12 25.54 1.34<br />
SC 89.21 0.00 71.63 27.34 1.03<br />
Urban<br />
Total<br />
Other<br />
qualifications<br />
ST 69.05 0.00 81.11 18.03 0.86<br />
Total 93.39 0.00 61.06 38.00 0.94<br />
Female 94.06 0.00 60.64 38.55 0.81<br />
SC 94.37 0.00 66.10 32.95 0.95<br />
ST 81.31 0.00 75.19 23.92 0.89<br />
Total 91.03 0.00 65.97 32.91 1.12<br />
Female 92.74 0.00 65.34 33.62 1.01<br />
SC 90.99 0.00 69.72 29.28 1.00<br />
ST 72.81 0.00 79.30 18.83 0.87<br />
Source: 6 th All India <strong>Education</strong>al Survey 1993, NCERT, 1999
Table 3.8: <strong>Teacher</strong> qualification by rural and urban (n=45)<br />
<strong>Teacher</strong><br />
RURAL<br />
URBAN<br />
Qualification Female Male Female Male<br />
Degree 3 6 4 7<br />
Diploma 3 7 3 9<br />
Certificate 0 1 0 2<br />
None 0 0 0 0<br />
Source: Survey data<br />
Table 3.9: Pay scales of teachers – regular and parateachers, Rajasthan<br />
1990 1995 2000 2004<br />
Regular teachers<br />
Grade ► I II III I II III I II III I II III<br />
Pay scale<br />
2000<br />
to<br />
3500<br />
1400<br />
to<br />
2600<br />
1200<br />
to<br />
2050<br />
2000<br />
to<br />
3050<br />
1400<br />
to<br />
2600<br />
1200<br />
to<br />
2050<br />
6500<br />
to<br />
10500<br />
5500<br />
to<br />
9000<br />
4500<br />
to<br />
7000<br />
6500<br />
to<br />
10500<br />
5500<br />
to<br />
9000<br />
4500<br />
to<br />
7000<br />
Indicative total package▼<br />
Basic pay 2000 1400 1200 2000 1400 1200 6500 5500 4500 6500 5500 4500<br />
@ 38% of basic @ 125% of basic<br />
Dearness<br />
@ 38% of basic pay @ 61% of basic pay<br />
pay<br />
pay<br />
Allowance<br />
760 532 456 2550 1750 1500 2470 2090 1710 3965 3355 2745<br />
House rent<br />
allowance<br />
Other<br />
Allowance<br />
Retirement<br />
benefits<br />
Parateachers<br />
Shiksha<br />
Karmi<br />
(SKP)*<br />
Rajiv<br />
Gandhi<br />
Pathashala<br />
(RGP)<br />
Guest<br />
teacher<br />
Varied from place to place from Rs 30 a<br />
month up to Rs 250 per month.<br />
1987: Rs 600/-<br />
consolidated<br />
1993: Rs 900/-<br />
consolidated<br />
Not applicable<br />
@ 5% to 15% of<br />
basic pay<br />
@ 5% to 15% of<br />
basic pay + 50% DA<br />
CCA: Rs 25 to 240 depending on basic pay<br />
Since May 1995: Group personal accident insurance scheme<br />
covering from Rs 2000 to 2,00,000 on untimely death / accident.<br />
Premium of Rs 150/year.<br />
Pension: 50% of last pay drawn + DA declared from time to time.<br />
Medical reimbursement up to maximum of Rs 25,000/- per annum<br />
Rs 1,300<br />
consolidated<br />
Not applicable<br />
Rs 1800<br />
consolidated<br />
Rs 2000/- and a<br />
general increment of<br />
Rs 200 per year as<br />
per the norms of<br />
RGP<br />
2000 consolidated honorarium + increment<br />
of 200 after 2 years of satisfactory service<br />
Rs. 100/day up to a<br />
maximum of Rs<br />
2500/- per month<br />
*: SKP teachers with matric (10 years of general education) qualifications and have completed 8 years<br />
are them promoted as regular teachers in grade III. In case of non-matric SKP teachers can be<br />
promoted as regular teachers in grade III after 10 years. The promotion is conditional to participation<br />
in all in-service training programmes, successful result in the examinations conducted and<br />
demonstrating consistently good performance in the school (60% students passing the examination in<br />
the classes taught). As a result 665 SKP teachers were promoted to a regular teacher.
Table 3.10: Mean starting salaries of qualified teachers at survey schools<br />
Year Salary (Nominal) Constant prices<br />
1968 150 14<br />
1973 208 19<br />
1975 250 23<br />
1976 300 27<br />
1977 300 27<br />
1978 340 31<br />
1981 355 32<br />
1983 400 36<br />
1984 400 36<br />
1985 600 55<br />
1986 774 70<br />
1987 880 80<br />
1989 1050 95<br />
1990 1100 100<br />
1991 1700 155<br />
1994 2380 216<br />
1995 3000 273<br />
1997 3000 273<br />
1998 3000 273<br />
1999 4500 409<br />
2001 4500 409<br />
2003 4500 409<br />
Basic<br />
only<br />
Table 3.11 Entry-level salaries of teachers and other government employees with<br />
comparable education, July 1994 and 2004<br />
pay<br />
Primary<br />
teacher<br />
Constable<br />
Lower<br />
division<br />
clerk<br />
Head<br />
constable<br />
Upper<br />
division<br />
clerk<br />
Junior<br />
Accountant<br />
Revenue<br />
inspector<br />
Junior<br />
Engineer<br />
Trained<br />
Nurse<br />
1994 (Source: World Bank, 1997)<br />
Central<br />
Government<br />
1200 825 950 975 1200 1400 1400 1400 1400<br />
Rajasthan 1200 825 950 950 1200 1400 1400 1400 1400<br />
2004 (Source, Govt. of Rajasthan)<br />
Central<br />
Government<br />
4500 3050 3050 3200 4500 5000 5000 5000 4000<br />
Rajasthan 4500 3050 3050 3200 4500 5000 5000 5000 4000<br />
Note: 1994, Dearness Allowance (linked to cost of living index) at the rate of 116% of basic pay<br />
Percentage<br />
Schools with<br />
Table 3.12 Percentage distribution of school with facilities<br />
Rajasthan India (462)<br />
Primary Upper<br />
Primary<br />
Primary<br />
Primary<br />
with upper primary<br />
with upper<br />
only<br />
only<br />
primary only<br />
primary<br />
Upper<br />
primary<br />
only<br />
Boundary wall 54.53 19.71 18.68 65.79 40.39 62.23<br />
Pucca Building 79.01 89.06 89.75 70.19 70.77 61.76<br />
No building 14.84 1.54 2.98 6.34 2.65 13.27<br />
Single<br />
classroom<br />
4.24 0.67 1.98 15.74 2.11 4.61<br />
Two 42.70 3.55 4.13 35.65 8.28 10.33
classrooms<br />
Three and more<br />
classrooms<br />
34.63 92.14 86.78 36.89 84.42 65.42<br />
Single teacher 38.58 1.13 4.79 19.10 1.95 6.97<br />
2 <strong>Teacher</strong>s 37.02 4.73 8.10 43.67 6.02 17.94<br />
More than 3<br />
teachers<br />
22.78 92.35 85.62 35.85 90.65 73.61<br />
No blackboard 16.35 5.86 8.60 9.38 5.31 8.92<br />
With access to<br />
drinking water<br />
64.0 85.0 81.7 71.9 79.5 75.3<br />
Common toilet 28.63 59.91 58.35 29.06 48.28 39.18<br />
Girls toilet 13.43 42.65 44.13 15.64 33.89 28.14<br />
With electricity 7.15 40.44 52.56 12.35 46.04 19.17<br />
Playground 28.00 55.51 57.65 42.22 57.50 54.33<br />
Source: Dr Arun Mehta: Elementary <strong>Education</strong> in India, where do we stand? NIEPA, 2003<br />
Table 3.13: Norms for primary and upper-primary school buildings, Rajasthan<br />
S No Classes Number of rooms Measurement<br />
1 Classes 1 to 5 and 1 to 8 One for each class / section 24x20 feet per classroom<br />
2 Head teacher or head master One room 12x12 feet<br />
3 For drinking water One room / covered space 12x9 feet<br />
4 Store room One room - secure 12x9 feet<br />
Note: In rural areas the rooms for primary schools could be 12x10 feet. Where the enrolment is high<br />
the size of the room could be bigger.<br />
Source: Compilation of rules and regulation pertaining to education by Lalit Kishore, Unique traders,<br />
Jaipur 2004<br />
3.14: <strong>Teacher</strong>s in Primary Schools Rajasthan and Tonk, 2003<br />
District<br />
Full-time <strong>Teacher</strong>s Para-teachers Part-time <strong>Teacher</strong>s<br />
Male Female Total Male Female Total Male Female Total<br />
Tonk, Rural 1625 419 2044 1 68 69 34 21 55<br />
Tonk, Urban 143 212 355 0 1 1 0 1 1<br />
Tonk, Total 1768 631 2399 1 69 70 34 22 56<br />
Rajasthan, Rural 57509 18511 76020 162 1821 1983 702 442 1144<br />
Rajasthan, Urban 6234 8457 14691 7 13 20 172 259 431<br />
Rajasthan, Total 63743 26968 90711 169 1834 2003 874 701 1575<br />
Source: 7 th <strong>Education</strong>al Survey 2003, NCERT Website 2004<br />
Table 3.15: Attrition of School <strong>Teacher</strong>s by type of school and reasons, 1986 & 1993<br />
Type of<br />
schools<br />
Year Percentage teachers against number of teachers in the beginning of the<br />
academic session<br />
Retired Resigned Terminated Transferred Died Total<br />
Primary 1986 0.71 0.25 0.16 0.30 0.18 1.60<br />
1993 1.88 0.43 0.21 0.39 0.35 3.27<br />
Upper Primary 1986 0.64 0.36 0.16 0.30 0.16 1.62<br />
1993 1.68 0.64 0.22 0.32 0.28 3.13<br />
Secondary 1986 0.66 0.48 0.18 0.27 0.21 1.79<br />
1993 1.56 0.79 0.30 0.24 0.24 3.13<br />
Higher 1986 0.54 0.36 0.18 0.13 0.12 1.33<br />
Secondary 1993 1.89 0.64 0.19 0.20 0.25 3.17<br />
Source: Sixth All India <strong>Education</strong>al Survey, main report, NCERT, 1999
3.16. Percentage of regular and parateachers / contract teachers by educational<br />
qualifications at primary and upper primary stages, 2004<br />
Below Secondar Higher Secondar Graduat<br />
Secondar y secondar y + e and<br />
y education y Higher above<br />
education<br />
Secondar<br />
<strong>Education</strong>al<br />
level<br />
Regular<br />
<strong>Teacher</strong>s<br />
Parateacher<br />
s and<br />
contract<br />
teachers<br />
Higher<br />
Secondar<br />
y and<br />
above<br />
y<br />
Male 3.28 22.85 23.28 46.13 45.14 68.42<br />
Femal 3.67 26.67 23.05 49.72 42.30 65.35<br />
e<br />
Male 1.99 9.78 32.43 42.24 49.80 82.26<br />
2.39 12.12 34.17 46.29 45.45 79.62<br />
Femal<br />
e<br />
(Source: Dr. Arun Mehta. Presentation of 2004 DISE data, NIEPA January 2005)<br />
3.17. Parateachers and contract teachers (all types of schools), 2004<br />
State<br />
Number of parateachers Percentage<br />
/ Contract teachers<br />
Andhra Pradesh 19,844 8<br />
Bihar 17,833 7<br />
Chhattisgarh 28,703 11<br />
Madhya Pradesh 79,634 31<br />
Rajasthan 30,650 12<br />
Uttar Pradesh 35,495 14<br />
Other states 46,940 17<br />
All India 2,59,099 100<br />
(Source: Dr. Arun Mehta. Presentation of 2004 DISE data, NIEPA January 2005)<br />
3.18 <strong>Teacher</strong> vacancy (Grade II and III)<br />
Year Post Sanctioned No. of <strong>Teacher</strong>s Appointed Positions Vacant<br />
1997-1998<br />
Grade II 40,327<br />
Grade III 1,11,159 9,800,00 13,159<br />
1999-2000<br />
Grade II 41,904<br />
Grade III 1,74,528 1,08,480 66,048<br />
2000-2001<br />
Grade II 42,741<br />
Grade III 1,10,777 110,510 267<br />
2004-2005<br />
Grade II 36,708 - 36,708<br />
Grade III 49,710 33,264* 16,446<br />
*: Recruitment notified, applications screened. Final appointment may be done by the end of March<br />
2005 Source: Estimate of Income and Expenditure, Government of Rajasthan, India<br />
4. TEACHER ABSENCE<br />
Table 4.1: <strong>Teacher</strong> absence and Teaching activity in Government Schools by State, 2004<br />
State <strong>Teacher</strong> Absence % Non teaching activity %<br />
Maharashtra 14.6 40.7<br />
Gujarat 17.0 43.1
Madhya Pradesh 17.6 48.9<br />
Kerala 21.2 58.9<br />
Himachal Pradesh 21.2 56.9<br />
Tamil Nadu 21.3 50.4<br />
Haryana 21.7 56.4<br />
Karnataka 21.7 44.0<br />
Orissa 23.4 56.2<br />
Rajasthan 23.7 63.4<br />
West Bengal 24.7 53.9<br />
Andhra Pradesh 25.3 57.0<br />
Uttar Pradesh 26.3 55.3<br />
Chhattisgarh 30.6 80.7<br />
Uttaranchal 32.8 59.4<br />
Assam 33.8 64.5<br />
Punjab 34.4 67.8<br />
Bihar 37.8 73.6<br />
Jharkhand 41.0 75.3<br />
Delhi - -<br />
Weighted average 24.8 55.3<br />
Source: Kremer et al, <strong>Teacher</strong> Absence in India, 2004<br />
Table 4.2: <strong>Teacher</strong> absence by type of school<br />
Government<br />
Schools<br />
Private Aided<br />
Schools<br />
Private (Unaided)<br />
Schools<br />
Weighted teacher absence 24.8% 20.7% 22.8%<br />
Percentage of teaching activity 44.8% 58.8% 48.5%<br />
Number of observations (Absent) 34918 3371 9098<br />
Source: Kremer et al, <strong>Teacher</strong> Absence in India, 2004<br />
Table 4.3: Absence rate by various individual and school level characteristics<br />
(Government Schools only)<br />
Category Proportion of Sample Absence Rate<br />
Rich State (96-97 per capita income > $ 275) 56.3 21.7<br />
Poor State (96-97 per capita income < $ 275) 43.7 28.0<br />
Female teachers 51.4 21.9<br />
Male teachers 48.6 27.2<br />
Married 86.7 22.5<br />
Unmarried 13.3 23.8<br />
Have children of school going age (5-14) 37.2 21.3<br />
Don’t have children of school going age 62.8 23.5<br />
40 years or below 46.5 21.4<br />
Older than 40 years 53.3 27.1<br />
Head <strong>Teacher</strong> 20.4 30.2<br />
Deputy Head <strong>Teacher</strong> 5.7 22.2<br />
Permanent / regular <strong>Teacher</strong> 66.8 23.1<br />
Contract <strong>Teacher</strong> 4.7 24.1<br />
Informal <strong>Teacher</strong> 1.1 23.5<br />
Probationary / Temporary <strong>Teacher</strong> 1.3 24.3<br />
Completed 5 th grade 0.2 21.8<br />
Completed 8 th Grade 1.2 20.6<br />
Completed 10 th Grade 33.5 22.1<br />
Completed 12 th Grade 22.7 21.3
Completed Bachelors Degree 23.9 24.2<br />
Completed Masters degree or more 13.6 24.1<br />
School has a toilet for teachers 46.9 21.6<br />
School does not have a toilet for teachers 53.1 27.1<br />
School has electricity connection 40.0 19.2<br />
School does not have electricity connection 60.0 28.2<br />
Commutes < 30 minutes 63.7 21.4<br />
Commutes = or > 30 minutes 36.3 25.2<br />
Rural School 71.5 25.2<br />
Urban School 28.5 22.9<br />
Head-teacher is absent (but school is open) 71.5 22.2<br />
Head-teacher is present (and school is open) 28.5 18.5<br />
School inspected in the past 3 months 40.4 21.0<br />
Not inspected in the past 3 months 59.6 27.0<br />
Belongs to this town/village 32.2 21.6<br />
Does not belong to this town/village 67.8 23.3<br />
PTA has met in the past 3 months 35.6 21.0<br />
PTA has not met in the past 3 months 64.4 26.5<br />
Note: The weighted average across these categories will often be lower than the total absence rate,<br />
because of missing individuals level correlates on teachers who are repeatedly absent<br />
Source: Kremer et al, <strong>Teacher</strong> Absence in India, 2004<br />
Table 4.4: <strong>Teacher</strong> absence: unannounced visit on 24 th January and 7 th February (n=55,<br />
includes HM)<br />
Rural Urban<br />
<strong>Teacher</strong>s present 26 25<br />
<strong>Teacher</strong>s on leave 0 3<br />
Absent without leave letter 0 0<br />
On government duty 0 1<br />
Note: As Panchayat elections were underway and several senior politicians were touring the state for<br />
election campaigns, teacher attendance rates were unusually good. This may not reflect the situation in<br />
normal times.<br />
5. JOB SATISFACTION AND MOTIVATION<br />
Table 5.1: <strong>Teacher</strong>s wanting transfer<br />
RURAL URBAN<br />
Female Male Female Male<br />
Wanting transfer 2 4 2 2<br />
Wanting transfer out of district 0 0 0 0<br />
Source: Survey data
Table 5.2: The behaviour of pupils in class is not a problem in this school<br />
All RURAL URBAN<br />
Male Female Male Female<br />
Strongly disagree 2 0 0 2 0<br />
Disagree 10 2 1 7 0<br />
Not sure 1 0 0 1 0<br />
Agree 32 12 5 8 7<br />
Strongly Agree 0 0 0 0 0<br />
Source: Survey data (personal statements)<br />
Table 5.3: <strong>Teacher</strong> transfers are managed well and fairly<br />
All RURAL URBAN<br />
Male Female Male Female<br />
Strongly disagree 18 6 2 7 3<br />
Disagree 16 5 2 6 3<br />
Not sure 3 2 0 1 0<br />
Agree 7 0 2 4 1<br />
Strongly Agree 1 1 0 0 0<br />
Source: Survey data (personal statements)<br />
Table 5.4: <strong>Teacher</strong>s are respected in the community<br />
All RURAL URBAN<br />
Male Female Male Female<br />
Strongly disagree 3 0 0 3 0<br />
Disagree 9 2 0 4 3<br />
Not sure 6 2 1 3 0<br />
Agree 27 10 5 8 4<br />
Strongly Agree 0 0 0 0 0<br />
Source: Survey data (personal statements)<br />
Table 5.5: Membership to trade union and mean number of meetings attended in the<br />
last year (n=45)<br />
RURAL<br />
URBAN<br />
Female Male Female Male<br />
Union members (number of<br />
teachers)<br />
6 14 6 18<br />
Not a member of any union 1<br />
Mean number meetings 2 9 3 7<br />
Source; Survey data