ANNEXURE OF TABLES - Teacher Education
ANNEXURE OF TABLES - Teacher Education
ANNEXURE OF TABLES - Teacher Education

You also want an ePaper? Increase the reach of your titles
YUMPU automatically turns print PDFs into web optimized ePapers that Google loves.
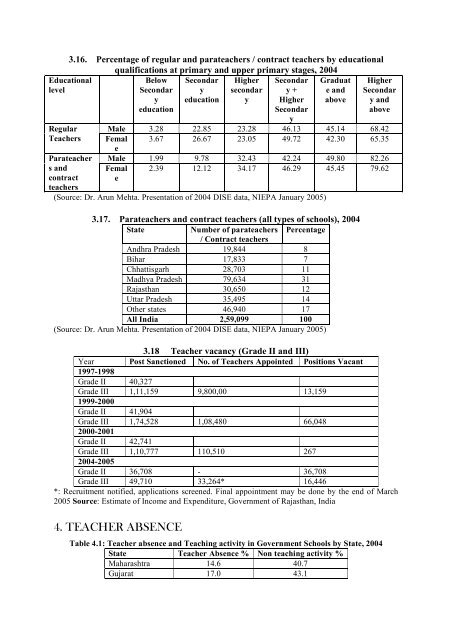
3.16. Percentage of regular and parateachers / contract teachers by educational<br />
qualifications at primary and upper primary stages, 2004<br />
Below Secondar Higher Secondar Graduat<br />
Secondar y secondar y + e and<br />
y education y Higher above<br />
education<br />
Secondar<br />
<strong>Education</strong>al<br />
level<br />
Regular<br />
<strong>Teacher</strong>s<br />
Parateacher<br />
s and<br />
contract<br />
teachers<br />
Higher<br />
Secondar<br />
y and<br />
above<br />
y<br />
Male 3.28 22.85 23.28 46.13 45.14 68.42<br />
Femal 3.67 26.67 23.05 49.72 42.30 65.35<br />
e<br />
Male 1.99 9.78 32.43 42.24 49.80 82.26<br />
2.39 12.12 34.17 46.29 45.45 79.62<br />
Femal<br />
e<br />
(Source: Dr. Arun Mehta. Presentation of 2004 DISE data, NIEPA January 2005)<br />
3.17. Parateachers and contract teachers (all types of schools), 2004<br />
State<br />
Number of parateachers Percentage<br />
/ Contract teachers<br />
Andhra Pradesh 19,844 8<br />
Bihar 17,833 7<br />
Chhattisgarh 28,703 11<br />
Madhya Pradesh 79,634 31<br />
Rajasthan 30,650 12<br />
Uttar Pradesh 35,495 14<br />
Other states 46,940 17<br />
All India 2,59,099 100<br />
(Source: Dr. Arun Mehta. Presentation of 2004 DISE data, NIEPA January 2005)<br />
3.18 <strong>Teacher</strong> vacancy (Grade II and III)<br />
Year Post Sanctioned No. of <strong>Teacher</strong>s Appointed Positions Vacant<br />
1997-1998<br />
Grade II 40,327<br />
Grade III 1,11,159 9,800,00 13,159<br />
1999-2000<br />
Grade II 41,904<br />
Grade III 1,74,528 1,08,480 66,048<br />
2000-2001<br />
Grade II 42,741<br />
Grade III 1,10,777 110,510 267<br />
2004-2005<br />
Grade II 36,708 - 36,708<br />
Grade III 49,710 33,264* 16,446<br />
*: Recruitment notified, applications screened. Final appointment may be done by the end of March<br />
2005 Source: Estimate of Income and Expenditure, Government of Rajasthan, India<br />
4. TEACHER ABSENCE<br />
Table 4.1: <strong>Teacher</strong> absence and Teaching activity in Government Schools by State, 2004<br />
State <strong>Teacher</strong> Absence % Non teaching activity %<br />
Maharashtra 14.6 40.7<br />
Gujarat 17.0 43.1