ANNEXURE OF TABLES - Teacher Education
ANNEXURE OF TABLES - Teacher Education
ANNEXURE OF TABLES - Teacher Education

Create successful ePaper yourself
Turn your PDF publications into a flip-book with our unique Google optimized e-Paper software.
Year<br />
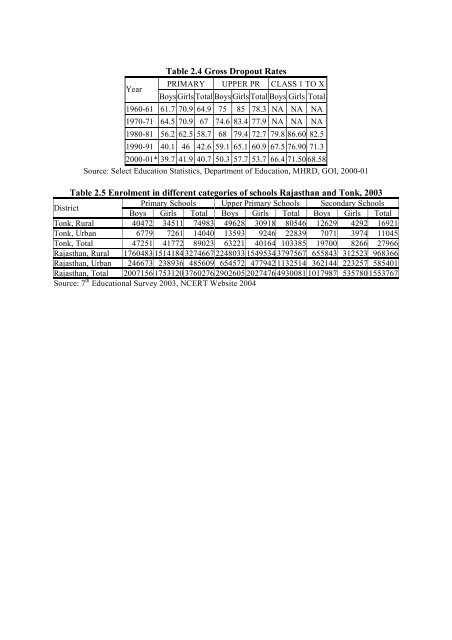
Table 2.4 Gross Dropout Rates<br />
PRIMARY UPPER PR CLASS 1 TO X<br />
Boys Girls Total Boys Girls Total Boys Girls Total<br />
1960-61 61.7 70.9 64.9 75 85 78.3 NA NA NA<br />
1970-71 64.5 70.9 67 74.6 83.4 77.9 NA NA NA<br />
1980-81 56.2 62.5 58.7 68 79.4 72.7 79.8 86.60 82.5<br />
1990-91 40.1 46 42.6 59.1 65.1 60.9 67.5 76.90 71.3<br />
2000-01* 39.7 41.9 40.7 50.3 57.7 53.7 66.4 71.50 68.58<br />
Source: Select <strong>Education</strong> Statistics, Department of <strong>Education</strong>, MHRD, GOI, 2000-01<br />
Table 2.5 Enrolment in different categories of schools Rajasthan and Tonk, 2003<br />
District<br />
Primary Schools Upper Primary Schools Secondary Schools<br />
Boys Girls Total Boys Girls Total Boys Girls Total<br />
Tonk, Rural 40472 34511 74983 49628 30918 80546 12629 4292 16921<br />
Tonk, Urban 6779 7261 14040 13593 9246 22839 7071 3974 11045<br />
Tonk, Total 47251 41772 89023 63221 40164 103385 19700 8266 27966<br />
Rajasthan, Rural 1760483 1514184 3274667 2248033 1549534 3797567 655843 312523 968366<br />
Rajasthan, Urban 246673 238936 485609 654572 477942 1132514 362144 223257 585401<br />
Rajasthan, Total 2007156 1753120 3760276 2902605 2027476 4930081 1017987 535780 1553767<br />
Source: 7 th <strong>Education</strong>al Survey 2003, NCERT Website 2004