Expansion of North East India's Trade and Investment with ...
Expansion of North East India's Trade and Investment with ...
Expansion of North East India's Trade and Investment with ...

You also want an ePaper? Increase the reach of your titles
YUMPU automatically turns print PDFs into web optimized ePapers that Google loves.
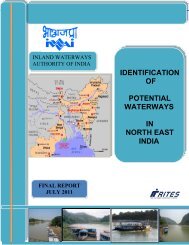
<strong>Expansion</strong> <strong>of</strong> <strong>North</strong> <strong>East</strong> <strong>India's</strong> <strong>Trade</strong><br />
<strong>and</strong> <strong>Investment</strong> <strong>with</strong><br />
Bangladesh <strong>and</strong> Myanmar<br />
An Assessment <strong>of</strong> the<br />
Opportunities <strong>and</strong> Constraints<br />
RIS<br />
Research <strong>and</strong> Information System<br />
for Developing Countries<br />
Ministry <strong>of</strong> Development <strong>of</strong><br />
<strong>North</strong> <strong>East</strong>ern Region<br />
<strong>North</strong> <strong>East</strong>ern Council
EXPANSION OF NORTH EAST INDIA’S TRADE AND<br />
INVESTMENT WITH BANGLADESH AND MYANMAR<br />
AN ASSESSMENT OF THE OPPORTUNITIES AND<br />
CONSTRAINTS<br />
October 2011
Contents<br />
Acknowledgements<br />
iii<br />
Executive Summery 1<br />
1. Introduction 12<br />
2. State <strong>of</strong> the NER Economies 18<br />
3. NER-Bangladesh Border <strong>Trade</strong>: Emerging Pattern 26<br />
4. NER-Myanmar Border <strong>Trade</strong>: Emerging Pattern 50<br />
5. Field Survey Results 65<br />
6. Policy Recommendations <strong>and</strong> the Way Forward 92<br />
ii
Acknowledgements<br />
The Report has been prepared by a research team comprising <strong>of</strong> Dr. Biswajit Dhar <strong>and</strong><br />
Dr. Prabir De <strong>of</strong> RIS; Dr. Gurudas Das, National Institute <strong>of</strong> Technology (NIT) Silchar; <strong>and</strong><br />
Pr<strong>of</strong>. E. Bijoy Singh, Department <strong>of</strong> Economics, University <strong>of</strong> Manipur, Imphal. We would<br />
like to thank Ms. Poulomi Dasgupta for her diligent assistance. Usual disclaimers apply.<br />
iii
Executive Summary<br />
India’s <strong>North</strong> <strong>East</strong>ern Region (hereinafter NER) has 9 per cent <strong>of</strong> India’s geographical area<br />
<strong>and</strong> contributes 3 per cent to the country’s gross domestic product (GDP). In relative terms, it<br />
is one <strong>of</strong> India’s economically laggard regions. However, given its natural resources base <strong>and</strong><br />
strategic location, NER has the potential to become India’s “powerhouse” in terms <strong>of</strong> trade<br />
<strong>and</strong> investment. Although the NER is rich in resources like hydrocarbons <strong>and</strong> other minerals,<br />
<strong>and</strong> has immense potential to produce hydroelectricity, absence <strong>of</strong> adequate infrastructure has<br />
impeded its development.<br />
NER is unique in terms <strong>of</strong> the economic opportunities it <strong>of</strong>fers. About 98 per cent <strong>of</strong> the<br />
region’s borders form India’s international boundaries; it shares borders <strong>with</strong> China,<br />
Bangladesh, Bhutan <strong>and</strong> Myanmar. Given its strategic location, the region can be developed<br />
as a base for India’s growing economic links not only <strong>with</strong> the Association <strong>of</strong> Southeast<br />
Asian Nations (ASEAN) but also <strong>with</strong> neighbouring countries, viz. Bangladesh, Bhutan, <strong>and</strong><br />
Nepal.<br />
Over the past several years, India has been a part <strong>of</strong> a number <strong>of</strong> regional <strong>and</strong> sub-regional<br />
initiatives that countries in South <strong>and</strong> South <strong>East</strong> Asia have taken to deepen their economic<br />
integration. These include the South Asian Free <strong>Trade</strong> Agreement (SAFTA), which is the<br />
first step towards an eventual South Asian Economic Union, the Bay <strong>of</strong> Bengal Initiative for<br />
Multi-sectoral Technical <strong>and</strong> Economic Cooperation (BIMSTEC) 1 <strong>and</strong> the Asia-Pacific <strong>Trade</strong><br />
Agreement (APTA) 2 . Further, as a part <strong>of</strong> its “Look <strong>East</strong>” policy, India has increased its<br />
engagements <strong>with</strong> the members <strong>of</strong> the ASEAN <strong>and</strong> countries belonging to the <strong>East</strong> Asia<br />
Summit (EAS) 3 . As is clear from Figure 1, the centrality <strong>of</strong> the NER is critical in effectively<br />
pursuing these initiatives.<br />
1 Members <strong>of</strong> BIMSTEC are Bangladesh, India, Myanmar, Sri Lanka, Thail<strong>and</strong>, Bhutan <strong>and</strong> Nepal.<br />
2 Members are Bangladesh, India, Lao People’s Democratic Republic, the Republic <strong>of</strong> Korea <strong>and</strong> Sri Lanka<br />
3 EAS Summit includes ASEAN plus India, Australia, New Zeal<strong>and</strong>, China, Japan <strong>and</strong> Korea.<br />
1
Figure 1: NER as India’s Gateway to the <strong>East</strong><br />
Notes:<br />
* South Asia Sub-regional Economic Cooperation (SASEC)<br />
** Mekong-Ganga Cooperation<br />
***Greater Mekong Sub-region (GMS)<br />
$ Bangladesh, China, India, Myanmar Forum on Regional Cooperation<br />
Set against this backdrop, the present study attempts to better underst<strong>and</strong> the existing level <strong>of</strong><br />
trade links through both formal <strong>and</strong> informal channels between India <strong>and</strong> its neighbours<br />
around the country’s <strong>North</strong> <strong>East</strong> by focusing on two <strong>of</strong> its neighbours, viz. Bangladesh <strong>and</strong><br />
Myanmar. More specifically, the study analyses the scope <strong>of</strong> utilising nine L<strong>and</strong> Customs<br />
Stations (LCSs) for improving border trade <strong>with</strong> two countries. Three sets <strong>of</strong> issues are<br />
examined in the study. These are: (a) pattern <strong>of</strong> border trade between India <strong>and</strong> its two<br />
neighbours <strong>and</strong> the possibilities <strong>of</strong> exp<strong>and</strong>ing it; (b) supply-side constraints that may exist in<br />
the NER which inhibit India’s two-way trade <strong>with</strong> its two neighbours; <strong>and</strong> (c) exploring<br />
India’s investment opportunities in Bangladesh <strong>and</strong> Myanmar <strong>with</strong> buy-back provisions that<br />
can promote border trade through the LCSs.<br />
Formal trade links between India <strong>and</strong> its two neighbours, Bangladesh <strong>and</strong> Myanmar, have<br />
remained at a very low level. While the share <strong>of</strong> Bangladesh in India’s total trade was about<br />
0.6 per cent in 2009-10, Myanmar had an even smaller share <strong>of</strong> about 0.3 per cent. In<br />
absolute terms, India’s two-way trade <strong>with</strong> Bangladesh increased from US$ 1.8 billion in<br />
2005-06 to US$ 2.6 billion in 2009-10. It should be pointed out that the level <strong>of</strong> two-way<br />
trade between the two dipped slightly in 2009-10 from the record level <strong>of</strong> US$ 3.2 billion<br />
registered in the immediately preceding year. In the same period, India’s two-way trade <strong>with</strong><br />
Myanmar grew almost three-fold between 2005-06 <strong>and</strong> 2009-10 to reach US$ 1.5 billion.<br />
2
These low levels <strong>of</strong> trade do not factor in the informal trade that takes place through the local<br />
trade points, which have not been systematically recorded thus far. People living in the border<br />
regions have had economic <strong>and</strong> cultural links going back to several centuries <strong>and</strong> drawing <strong>of</strong><br />
the political boundaries has failed to severe their ties. The interdependence <strong>of</strong> the peoples on<br />
the two sides <strong>of</strong> the political boundaries has given rise to informal channels <strong>of</strong> trade in goods<br />
<strong>and</strong> services. In fact, much <strong>of</strong> the trade taking place through the borders are through informal<br />
arrangements, including through the border haats, whose importance seems to have hardly<br />
diminished despite the restrictions that have come into being in the past few decades.<br />
Informal trade has thus provided sustenance to the economies <strong>of</strong> the region.<br />
The importance <strong>of</strong> border trade is immense for the NER, for it brings direct tangible benefits<br />
to the region. However, border trade involving both Bangladesh <strong>and</strong> Myanmar face a plethora<br />
a problems. Supply-side constraints, among others, are inhibiting two-way trade across the<br />
borders <strong>with</strong> its two neighbours. There is urgent need to strengthen not only transport <strong>and</strong><br />
communication infrastructure but also the institutional support for enhancing the existing<br />
level <strong>of</strong> trade <strong>and</strong> economic linkages.<br />
Government <strong>of</strong> India has taken initiatives to improve the policy regime aimed at promoting<br />
trade on the borders <strong>with</strong> both Myanmar <strong>and</strong> Bangladesh. India concluded a border trade<br />
agreement <strong>with</strong> Myanmar in 1994, which allows border trade to take place initially through<br />
two points i.e. Moreh <strong>and</strong> Champhai, <strong>and</strong> subsequently through any other points to be<br />
identified by mutual agreement. The border trade agreement allowed 22 locally produced<br />
commodities to be traded by people living along both sides <strong>of</strong> India-Myanmar Border, as per<br />
the prevailing customary practice including the barter mechanism. In 2008, the two countries<br />
took several significant decisions regarding the existing border trade arrangements. One,<br />
trade through the Moreh-Tamu <strong>and</strong> Zokhawthar-Rhi border points was upgraded to normal<br />
trade. All goods except a h<strong>and</strong>ful <strong>of</strong> restricted items were allowed to be traded at these points<br />
at MFN rates. Two, decision was also taken to open a new border trade point at Avakhung-<br />
Leshi. Three, the list <strong>of</strong> list <strong>of</strong> items for barter trade identified under the 1994 Agreement was<br />
exp<strong>and</strong>ed to 40. And, finally a decision was taken to operationalise new banking arrangement<br />
for trade.<br />
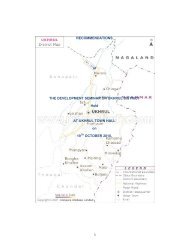
Border trade arrangements between India <strong>and</strong> Bangladesh remained largely undeveloped until<br />
the decision was taken by the Prime Ministers <strong>of</strong> the two countries in January 2010 to<br />
establish border haats. A formal agreement was signed in October 2010 to establish border<br />
haats, as a pilot project, at two locations. The two countries also agreed to open border haats<br />
in other locations based on factors like historical location, difficulty in access,<br />
interdependence <strong>of</strong> the population on both sides <strong>of</strong> the border <strong>and</strong> availability <strong>of</strong> suitable<br />
location.<br />
NER-Bangladesh Border <strong>Trade</strong>: Emerging Pattern<br />
Resource-industry linkages determine the pattern <strong>of</strong> India-Bangladesh border trade taking<br />
place through the NER. Some critical minerals, which are available in the NER but not in<br />
Bangladesh, provide the basis <strong>of</strong> NER-Bangladesh trade. What follows is that NER’s exports<br />
to Bangladesh are distinctly different from major export lines from rest <strong>of</strong> India to<br />
Bangladesh. The product-wise trade between NER <strong>and</strong> Bangladesh indicates a<br />
complementarity between the resource availability in the NER <strong>and</strong> the dem<strong>and</strong> structure <strong>of</strong><br />
Bangladesh. Bangladesh lacks mineral resources like coal <strong>and</strong> limestone which the country<br />
3
imports from the NER. In return, the NER imports finished products from Bangladesh. This<br />
provides a firm basis for trade expansion between the two regions.<br />
To summarise, the following are the features <strong>of</strong> India-Bangladesh border trade:<br />
(a) Exports from NER to Bangladesh dominate NER-Bangladesh trade.<br />
(b) The NER exports raw materials like coal, limestone, stone chips, bamboo, to<br />
Bangladesh <strong>and</strong> imports finished products like cement, plastic goods, readymade<br />
garments, process food <strong>and</strong> drinks.<br />
(c) Minerals from Meghalaya are exported to Bangladesh through the LCSs <strong>of</strong> Assam <strong>and</strong><br />
Meghalaya.<br />
(d) <strong>Trade</strong> flows through Tripura-Bangladesh sector is dominated by imports from<br />
Bangladesh.<br />
(e) As the resource structure <strong>of</strong> the NER <strong>and</strong> dem<strong>and</strong> structure <strong>of</strong> Bangladesh are<br />
complementary to each other, there exists a huge potential for trade between these two<br />
regions. As the NER exports industrial raw material to Bangladesh, trend <strong>of</strong> the NER’s<br />
export is found to be stable.<br />
(f) Export trade in exhaustible resources like coal <strong>and</strong> limestone suffers from severe<br />
limitations in that the trade dries up <strong>with</strong> the depletion <strong>of</strong> stock <strong>of</strong> resources. As a result,<br />
for sustainable growth it is important to diversify the export basket <strong>and</strong> also to add<br />
value to export by switching over from export <strong>of</strong> raw materials to export <strong>of</strong><br />
processed/semi-processed goods.<br />
<strong>Trade</strong> between NER <strong>and</strong> Myanmar<br />
At present, four LCSs are in operation, through which trade between India <strong>and</strong> Myanmar is<br />
conducted.<br />
Moreh in Manipur is the busiest LCS, h<strong>and</strong>ling almost 99 per cent <strong>of</strong> the NER’s trade <strong>with</strong><br />
Myanmar. Exports through Moreh LCS increased from US$ 0.1 million in 1995-96 to a peak<br />
<strong>of</strong> US$ 13.5 million in 2006-07 <strong>and</strong> then declined to US$ 1.5 million in 2009-10. Imports, on<br />
the other h<strong>and</strong>, witnessed relatively less fluctuations, increasing from US$ 1.7 million in<br />
1995-96 to US$ 2.1 million in 2009-10. The interesting development is that the second half<br />
<strong>of</strong> previous decade witnessed a rise in Indian export through Moreh, compared to previous<br />
two periods, whereas import declined consistently from US$ 72 billion in 1995-96/1999-2000<br />
to US$ 38 billion in 2005-06/2009-10.<br />
The field survey conducted across nine LCSs in the NER clearly shows the LCSs suffer from<br />
tremendous ‘infrastructure deficit’. Unavailability <strong>of</strong> electricity, bad road, manual h<strong>and</strong>ling <strong>of</strong><br />
goods, unfriendly exchange rate <strong>and</strong> many such barriers are making the trade at border a<br />
costly affair. Undoubtedly, these are the barriers which are prohibiting the <strong>of</strong>ficial trade to<br />
grow at the NER. As a result, un<strong>of</strong>ficial (informal) trade is very much rampant. Although<br />
congestion at border is not a problem in the NER, unfriendly trading environment is making<br />
the trade expensive. The field survey shows transaction costs at LCSs are very high, which<br />
vary between Rs. 2500 to Rs. 500 per transaction. The high transaction cost at border can be<br />
4
mitigated through implementation <strong>of</strong> trade facilitation measures <strong>and</strong> policies, one which<br />
should focus on reducing the number <strong>of</strong> agencies providing clearances.<br />
Our assessment is that trade creation can take place only if measures are taken, in particular<br />
to improve the quality <strong>of</strong> infrastructure at border, connectivity to the rest <strong>of</strong> state <strong>and</strong> the<br />
region <strong>and</strong> improvements in the supply capacities from the Indian side. Informal/illegal trade<br />
is a feature <strong>of</strong> border trade taking place <strong>with</strong> both neighbours. This trade is taking place<br />
through well-established trade points that have historically been by the people <strong>of</strong> the region.<br />
The informal/illegal trade taking place through Moreh-Tamu is thriving on the back <strong>of</strong> the<br />
supplies being provided by both China <strong>and</strong> Thail<strong>and</strong>. As a result, trade comprises <strong>of</strong> products<br />
that are well beyond the 40 items that have been identified by India <strong>and</strong> Myanmar as a part <strong>of</strong><br />
their Border <strong>Trade</strong> Agreement <strong>of</strong> 1994, as amended in 2008. The magnitude <strong>of</strong><br />
informal/illegal trade taking place on Moreh-Tamu border may prompt the authorities to put<br />
regulations to check the growth <strong>of</strong> this trade. In this context, our assessment is that since the<br />
trade point existing in Moreh symbolises the historical links that existed between the people<br />
living in the border areas, it would makes little economic sense to impose policy induced<br />
barriers. Rather, steps must be taken to recognise the so-called informal trade <strong>and</strong> to get it<br />
included in the formal statistics. Further, the available infrastructure <strong>and</strong> connectivity must be<br />
improved to enable greater trade flows to take place through border trade points like Moreh.<br />
Our view is that trade flows can be improved by adopting two sets <strong>of</strong> strategies for<br />
Bangladesh <strong>and</strong> Myanmar. In case <strong>of</strong> the former, there are immense possibilities <strong>of</strong><br />
promoting vertical trade or “fragmentation”, provided appropriate investments are made on<br />
two sides or the border on activities that give rise to trade complementarities. For instance,<br />
the NER, which is a hub <strong>of</strong> fresh fruits <strong>and</strong> vegetables, can act as a source <strong>of</strong> raw materials<br />
for the upcoming food processing sector in Bangladesh. Furthermore, Indian entrepreneurs<br />
<strong>and</strong> technologists can help strengthen the food processing sector by extending the<br />
development <strong>of</strong> this sector. And, finally, this investment should take up primarily in the SME<br />
sector.<br />
Yet another sector that can be considered in this regard is the textiles <strong>and</strong> clothing sector.<br />
NER has traditionally been a treasure trove <strong>of</strong> h<strong>and</strong>loom <strong>and</strong> niche fabrics like the “Assam<br />
muga”. Although the uniqueness <strong>of</strong> “Assam muga” has been recognised through the grant <strong>of</strong><br />
“geographical indication”, the artisans have remained in the poverty trap because <strong>of</strong><br />
inadequate dem<strong>and</strong> for their product. Linking the “Assam muga” producers to the clothing<br />
industry would provide a definite boost to these producers.<br />
While the above examples were intended to highlight the potential for vertical integration that<br />
exists between the NER <strong>and</strong> Bangladesh, the strategic imperative <strong>of</strong> promoting these<br />
activities cannot be overlooked. As mentioned above, promotion <strong>of</strong> such activities would lead<br />
to strong trade complementarities, thus promoting trade between the two countries. Thus,<br />
India’s exports <strong>of</strong> raw materials can be matched by its imports <strong>of</strong> processed products from<br />
Bangladesh. This pattern <strong>of</strong> trade will enable Bangladesh to export higher value added<br />
products <strong>and</strong> can thus help reduce its large trade imbalance <strong>with</strong> India.<br />
In case <strong>of</strong> border trade <strong>with</strong> Myanmar, efforts would have to be made by both Government <strong>of</strong><br />
Manipur <strong>and</strong> the Government <strong>of</strong> India to address the supply-bottlenecks that have caused a<br />
huge trade imbalance against India in the trade taking place through the informal trade point,<br />
or “Gate No. 2”. There is evidence <strong>of</strong> dem<strong>and</strong> for Indian products in Myanmar <strong>and</strong> therefore<br />
it is important to widen the market for these products. While the market for traditional<br />
products is well recognised, it is important that non-traditional products are identified for<br />
possible export to Myanmar.<br />
5
Government <strong>of</strong> Manipur has been arguing that industrialization must precede the opening up<br />
<strong>of</strong> trade. The Government has argued that local industry like agro-processing, horticulture,<br />
textiles, etc. must be encouraged through the employment-led expansion <strong>of</strong> the regional<br />
market, which can result in substitution <strong>of</strong> imported product <strong>with</strong> local produce while at the<br />
same time servicing external dem<strong>and</strong>. It has further been pointed out that there is ample scope<br />
for the development <strong>of</strong> manufacturing/processing units for medicines, rubber goods, cycles<br />
<strong>and</strong> cycle parts, pharmaceuticals, edible oils, petroleum products, cement, cotton yarns, etc.<br />
We would argue that a well-honed strategy, which has a medium-term perspective, needs to<br />
be put in place. This strategy should be developed in the context <strong>of</strong> the closer economic<br />
integration that India is seeking <strong>with</strong> its immediate neighbourhood, the ASEAN region.<br />
While the infrastructure needs have been given serious attention, including the discussions on<br />
the Asia Highway Project that would go through Moreh, the stakeholders seem to be some<br />
distance away from putting in place plans that would help in exploiting the markets in the<br />
South <strong>East</strong> Asia. From India’s point <strong>of</strong> view, the lack <strong>of</strong> initiative on this score seems<br />
particularly stark given that the country had signed the India-ASEAN Free <strong>Trade</strong> Agreement<br />
almost a year <strong>and</strong> a half ago, <strong>and</strong> that the first phase <strong>of</strong> implementation <strong>of</strong> this FTA have<br />
already been gone through since the FTA became operational in January 2010.<br />
Policy Recommendations <strong>and</strong> the Way Forward<br />
NER is critically located for it holds the key to India’s economic integration efforts <strong>with</strong> its<br />
neighbours in South <strong>and</strong> South <strong>East</strong> Asia. A logical starting point for an exercise for<br />
enhancing trade <strong>and</strong> investment cooperation involving the neighbouring countries, <strong>with</strong><br />
whom India shares common l<strong>and</strong> frontiers, is to study the dynamics <strong>of</strong> trade taking place<br />
through the local trade points. Over the years, both the Government <strong>of</strong> India <strong>and</strong> the<br />
Governments <strong>of</strong> the State where these trade points exist, have realised the importance <strong>of</strong><br />
these trade points <strong>and</strong> have set up L<strong>and</strong> Customs Stations (LCSs) <strong>with</strong> the objective <strong>of</strong><br />
brining the informal/illegal trade taking place onto the formal channels. An elaborate plan has<br />
now been drawn up to convert a number <strong>of</strong> these LCSs into Integrated Check Posts (ICPs),<br />
which would provide better facilities to the traders.<br />
The recommendations <strong>of</strong> this study are presented in four parts. The first relates to the policy<br />
measures that are needed to provide impetus to border trade. The second would cover the<br />
infrastructure <strong>and</strong> trade facilitation measures that must be taken to provide added incentives<br />
to the traders. The third relates to the payments arrangements, <strong>with</strong>out which trade will<br />
always face impediments. And, finally, suggestions would be made as to how the supply-side<br />
issues can be addressed, keeping in view a medium term perspective.<br />
Policy Measures<br />
1. Development <strong>of</strong> “border haats”, alongside upgrading the LCSs into ICPs, would<br />
provide tremendous boost to border trade. While steps have already been taken to<br />
open border on the India-Bangladesh border, similar initiatives can also be taken on<br />
the India-Myanmar border.<br />
2. The Border <strong>Trade</strong> Agreement between India <strong>and</strong> Myanmar needs to be revisited <strong>with</strong><br />
a view to substantially increase the list <strong>of</strong> products in which barter trade is allowed at<br />
present. The list <strong>of</strong> 40 items has lost its relevance while the normal or regular trade<br />
has gained the popularity over time. With almost all possible tradable items being<br />
traded through Moreh, the most important trade point on the India-Myanmar border,<br />
6
artificial barriers like the ones imposed through the Border <strong>Trade</strong> Agreement would<br />
only result in the development <strong>of</strong> a parallel economy. Government may, therefore,<br />
allow normal trade to take place in accordance <strong>with</strong> the Foreign <strong>Trade</strong> Policy.<br />
Infrastructural bottlenecks<br />
1. All the LCSs covered by the study lack essential infrastructure necessary to promote<br />
border trade. Road connectivity needs to be improved. Government <strong>of</strong> India <strong>and</strong> the<br />
State Governments should give priority to upgrading <strong>of</strong> the National Highways <strong>and</strong><br />
the State Highways linking the LCSs <strong>with</strong> the rest <strong>of</strong> the country. Up gradation <strong>of</strong> the<br />
road infrastructure will help in improving the supplies <strong>of</strong> goods from the rest <strong>of</strong> the<br />
region <strong>and</strong> would help in reducing the large trade imbalances that India faces exist at<br />
some <strong>of</strong> the trade points, in particular at Moreh. This study has pointed out that there<br />
is a dem<strong>and</strong> for Indian products in Myanmar, <strong>and</strong> possibly, beyond, which can be<br />
satisfied by connecting these trade points <strong>with</strong> the rest <strong>of</strong> the country. Local enterprise<br />
will also receive an additional incentive to go beyond the borders if the problems <strong>of</strong><br />
connectivity are addressed.<br />
2. Although the LCSs exist in most <strong>of</strong> the border trade points that were included in the<br />
study, inadequate infrastructure <strong>and</strong> other facilities at these LCSs prevent conducting<br />
high volumes <strong>of</strong> trade. Communication systems are in a general state <strong>of</strong> disrepair in<br />
most <strong>of</strong> the border trade points. In some cases, like Moreh, where communication<br />
systems are in place, the service is highly erratic. Most <strong>of</strong> the other infrastructural<br />
facilities are either non-functional or are unavailable. These include weighbridges,<br />
warehouses <strong>and</strong> dumping sheds.<br />
3. Since food items account for a significant proportion <strong>of</strong> trade taking place through the<br />
border trade points, specific infrastructural needs <strong>of</strong> these products would have to be<br />
addressed. Animal <strong>and</strong> plant testing <strong>and</strong> quarantine facilities, conforming to<br />
international st<strong>and</strong>ards, need to be put in place near the LCSs to prevent spread <strong>of</strong><br />
undesirable pests <strong>and</strong> pathogens. Since a significant proportion <strong>of</strong> the traded products<br />
are in the nature <strong>of</strong> perishables, establishment <strong>of</strong> cold storages would not only in fetch<br />
better value for the products; there would be an additional incentive for exp<strong>and</strong>ing<br />
both the volume <strong>of</strong> products being traded at present <strong>and</strong> the range <strong>of</strong> products being<br />
traded through the LCSs.<br />
4. Upgrading the infrastructure should be done <strong>with</strong> a view to improving the efficiency<br />
<strong>of</strong> the customs authorities so that the lead-time for clearances is reduced to the bare<br />
minimum. Appropriate trade facilitation measures are needed to reduce the<br />
transactions cost. These would involve reducing the number <strong>of</strong> clearances required for<br />
trade transactions. It may be mentioned in this context that the use <strong>of</strong> information<br />
technology (IT) <strong>and</strong> information technology enabled services (ITES) has provided<br />
fillip to trade facilitation in many countries <strong>and</strong> these experiences need to be<br />
replicated in India to facilitate border trade.<br />
7
Payments Arrangements<br />
1. India-Myanmar trade has steadily increased over the past decade. Two-way trade<br />
between the two countries increased from around Rs. 1,000 crores in 2000-01 to more<br />
than 7,000 crores in 2009-10. India faces a huge trade deficit: in 2009-10, the deficit<br />
was in excess <strong>of</strong> Rs. 5,100 crores. The trade deficit should register a decline during<br />
the previous fiscal year since in the first nine months <strong>of</strong> the fiscal, exports from India<br />
had exceeded the level recorded in 2009-10, <strong>and</strong> imports were barely one-half <strong>of</strong> the<br />
previous year’s level.<br />
2. The <strong>of</strong>ficial statistics, however, does not provide the true indication <strong>of</strong> the level <strong>of</strong><br />
trade relations between India <strong>and</strong> Myanmar because <strong>of</strong> the presence <strong>of</strong> informal trade.<br />
This form <strong>of</strong> trade takes places almost entirely through the l<strong>and</strong> border that connects<br />
Moreh in Manipur to Tamu in Myanmar. Imports consist <strong>of</strong> precious stones,<br />
agricultural commodities including beans, vegetables <strong>and</strong> fruits, besides electronic<br />
equipment. Quite clearly, the goods that are traded through the informal/illegal<br />
channels are well beyond the 40 items that have been included in the Border <strong>Trade</strong><br />
agreement between India <strong>and</strong> Myanmar. Most <strong>of</strong> the products coming through Moreh<br />
are not <strong>of</strong> Myanmarese origin - they are produced in China <strong>and</strong> elsewhere.<br />
3. <strong>Trade</strong> through the informal channel takes place through head-loads. Consequently,<br />
there are no <strong>of</strong>ficial accounts kept on the volume/value <strong>of</strong> trade. <strong>Trade</strong> seems to be<br />
flourishing since there are no explicit checks at the border by the governments on<br />
either side. The magnitude <strong>of</strong> trade taking place in phenomenal. According to the<br />
traders, daily imports are in the vicinity <strong>of</strong> Rs. 3-4 crores. As is usually the case, any<br />
estimate <strong>of</strong> this kind are likely to be underestimates <strong>of</strong> the actual level <strong>of</strong> trade taking<br />
place. This is borne out from the evidence presented by studies conducted around<br />
2009, which have estimated that the value <strong>of</strong> informal border trade transacted through<br />
Moreh is estimated at about Rs. 2000 crores a year. Thus, even if the number provided<br />
by the traders is considered, annual trade taking place through informal channels is<br />
between Rs. 1100 <strong>and</strong> Rs 1450 crores. And, this trade balance is hugely against India<br />
given the large quantities <strong>of</strong> Chinese (<strong>and</strong> some Thai) products being imported. As<br />
against this, imports to India through the LCS in Moreh were a mere Rs. 16 crores<br />
during 2009-10. The numbers for informal/illegal trade clearly suggest that these trade<br />
<strong>and</strong> related activities are sustaining the economy <strong>of</strong> the region.<br />
4. Informal trade is heavily skewed against India. <strong>Trade</strong>rs on the Indian side <strong>of</strong> the<br />
border report that the infrastructure facilities are well developed on the other side <strong>of</strong><br />
the border at Namphalong (Tamu). About 700-800 well stocked shops form the basis<br />
for imports from Myanmar. The situation across the border in Moreh is in sharp<br />
contrast – there are less than 100 shops. There is clearly no momentum in India’s<br />
exports to Myanmar.<br />
5. At the same time, however, there is evidence that there is a market for Indian products<br />
in Myanmar, some <strong>of</strong> which are currently being supplied at sub-optimal levels. Field<br />
surveys undertaken have revealed that products like tea, confectionery products,<br />
cosmetics, tyres utensils, fruit juices <strong>and</strong> processed food products are inconsiderable<br />
dem<strong>and</strong>, although they face serious competition <strong>with</strong> the Chinese products.<br />
8
6. Besides supply-bottlenecks, trade expansion from India seems to have suffered<br />
because payments arrangements remain the most serious hindrance. The absence <strong>of</strong> a<br />
realistic exchange rate appears to be a major factor impeding growth <strong>of</strong> exports to<br />
Myanmar.<br />
7. The <strong>of</strong>ficial exchange rate <strong>of</strong> the Kyat is hugely inflated. According to some<br />
estimates, in 2010, one US $ was equivalent to 1000 Kyat in the informal market,<br />
while the <strong>of</strong>ficial exchange rate was 5.5 Kyat per US $. Recent reports indicate a<br />
gradual appreciation <strong>of</strong> the Kyat in the informal market. By June 2011, a 20 per cent<br />
appreciation in the value <strong>of</strong> the Kyat was registered.<br />
8. Going by the <strong>of</strong>ficial rate, one Kyat is equivalent to over Rs. 8.50. The informal rate,<br />
one that is used for the conduct <strong>of</strong> informal trade, one Rupee was equivalent to 25-30<br />
Kyat. The <strong>of</strong>ficial rate <strong>of</strong> the Kyat is therefore 210 times higher than the one being<br />
used in the grey market through which the informal/illegal trade is taking place.<br />
9. United Bank <strong>of</strong> India (UBI) <strong>and</strong> the Myanmar Economic Bank have entered into MoU<br />
for opening letters <strong>of</strong> credit (LC). At present, settlement can be made in two<br />
currencies, viz. Singapore dollars <strong>and</strong> Euros. However, not even one LC has been<br />
opened so far. Given the vexatious problem <strong>of</strong> the Kyat-Rupee exchange rate, the lack<br />
<strong>of</strong> interest in using LC is not entirely unexpected.<br />
10. The rupee is widely accepted as the currency for conducting India-Myanmar trade at<br />
the border. It is therefore strongly recommended that India-Myanmar trade should be<br />
denominated in Rupees. There are several advantages that could accrue to India as a<br />
result, which are enumerated below:<br />
a. Use <strong>of</strong> Rupees would help avoid the use <strong>of</strong> third country currency, which not<br />
only involve complex procedures, but also result in considerable delays <strong>and</strong><br />
commensurate increase in transactions cost.<br />
b. Rupee has been relatively more stable than most <strong>of</strong> the so-called hard<br />
currencies, including the Euro. With the Euro-zone embroiled in a crisis, there<br />
are uncertainties regarding the stability <strong>of</strong> the Euro, which is one <strong>of</strong> the<br />
currencies that is being used for settlement <strong>of</strong> India-Myanmar trade. A more<br />
stable exchange rate regime that Rupee trade would bring in would help both<br />
traders <strong>and</strong> consumers in both countries.<br />
c. Rupee trade may encourage greater use <strong>of</strong> the formal trade route by traders<br />
who are at present engaged in informal/illegal trade at the border. The use <strong>of</strong><br />
LC should increase <strong>and</strong> as a result border trade could become more<br />
transparent.<br />
d. Assuming that the existing patterns <strong>of</strong> trade would continue to prevail, one <strong>of</strong><br />
the favourable outcomes <strong>of</strong> introducing Rupee trade would be that Myanmar<br />
would be dem<strong>and</strong>ing more products from India in order to use its accumulated<br />
rupee resources, thus evening out the large imbalance in bilateral trade faced<br />
by India.<br />
e. India needs to consider promoting Rupee as a currency for settlement <strong>of</strong><br />
bilateral trade <strong>with</strong> as many countries as possible particularly to counter the<br />
moves <strong>of</strong> the Chinese government to push Yuan for trade settlement. Over the<br />
past couple <strong>of</strong> years, China has promoted swap in bilateral trade <strong>with</strong> a<br />
number <strong>of</strong> countries, <strong>and</strong>, as the recent trends show, Yuan denominated trade<br />
is on the rise. Available estimates show that that by the first quarter <strong>of</strong> this<br />
9
year, almost 7 per cent <strong>of</strong> China’s trade was denominated in Yuan. Recent<br />
projections made by the HSBC Bank show that by 2015, almost 50 per cent <strong>of</strong><br />
China’s trade would be Yuan denominated. If India has to establish itself as a<br />
major economic power in the region it has to use its own currency to derive<br />
enhanced benefits from economic engagement <strong>with</strong> its neighbours.<br />
11. Needless to say, the use <strong>of</strong> Rupee would require enhanced surveillance by the banking<br />
sector so as to ensure that illegitimate use <strong>of</strong> the currency is eliminated. Banking<br />
systems in the two countries, led by the UBI <strong>and</strong> the Myanmar Economic Bank,<br />
should be so developed as to respond to the requirements <strong>of</strong> the traders.<br />
12. Prompt measures should be taken to promote use <strong>of</strong> LC. As stated above, the lack <strong>of</strong><br />
interest on the part <strong>of</strong> the traders in LC, particularly those involved in border trade,<br />
has hampered the development <strong>of</strong> trade through formal channels. It has to be<br />
recognised that even in the best <strong>of</strong> situations, LC are difficult for the small traders to<br />
h<strong>and</strong>le <strong>and</strong>, therefore, concerted efforts would have to be taken to ensure that this<br />
instrument is put to use. It may be suggested that the traders associations involved in<br />
border trade together <strong>with</strong> export promotion councils, like the SHEFEXIL, <strong>and</strong> the<br />
banks undertake a series <strong>of</strong> programmes to popularise the use <strong>of</strong> LC.<br />
Improving the Supply-side Bottlenecks<br />
1. While many <strong>of</strong> the measures suggested in the foregoing would lead to the removal <strong>of</strong><br />
supply-side bottlenecks on the Indian side <strong>of</strong> the border, there is a need to take a<br />
medium-term perspective to address the supply-side issues so as to make effective use<br />
<strong>of</strong> the border trade points. For so doing, the Government <strong>of</strong> India, along <strong>with</strong> the<br />
concerned State Government, would have to devise an elaborate plan that links the<br />
development <strong>of</strong> certain sectors in the NER <strong>with</strong> the trade channels provided by the<br />
border trade points.<br />
2. The NER has been the hub <strong>of</strong> niche products in h<strong>and</strong>icrafts <strong>and</strong> h<strong>and</strong>loom, much <strong>of</strong><br />
which is in the state <strong>of</strong> decline for want <strong>of</strong> effective government intervention. As their<br />
budgetary position has worsened, State Governments have lowered the level <strong>of</strong><br />
support that was once given to the artisans. It is suggested that these activities need to<br />
be revived <strong>with</strong> Central assistance through a well coordinated programme to promote<br />
the artisans. This programme could be modelled on the One Village One Product<br />
movement that was initiated in Japan in the late 1970s, which promoted one<br />
competitive <strong>and</strong> staple product from a village to improve the living st<strong>and</strong>ards <strong>of</strong> the<br />
population. More recently, Thail<strong>and</strong> developed the One Tambon One Product (OTOP)<br />
programme to encourage village communities to improve the quality <strong>and</strong> marketing <strong>of</strong><br />
the locally made products, including h<strong>and</strong>icrafts, cotton <strong>and</strong> silk garments, pottery,<br />
fashion accessories, household items, <strong>and</strong> foods. The OTOP programme, which is<br />
more relevant for the NER, selected one superior product from each tambon (subdistrict),<br />
granted it a br<strong>and</strong> (“starred OTOP product”), <strong>and</strong> provided local <strong>and</strong><br />
international stage for promotion <strong>of</strong> these products. Besides promoting the products,<br />
the OTOP Programme (renamed as the “Local <strong>and</strong> Community Products”, although<br />
the “OTOP” br<strong>and</strong> name has been retained), led to promotion <strong>of</strong> tourism in the<br />
districts from which the products originate.<br />
10
3. In case <strong>of</strong> Bangladesh, the Government <strong>of</strong> India <strong>and</strong> the State Governments may also<br />
consider developing a tripartite relationship aimed at promoting trade <strong>and</strong> investment<br />
in Bangladesh <strong>and</strong> India. The focus <strong>of</strong> these efforts should be the support that India<br />
needs to provide to Bangladesh to set up enterprises in the small <strong>and</strong> medium<br />
enterprise (SME) sector, which are based on resources available in India’s NER. The<br />
sectors that select themselves naturally are food processing <strong>and</strong> textiles <strong>and</strong> clothing.<br />
The industries set up in Bangladesh <strong>with</strong> India’s support can leverage the vast market<br />
in the NER that is waiting to be exploited.<br />
4. Development <strong>of</strong> local industries is an imperative that must be given high priority,<br />
especially in the face <strong>of</strong> the penetration <strong>of</strong> imported products into the local economy.<br />
Industries like agro-processing, horticulture <strong>and</strong> textiles in which the NER has natural<br />
comparative advantage must be exp<strong>and</strong>ed using an employment-led strategy. Such a<br />
strategy will not only result in augmentation <strong>of</strong> domestic dem<strong>and</strong>, but will also create<br />
a viable industrial base that can service external dem<strong>and</strong>. At the same time,<br />
possibilities <strong>of</strong> setting up industries for producing rubber goods, cycles <strong>and</strong> cycle<br />
parts, pharmaceuticals, edible oils, petroleum products, cement must be explored<br />
since the NER either has the raw materials for their development <strong>and</strong>/or the dem<strong>and</strong><br />
from the region <strong>and</strong> the countries around it are large enough to sustain them.<br />
5. Capacity building for <strong>of</strong>ficials, entrepreneurs, <strong>and</strong> traders is needed for strengthening<br />
human resources. This would help improve the quality <strong>and</strong> delivery services in the<br />
region. State-level trade promotion centres assisted by the apex industry associations<br />
might be the right step for building capacities in the region.<br />
11
Chapter 1<br />
Introduction<br />
India’s <strong>North</strong> <strong>East</strong>ern Region (hereinafter the NER) is among the most endowed states in<br />
terms <strong>of</strong> the natural resources, including several critical minerals that it possesses, <strong>and</strong> has<br />
substantial potential for generating one <strong>of</strong> the preferred low-carbon forms <strong>of</strong> energy, viz.<br />
hydro-electricity. Besides, NER sits at the door-step <strong>of</strong> the <strong>East</strong> Asia, the region <strong>with</strong> which<br />
India is increasing its economic ties. But despite these advantages, the NER has remained one<br />
<strong>of</strong> India’s economically laggard regions, which accounts for a mere 2 per cent <strong>of</strong> India’s<br />
Gross Domestic Product (GDP) in 2009-10. High transactions costs contributed by the<br />
bottlenecks in the transport systems connecting the NER <strong>with</strong> the rest <strong>of</strong> India <strong>and</strong> the<br />
neighbouring countries <strong>and</strong> the lack <strong>of</strong> other essential infrastructure have rendered the region<br />
perpetually underdeveloped (Bhattacharya <strong>and</strong> De, 2006; De, 2008).<br />
The relation between trade, infrastructure <strong>and</strong> economic development <strong>with</strong>in countries (read<br />
India) is a much debated issue. Most trade economists have a view <strong>of</strong> a world in which<br />
countries freely exchange goods, factors <strong>of</strong> production <strong>and</strong> technology. Free trade in goods<br />
leads to equalization <strong>of</strong> factor prices across countries. In the neo-classical growth models,<br />
capital <strong>and</strong> labour play the central roles as two main factors <strong>of</strong> production. From the<br />
perspective <strong>of</strong> conventional one sector neo-classical growth theory, international linkages do<br />
not matter, but from the trade perspective they are the crucial determinants. Although<br />
infrastructure plays an important catalytic role, it gets virtually no explicit mention in the<br />
relevant literature on trade <strong>and</strong> inclusive growth. 4, 5 It has also been argued that greater<br />
openness <strong>of</strong> an economy is potentially beneficial to all but appropriate policy designs are<br />
essential for realizing the benefits (Basu, 2006). The link between trade <strong>and</strong> infrastructure<br />
development in the NER must be seen in this perspective. As the principal nodes <strong>of</strong> the<br />
national market are far away, markets across the border can act as the vents for surplus<br />
generated in the NER.<br />
The region is unique in terms <strong>of</strong> the opportunities it <strong>of</strong>fers. While it is an industrial desert<br />
where almost all immediate consumables are imported from outside the region, the NER is<br />
the focal point <strong>of</strong> trade <strong>with</strong>in a vast area. About 96 per cent <strong>of</strong> this region’s borders form<br />
India’s international boundaries; it shares borders <strong>with</strong> the China in the north, Bangladesh in<br />
the southwest, Bhutan in the northwest, <strong>and</strong> Myanmar in the east. NER’s locational<br />
advantage provides a backdrop to its development as a base for cooperation not only <strong>with</strong> the<br />
Association <strong>of</strong> Southeast Asian Nations (ASEAN) but also <strong>with</strong> neighbouring countries such<br />
as Bangladesh, Bhutan, <strong>and</strong> Nepal.<br />
4 However, development in endogenous growth theory has introduced the possibility <strong>of</strong> a productive role<br />
<strong>of</strong> public expenditure on infrastructure <strong>with</strong> an associated possibility <strong>of</strong> increasing returns to scale<br />
(Barro, 1990 <strong>and</strong> 1991).<br />
5 In economics, there is a need to concentrate on economic infrastructure, which includes services from:<br />
(a) public utilities, such as power, telecommunications, piped water supply, sanitation <strong>and</strong> sewerage,<br />
solid waste collection <strong>and</strong> disposal, <strong>and</strong> piped gas; (b) public works, such as roads, <strong>and</strong> major dam <strong>and</strong><br />
canal works for irrigation <strong>and</strong> drainage; <strong>and</strong> (c) other transportation sectors, such as urban <strong>and</strong> interurban<br />
railways, urban transport, ports <strong>and</strong> waterways, <strong>and</strong> airports (World Bank, 1994). See also,<br />
Canning (2006), <strong>and</strong> Straub (2008).<br />
12
Over the past several years, a number <strong>of</strong> regional <strong>and</strong> sub-regional initiatives have been taken<br />
by countries in the South <strong>and</strong> South <strong>East</strong> Asia, which would help shape the economic<br />
geography <strong>of</strong> the region. These include the enhanced cooperation among the members <strong>of</strong> the<br />
South Asian Association <strong>of</strong> Regional Cooperation (SAARC) that have agreed to set up a<br />
South Asian Economic Union, the Bay <strong>of</strong> Bengal Initiative for Multi-sectoral Technical <strong>and</strong><br />
Economic Cooperation (BIMSTEC) 6 , the Asia-Pacific <strong>Trade</strong> Agreement (APTA) 7 . Besides,<br />
India has adopted the “Look <strong>East</strong>” policy <strong>and</strong> is engaged in deepening economic cooperation<br />
<strong>with</strong> ASEAN <strong>and</strong> countries belonging to the <strong>East</strong> Asia Summit (EAS), which brings together<br />
ASEAN <strong>and</strong> six <strong>of</strong> its partner countries, including India 8 . Providing fillip to these initiatives<br />
is not possible <strong>with</strong>out the NER playing a pivotal role (see Figure 1).<br />
Figure 1: NER as India’s Gateway to the <strong>East</strong><br />
Notes:<br />
* South Asia Sub-regional Economic Cooperation (SASEC)<br />
** Mekong-Ganga Cooperation<br />
***Greater Mekong Sub-region (GMS)<br />
From among the countries that are in the immediate neighbourhood <strong>of</strong> the NER, Bangladesh<br />
<strong>and</strong> Myanmar have particular significance. The former was integrally linked to the NER in<br />
the pre-partitioned India <strong>and</strong> the economic links that then existed have perpetuated till today<br />
through the informal channels. Myanmar provides the crucial gateway to the <strong>East</strong> Asian<br />
economies, <strong>and</strong> hence effective connectivity <strong>with</strong> this country is <strong>of</strong> utmost importance. A<br />
6 Members <strong>of</strong> BIMSTEC are Bangladesh, India, Myanmar, Sri Lanka, Thail<strong>and</strong>, Bhutan <strong>and</strong> Nepal.<br />
7 Members are Bangladesh, India, Lao People’s Democratic Republic, the Republic <strong>of</strong> Korea <strong>and</strong> Sri Lanka<br />
8 EAS Summit includes ASEAN plus India, Australia, New Zeal<strong>and</strong>, China, Japan <strong>and</strong> Korea.<br />
13
coherent strategy ,therefore, needs to be developed for strengthening the existing levels <strong>of</strong><br />
trade (<strong>and</strong> also investment) links <strong>with</strong> these countries.<br />
The formal trade links between India <strong>and</strong> its two neighbours, Bangladesh <strong>and</strong> Myanmar, have<br />
remained at a very low level. While the share <strong>of</strong> Bangladesh in India’s total trade was about<br />
0.7 per cent in 2010-11, Myanmar had an even smaller share <strong>of</strong> about 0.2 per cent. In<br />
absolute terms, India’s two-way trade <strong>with</strong> Bangladesh increased from US$ 1.8 billion in<br />
2005-06 to US$ 4 billion in 2010-11, which is the highest level ever. In the same period,<br />
India’s two-way trade <strong>with</strong> Myanmar grew almost three-fold between 2005-06 <strong>and</strong> 2010-11<br />
to reach US$ 1.4 billion.<br />
An interesting aspect <strong>of</strong> India’s trade <strong>with</strong> Bangladesh <strong>and</strong> Myanmar is that while in case <strong>of</strong><br />
Bangladesh, India has maintained a large trade surplus, the country’s trade balance is<br />
negative vis-à-vis Myanmar. In 2010-11, India’s trade surplus <strong>with</strong> Bangladesh had exceeded<br />
US$ 3 billion, which was despite the fact that its imports had increased by more than 62 per<br />
cent as compared to that in the previous year. In contrast, India’s trade deficit <strong>with</strong> Myanmar<br />
exceeded US$ 600 million in 2010-11, which was less than half <strong>of</strong> that seen a year earlier.<br />
These low levels <strong>of</strong> trade do not include the informal trade that takes place through the local<br />
trade points, which have not been systematically recorded thus far. People living in the border<br />
regions have had economic <strong>and</strong> cultural links going back to several centuries <strong>and</strong> the drawing<br />
<strong>of</strong> the political boundaries has failed to severe their ties. The interdependence <strong>of</strong> the people<br />
on the two sides <strong>of</strong> the political boundaries has given rise to informal channels <strong>of</strong> trade in<br />
goods <strong>and</strong> services. In fact, much <strong>of</strong> the trade taking place through the borders are through<br />
informal arrangements, whose importance seems to have hardly diminished despite the<br />
restrictions that have come into being in the past few decades. Informal trade has thus<br />
provided sustenance to the economies <strong>of</strong> the<br />
The importance <strong>of</strong> informal trade is immense for the NER, for it brings direct tangible<br />
benefits to the region. <strong>Trade</strong> across the borders <strong>of</strong> India <strong>with</strong> both Bangladesh <strong>and</strong> Myanmar<br />
face a plethora a problems. Supply-side constraints, among others, are inhibiting two-way<br />
trade across the borders <strong>with</strong> its two neighbours. With 96 per cent <strong>of</strong> India’s NER<br />
constituting international boundaries, there is an urgent need to strengthen not only transport<br />
<strong>and</strong> communication infrastructure but also the institutional support that is currently available<br />
at the border so as to enhance the existing level <strong>of</strong> trade <strong>and</strong> economic linkages <strong>with</strong> countries<br />
bordering the NER, including Bangladesh <strong>and</strong> Myanmar.<br />
Over the past two decades the Government <strong>of</strong> India has taken several steps for promoting<br />
trade on the borders <strong>with</strong> both Myanmar <strong>and</strong> Bangladesh. A border trade agreement <strong>with</strong><br />
Myanmar was concluded in 1994, which allowed trade to take place initially through two<br />
points, viz. Moreh <strong>and</strong> Champhai, <strong>and</strong> subsequently through other points to be identified<br />
jointly by the two governments. Under this agreement, 22 locally produced commodities 9<br />
were allowed to be traded, as per the prevailing customary practices, including barter. A<br />
number <strong>of</strong> conditions were introduced on the barter trade mechanism 10 :<br />
(a)<br />
(b)<br />
The transactions could take place only by way <strong>of</strong> head load or non-motorised<br />
transport system;<br />
The value <strong>of</strong> goods exported under barter trade could not exceed US $20,000 per<br />
transaction;<br />
9 See Annex I for the list.<br />
10 Reserve Bank <strong>of</strong> India (2000).<br />
14
(c) The export <strong>of</strong> goods from India to Myanmar against import <strong>of</strong> goods from Myanmar<br />
to India should be completed <strong>with</strong>in a period <strong>of</strong> six months from the date <strong>of</strong> import.<br />
In 2008, the two countries took several significant decisions regarding the existing border<br />
trade arrangements. One, trade through the Moreh-Tamu <strong>and</strong> Zokhawthar-Rhi border points<br />
was upgraded to normal trade. All goods except a h<strong>and</strong>ful <strong>of</strong> restricted items were allowed to<br />
be traded at these points at MFN rates. Two, decision was also taken to open a new border<br />
trade point at Avakhung-Leshi. Three, the list <strong>of</strong> list <strong>of</strong> items for barter trade identified under<br />
the 1994 Agreement was exp<strong>and</strong>ed to 40. And, finally a decision was taken to operationalise<br />
new banking arrangement for trade.<br />
Border trade arrangements between India <strong>and</strong> Bangladesh remained largely undeveloped until<br />
the decision was taken by the Prime Ministers <strong>of</strong> the two countries in January 2010 to<br />
establish border haats. A formal agreement was signed in October 2010 to establish border<br />
haats, as a pilot project, at two locations, one <strong>of</strong> which is operational. The two countries also<br />
agreed to open border haats in other locations based on factors like historical location,<br />
difficulty in access, interdependence <strong>of</strong> the population on both sides <strong>of</strong> the border <strong>and</strong><br />
availability <strong>of</strong> suitable location.<br />
While efforts have been made to enhance the level <strong>of</strong> trade <strong>with</strong> Bangladesh <strong>and</strong> Myanmar,<br />
there is a need to look at opportunities beyond trade that will ensure that the partner countries<br />
reap longer term benefits. One <strong>of</strong> the ways in which this has been possible in several different<br />
regions <strong>of</strong> the world, not to speak <strong>of</strong> India, is through “trade-induced investments”. A rich<br />
body <strong>of</strong> literature argues that “trade-induced investment-led growth” was at the heart <strong>of</strong> the<br />
process <strong>of</strong> European integration project (Baldwin 1996). More recently, India has also<br />
experienced deepening <strong>of</strong> its economic relations <strong>with</strong> Sri Lanka through “trade-induced<br />
investments”. The India-Lanka Free <strong>Trade</strong> Agreement (FTA) prompted Indian firms, most<br />
notably, Indian Oil Corporation, to establish their presence in Sri Lanka. More recently, Sri<br />
Lankan investments have started flowing into India, which includes Br<strong>and</strong>ix Sri Lanka, the<br />
largest textile exporter from the country.<br />
In view <strong>of</strong> the above-mentioned instances <strong>of</strong> “trade-induced investments”, including those<br />
that India has a part <strong>of</strong>, this study presents a perspective as to how trade <strong>and</strong> investment<br />
synergies can be developed so that the NER along <strong>with</strong> Bangladesh <strong>and</strong> Myanmar can<br />
develop a partnership for ushering in virtuous growth in the region.<br />
Scope <strong>of</strong> the Study<br />
The proposed study analyses the scope <strong>of</strong> utilising identified L<strong>and</strong> Customs Stations (LCSs)<br />
for improving border trade <strong>with</strong> Bangladesh <strong>and</strong> Myanmar. The study exclusively focuses on<br />
following set <strong>of</strong> issues.<br />
First, the study makes an assessment <strong>of</strong> the pattern <strong>of</strong> border trade between India <strong>and</strong> its two<br />
neighbours <strong>and</strong> the possibilities <strong>of</strong> exp<strong>and</strong>ing it given the existing market conditions.<br />
Second, this study attempts to identify products, based on supply-dem<strong>and</strong> balances in the<br />
region, <strong>and</strong> taking note <strong>of</strong> those in earlier studies (e.g. dairy products, medicines, machinery<br />
<strong>and</strong> engineering goods, construction materials, two-wheelers, car parts, raw materials for<br />
textiles, plastic materials, wood <strong>and</strong> wood products, etc.).<br />
Third, the study examines this possibility on specific local products to enhance their market<br />
value.<br />
15
Fourth, the study also examines what could be gainfully imported by the NER from the<br />
neighbouring countries so that the bilateral trade is not unidirectional but provided for a winwin<br />
situation.<br />
Fifth, this study discusses the second set <strong>of</strong> issues that involve assessment <strong>of</strong> supply-side<br />
constraints exist in the NER which are inhibiting India’s two-way trade <strong>with</strong> the two<br />
neighbours.<br />
Sixth, it also evaluates the possibilities <strong>of</strong> investment opportunities by India in both<br />
Bangladesh <strong>and</strong> Myanmar, <strong>and</strong> vice versa, which can then use the LCSs.<br />
Research Objectives <strong>and</strong> Data Sources<br />
This study has following specific objectives:<br />
<br />
<br />
<br />
<br />
<br />
Review <strong>of</strong> India’s trade <strong>with</strong> Bangladesh <strong>and</strong> Myanmar <strong>and</strong> the changes in recent past<br />
(the most recent three-year period may be considered).<br />
o The focus <strong>of</strong> this exercise is on India’s trade that is taking place through the<br />
NER.<br />
Identification <strong>of</strong> commodities that can help in exp<strong>and</strong>ing India’s trade <strong>with</strong> the<br />
neighbours through the NER given the existing resource endowments <strong>and</strong> market<br />
dem<strong>and</strong> for products<br />
o This exercise entails identification <strong>of</strong> commodities that India currently exports<br />
or can export to Bangladesh <strong>and</strong> Myanmar in future, but also the products that<br />
the NER can import from India’s neighbours<br />
Identification <strong>of</strong> constraints, procedural <strong>and</strong> otherwise, that imposing limitations on<br />
the expansion <strong>of</strong> India’s trade <strong>with</strong> Bangladesh <strong>and</strong> Myanmar through the <strong>North</strong><br />
<strong>East</strong>ern states.<br />
o Issue like availability <strong>of</strong> trade finance is also discussed.<br />
Identification <strong>of</strong> supply-side constraints that are limiting India’s exports <strong>of</strong><br />
commodities to Bangladesh <strong>and</strong> Myanmar that are produced in the NER <strong>and</strong> suggest<br />
measures that need to be adopted to deal <strong>with</strong> this problem.<br />
Exploration <strong>of</strong> India’s investment opportunities in Bangladesh <strong>and</strong> Myanmar <strong>with</strong><br />
buy-back provisions that can eventually promote border trade through the LCSs<br />
existing in the NER.<br />
The above mentioned issues have been dealt <strong>with</strong> using data <strong>and</strong> information obtained from<br />
both primary <strong>and</strong> secondary sources. Data from primary sources have been collected through<br />
extensive field visits in identified LCSs. Field visits <strong>and</strong> primary survey helped us to make<br />
assessments <strong>of</strong> the ground reality <strong>of</strong> both hard <strong>and</strong> s<strong>of</strong>t infrastructure.<br />
Structure <strong>of</strong> the Study<br />
The following chapter presents a brief overview <strong>of</strong> the NER economies <strong>and</strong> includes a<br />
discussion on the recent macroeconomic performance <strong>of</strong> the region. Chapter 3 provides a<br />
detailed account <strong>of</strong> the NER’s trade <strong>with</strong> Bangladesh. The chapter presents an analysis <strong>of</strong> the<br />
trade flows <strong>and</strong> their patterns <strong>with</strong> the individual states in the NER. Chapter 4 presents the<br />
NER’s trade <strong>with</strong> Myanmar. This discussion also includes the NER’s trade <strong>with</strong> Myanmar<br />
16
through l<strong>and</strong> border. Based on the evidences presented in Chapters 3 <strong>and</strong> 4, policy initiatives<br />
that need to be undertaken for the development <strong>of</strong> trade <strong>and</strong> investment in NER along <strong>with</strong><br />
Bangladesh <strong>and</strong> Myanmar are enumerated in Chapter 5. This component <strong>of</strong> the report has<br />
been benefited from the past discussions <strong>with</strong> the Ministry <strong>of</strong> DONER. It would be further<br />
strengthened based on the inputs to be received from the stakeholder consultations that would<br />
be held in Shillong under the aegis <strong>of</strong> the NEC.<br />
17
Chapter 2<br />
State <strong>of</strong> the NER Economies<br />
The <strong>North</strong> <strong>East</strong>ern Region (NER) comprises <strong>of</strong> Arunachal Pradesh, Assam, Manipur,<br />
Meghalaya, Mizoram, Nagal<strong>and</strong>, Sikkim <strong>and</strong> Tripura <strong>and</strong> extends to north <strong>and</strong> east <strong>of</strong> the<br />
narrow Siliguri corridor. These eight states cover an area <strong>of</strong> 2,62,189 sq. km. constituting 8<br />
per cent <strong>of</strong> the country’s total geographical area <strong>and</strong> account for only around 3.79 per cent <strong>of</strong><br />
the total population <strong>and</strong> 3.87 per cent <strong>of</strong> country’s output <strong>of</strong> the country. 11 The region shares<br />
a long international boundary <strong>of</strong> around 96 per cent <strong>with</strong> its neighbouring countries <strong>with</strong><br />
China <strong>and</strong> Bhutan in the north, Myanmar in the east, Nepal in the west <strong>and</strong> Bangladesh in the<br />
south <strong>and</strong> west. Most <strong>of</strong> the hill states in the region like Arunachal Pradesh, Meghalaya,<br />
Mizoram <strong>and</strong> Nagal<strong>and</strong> are mostly inhabited by the tribal people <strong>with</strong> a fairly high degree <strong>of</strong><br />
diversity even <strong>with</strong>in the tribal groups.<br />
NER States<br />
Table 2.1 Population by NER States (2001 Census)<br />
Total Rural Urban Rural* Urban* Pop Density<br />
(million) (million) (million) (%) (%) (per sq. km area)<br />
Arunachal Pradesh 1.10 0.87 0.23 79.25 26.19 13<br />
Assam 235.56 232.12 3.44 98.54 1.48 340<br />
Manipur 2.17 1.59 0.58 73.42 36.21 107<br />
Meghalaya 2.32 1.86 0.45 80.42 24.35 103<br />
Mizoram 0.89 0.45 0.44 50.37 98.53 42<br />
Nagal<strong>and</strong> 1.99 1.65 0.34 82.77 20.81 120<br />
Sikkim 0.54 0.48 0.06 88.93 12.45 76<br />
Tripura 3.20 2.65 0.55 82.94 20.57 304<br />
NER Total 247.76 241.67 6.09 97.54 2.52 149<br />
Notes: *Share in total population.<br />
Source: Government <strong>of</strong> India.<br />
The NER is basically a rural economy; almost 98 per cent <strong>of</strong> population live in rural sector,<br />
having an average population density <strong>of</strong> 149 people per sq. km. <strong>of</strong> area (Table 2.1). The<br />
distribution <strong>of</strong> population is also uneven across the states. Assam <strong>and</strong> Tripura are top two<br />
densely populated states, sharing almost 96 <strong>of</strong> the total NER population. These are also the<br />
two most resourceful states contributing towards the development <strong>of</strong> the NER.<br />
Around 150 years ago driven by exp<strong>and</strong>ing global trade <strong>and</strong> investment, the region was in the<br />
forefront <strong>of</strong> development. Majority <strong>of</strong> the population in the valleys <strong>and</strong> plains used to bank on<br />
the vast river systems <strong>and</strong> small rivulets for livelihood. Global trade was conducted through<br />
the sea-route, a network <strong>of</strong> inl<strong>and</strong> waterways, <strong>and</strong> l<strong>and</strong> transportation through road <strong>and</strong><br />
railways. In fact, the railway network between Dibrugarh <strong>and</strong> Chittagong was one <strong>of</strong> oldest<br />
railways in Asia. The rapid spread <strong>of</strong> tea gardens followed the establishment <strong>of</strong> the first tea<br />
11 While population refers the year 2001, area refers the latest year <strong>and</strong> output refers NSDP <strong>of</strong> the year<br />
2008-09, taken at constant prices <strong>with</strong> base 1990-2000=100, sourced from RBI.<br />
18
garden in 1835 <strong>and</strong> the export <strong>of</strong> the first consignment <strong>of</strong> tea to London in 1838. The<br />
discovery <strong>of</strong> oil in Makum <strong>and</strong> establishment <strong>of</strong> a refinery in Digboi in 1890 laid the<br />
foundation for the development <strong>of</strong> an undivided Assam. The missionaries were involved in<br />
spreading literacy.<br />
But all this changed <strong>with</strong> the partition <strong>of</strong> the country. Carving out <strong>of</strong> <strong>East</strong> Pakistan changed<br />
the entire l<strong>and</strong>scape <strong>of</strong> the region. It virtually disconnected the region from the entire country<br />
just leaving a 27 km Siliguri corridor as the only link. The natural sea route through the port<br />
city <strong>of</strong> Chittagong was blocked. The access to the domestic market was also lost. The region<br />
shares 96 per cent <strong>of</strong> its boundary <strong>with</strong> the neighbouring countries <strong>of</strong> Bangladesh, Nepal,<br />
China <strong>and</strong> Myanmar. The geo-political distancing <strong>of</strong> the region from its main port <strong>of</strong> Kolkata<br />
combined <strong>with</strong> economic insulation has caused immense structural damage to the NER<br />
economy.<br />
2.1 Economic Size <strong>and</strong> Trend<br />
The st<strong>and</strong>ard <strong>of</strong> living <strong>of</strong> the people in the region, as measured by per capita Net State<br />
Domestic Product (GSDP), has lagged significantly behind the rest <strong>of</strong> the country. At Rs.<br />
21,000 in 2008-09, it was almost half <strong>of</strong> all-state average <strong>of</strong> Rs. 41,968. Interestingly,<br />
available information shows that at the time <strong>of</strong> independence per capita income in the<br />
undivided state <strong>of</strong> Assam was higher than the national average by 4 per cent (Das et al.,<br />
2004). Thus, even under the British colonial rule the economic performance <strong>of</strong> the region was<br />
better than the rest <strong>of</strong> the country <strong>and</strong> this shows its vast developmental potential. However,<br />
as the growth rate <strong>of</strong> per capita GSDP lagged behind the rest <strong>of</strong> the country, the gap<br />
narrowed, <strong>and</strong> by the late 1960s per capita income in the region had fallen behind. However,<br />
overt time, differences in the growth rates in per capita income between the region <strong>and</strong> the<br />
country increased further (Ghosh et al., 1996; Marjit et al, 2008). During the period 1999-00<br />
to 2008-09, on an average, while the Indian economy in constant prices increased at the rate<br />
<strong>of</strong> 7.2 per cent per year, the corresponding growth in the NER region was 6.67 per cent<br />
(Figure 2.1). Similarly, the region’s growth rate <strong>of</strong> per capita income also lagged behind the<br />
national growth rate <strong>of</strong> the country. Not surprisingly, the difference in per capita incomes<br />
between the country <strong>and</strong> the region has steadily diverged. The slow progress <strong>of</strong> the NER’s<br />
economy is reflected in the low growth in income.<br />
Figure 2.1: NSDP Growth <strong>of</strong> NER<br />
90000<br />
80000<br />
70000<br />
60000<br />
Rs. crore<br />
50000<br />
40000<br />
30000<br />
20000<br />
10000<br />
AAGR<br />
6.67%<br />
0<br />
1999-<br />
00<br />
2000-<br />
01<br />
2001-<br />
02<br />
2002-<br />
03<br />
2003-<br />
04<br />
2004-<br />
05<br />
2005-<br />
06<br />
2006-<br />
07<br />
2007-<br />
08<br />
2008-<br />
09<br />
Note: Based on Net State Domestic Product (NSDP) at Constant Prices, Base Year: 1999-<br />
2000, taken from CSO. AAGR presents average annual growth rate<br />
19
Table 2.1 Net State Domestic Product (NSDP) at Constant Prices<br />
(Base Year: 1999-2000)<br />
State 1999-00 2000-01 2001-02 2002-03 2003-04<br />
Arunachal Pradesh<br />
1497 1665 1961 1920 2193<br />
Assam 32011 33760 35094 39394 42927<br />
Manipur 2954 2814 3014 3142 3564<br />
Meghalaya<br />
3211 3593 4057 4310 4723<br />
Mizoram 1410 1567 1752 1933 2083<br />
Nagal<strong>and</strong><br />
2556 3286 3874 4382 4699<br />
Sikkim 765 855 956 1078 1209<br />
Tripura 4496 5114 5889 6223 6990<br />
NER Share in India<br />
(%) 3 3 3 3 3<br />
State 2004-05 2005-06 2006-07 2007-08 2008-09<br />
Arunachal Pradesh<br />
2549 2598 3020 3266 .<br />
Assam 47513 52390 57378 62852 69132<br />
Manipur 4058 4477 4726 5044 .<br />
Meghalaya<br />
5138 5617 6162 6707 .<br />
Mizoram 2181 2398 2629 2887 3184<br />
Nagal<strong>and</strong> 4980 5255 . . .<br />
Sikkim 1356 1539 1746 1990 .<br />
Tripura 7648 8712 9533 . .<br />
NER Share in India<br />
(%) 3 3 3 3 3<br />
Source: RBI.<br />
(Rs. Crore)<br />
20
States<br />
Table 2.2: Per Capita Net State Domestic Product (NSDP) at Constant Prices<br />
Arunachal<br />
Pradesh<br />
2002-<br />
2003<br />
2003-<br />
2004<br />
(Base Year: 1999-2000)<br />
2004-<br />
2005<br />
2005-<br />
2006<br />
2006-<br />
2007<br />
2007-<br />
2008<br />
2008-<br />
2009<br />
15832 17340 19339 18179 20458 21582 22475<br />
Assam 13072 13675 13946 14419 14894 15526 16272<br />
Manipur 12319 13389 14334 14663 14941 15667 16508<br />
Meghalaya 15882 16658 17595 18870 20185 21597 23069<br />
Mizoram 18429 18555 18904 18616 19220 19750 20483<br />
Nagal<strong>and</strong> 17409 17319 17269 17008 17129 17453 17538<br />
Sikkim 17065 18159 19332 20777 22277 23684 25257<br />
Tripura 17752 18554 19825 21524 21706 22493 26402<br />
NER average 15970 16706 17568 18007 18851 19719 21001<br />
Source: RBI.<br />
(Rs.)<br />
The aggregate picture presented in Tables 2.1 <strong>and</strong> 2.2, however, hides vast differences<br />
between the urban <strong>and</strong> rural areas, the hills <strong>and</strong> the plains <strong>and</strong> among the other states. In the<br />
region, except for Mizoram, Nagal<strong>and</strong> <strong>and</strong> Sikkim which recorded marginally higher growth<br />
rates than the country average, per capita income levels in all other states were lower by<br />
varying magnitudes. The region lags behind the rest <strong>of</strong> the country not only in terms <strong>of</strong> per<br />
capita income but in several other development indicators as well. People do not have access<br />
to basic services in adequate measure. The st<strong>and</strong>ard development indicators such as road<br />
length, access to healthcare, <strong>and</strong> power consumption in the region are below the national<br />
average. The region generates less than 8 per cent <strong>of</strong> its 63,257 MW <strong>of</strong> hydroelectric power<br />
generation potential <strong>and</strong> its per capita power consumption at 110 kwh is almost a fourth <strong>of</strong><br />
the national average (411 kwh). In Assam, Manipur <strong>and</strong> Nagal<strong>and</strong>, the per capita power<br />
consumption is as low as 85 kwh, 70 kwh <strong>and</strong> 87 kwh, respectively. The literacy rate in the<br />
region is high, but the slow pace <strong>of</strong> industrialisation <strong>and</strong> limited capacity <strong>of</strong> the population to<br />
engage in productive economic activities means a high rate <strong>of</strong> unemployment <strong>and</strong><br />
underemployment. The incidence <strong>of</strong> poverty in the region is high <strong>and</strong> the <strong>of</strong>ficial incomepoverty<br />
measure does not accurately reflect the deprivation.<br />
2.2 Rural Economy<br />
It is impossible to envision the development <strong>of</strong> the NER <strong>with</strong>out the progress <strong>of</strong> rural<br />
economy. This is mainly for two reasons. Firstly, over 80 per cent <strong>of</strong> the population <strong>of</strong> the<br />
region lives in rural areas <strong>and</strong> its livelihood depends on spreading economic activities in rural<br />
areas. Secondly, there is abundance <strong>of</strong> natural resources in the economy <strong>and</strong> harnessing these<br />
for the benefit <strong>of</strong> the population would require strengthening forward <strong>and</strong> backward linkages.<br />
Development <strong>of</strong> rural economies in the region may rest on activities like agriculture, forestry,<br />
livestock, minerals <strong>and</strong> rural non-farm activity.<br />
21
Sector<br />
Tab 2.3: Sectoral Composition<br />
Arunachal Pradesh Assam Manipur<br />
2000-01 2006-07 2000-01 2006-07 2000-01 2006-07<br />
Agriculture 36.97 26.42 35.58 28.18 30.87 27.45<br />
Industry 5.30 9.42 11.93 17.41 9.50 7.69<br />
Services 57.73 64.16 52.48 54.41 59.63 64.86<br />
Meghalaya Mizoram Nagal<strong>and</strong><br />
2000-01 2006-07 2000-01 2006-07 2000-01 2006-07<br />
Agriculture 23.90 21.88 21.40 16.68 33.34 33.58<br />
Industry 11.45 14.81 4.02 2.82 2.36 2.90<br />
Services 64.65 63.31 74.58 80.50 64.31 63.51<br />
Sikkim Tripura NER<br />
2000-01 2006-07 2000-01 2006-07 2000-01 2006-07<br />
Agriculture 22.74 19.67 24.92 23.47 32.77 26.98<br />
Industry 9.21 6.98 6.23 5.00 10.15 13.69<br />
Services 68.05 73.34 68.86 71.53 57.08 59.33<br />
Source: CSO.<br />
2.3 Services-driven Economy<br />
The NER is services driven economy having 59 per cent <strong>of</strong> annual average income coming<br />
from services sector (Table 2.3). However, agriculture is the mainstay <strong>of</strong> the economies <strong>of</strong><br />
the NER as it accounts to 27 per cent (2008-09), <strong>and</strong> is a major source <strong>of</strong> employment <strong>and</strong><br />
livelihood for around 80 per cent <strong>of</strong> the population. However agricultural growth has been<br />
uneven across regions <strong>and</strong> crops. The NER continues to be a net importer <strong>of</strong> foodgrains. In<br />
spite <strong>of</strong> covering 8.8 per cent <strong>of</strong> the country’s total geographical area, the NER produces only<br />
1.5 per cent <strong>of</strong> the country’s total foodgrain production.<br />
Agriculture accounts for a major share <strong>of</strong> the economies <strong>of</strong> all the <strong>North</strong> <strong>East</strong>ern states, from<br />
26 per cent in Arunachal Pradesh to 20 per cent in Sikkim in 2008-09. However, the share <strong>of</strong><br />
agriculture has been declining in all the states (except Nagal<strong>and</strong>), indicating that these states<br />
have undergone significant structural changes. With the exception <strong>of</strong> Meghalaya, the share <strong>of</strong><br />
manufacturing in general has been falling, accompanied by an increasing share <strong>of</strong> services.<br />
While agriculture in the NER grew at a much higher rate (4.5 per cent) than the average for<br />
the country (about 1.2 per cent) in last one <strong>and</strong> a half decades, growth rates differ among<br />
different states <strong>of</strong> the region.<br />
A rapid structural change is always associated <strong>with</strong> the economic growth <strong>of</strong> any region.<br />
Growth processes have always been characterized by lessening in emphasis on agricultural<br />
<strong>and</strong> primary activities <strong>and</strong> increasing importance on manufacturing sector (Kubo et al, 1998).<br />
Various countries including India have undergone this structural change (Barua <strong>and</strong><br />
B<strong>and</strong>yopadhyay, 2005).<br />
A structural change in short means a perpetual rise <strong>of</strong> the share <strong>of</strong> manufacturing <strong>and</strong> nonfarm<br />
outputs in the gross domestic product over time. Unfortunately, the share <strong>of</strong><br />
manufacturing in GDP <strong>of</strong> the NER has been only 6 per cent in 2008-09. The share, however,<br />
22<br />
(%)
varies across the States. Thus, the pattern <strong>of</strong> industrial development <strong>of</strong> the NER has not been<br />
in conformity <strong>with</strong> the st<strong>and</strong>ard historical trend even <strong>with</strong> respect to India. That is,<br />
industrialization has failed to take <strong>of</strong>f in the region. This failure to achieve a significant<br />
increase in the share <strong>of</strong> manufacturing in GDP has reflected in the poor growth rates both in<br />
GDP <strong>and</strong> per capita GDP in the NER.<br />
The manufacturing sector <strong>of</strong> the states <strong>of</strong> Manipur, Tripura <strong>and</strong> Meghalaya has fared better<br />
than the national average. However, the growth performance <strong>of</strong> the manufacturing sector in<br />
the remaining states <strong>of</strong> the region has been poor. In Arunachal Pradesh manufacturing sector<br />
has been virtually stagnant. The poor performance <strong>of</strong> the manufacturing sector seems to be<br />
one <strong>of</strong> the prime causes <strong>of</strong> the relatively poor performance <strong>of</strong> GDP growth <strong>of</strong> the region.<br />
The manufacturing sector can be divided into registered <strong>and</strong> unregistered sectors. The<br />
unregistered sector generally comprises <strong>of</strong> small-scale industries including h<strong>and</strong>icrafts.<br />
Assam is by far the largest industrialized state in the region comprising nearly 88 per cent <strong>of</strong><br />
the total industrial units in the region. Nearly 90 per cent <strong>of</strong> the industrial output <strong>of</strong> the<br />
registered manufacturing sector originates in Assam while Arunachal Pradesh has no<br />
registered manufacturing industry.<br />
The industries are mainly mining <strong>and</strong> quarrying, food processing, spinning <strong>and</strong> weaving, pulp<br />
<strong>and</strong> paper, wine <strong>and</strong> malt, bidi, cigars <strong>and</strong> cigarettes, printing, bleaching <strong>and</strong> dying, wool<br />
spinning, wooden products, foot wears, fertilisers <strong>and</strong> chemicals, insulated wires <strong>and</strong> cables<br />
<strong>and</strong> drugs <strong>and</strong> medicines. The manufacturing activities are based on locally available<br />
resources for which the optimal plant sizes are not very large. Industries requiring large scale<br />
production such as petrochemicals, cement, steel <strong>and</strong> sugar are completely absent despite the<br />
fact that the region has the sources <strong>of</strong> basic raw materials required for the production <strong>of</strong> such<br />
goods. For example, there is abundance <strong>of</strong> limestone (in Meghalaya <strong>and</strong> Assam) but there is<br />
not a single cement factory in the region. Assam has the largest oil reserves (non-<strong>of</strong>fshore)<br />
but the state has no large manufacturing unit <strong>of</strong> petrochemical products. On the other h<strong>and</strong>,<br />
we also observe some industries like insulated wires <strong>and</strong> cables coming up in the region<br />
although the region has no known reserves <strong>of</strong> copper.<br />
Another important observation that could be made is that the unregistered sector is relatively<br />
evenly distributed across all the states in the NER. This means that the states <strong>of</strong> the NER have<br />
certain distinctive strengths <strong>and</strong> advantages in h<strong>and</strong>icrafts <strong>and</strong> other small scale industries.<br />
Assam has the largest share in the unorganized sector followed by Manipur. It is evident,<br />
therefore, that the small-scale industries could not play any significant role in the<br />
development <strong>of</strong> the NER.<br />
The NER is a market <strong>of</strong> about 400 million people having international borders <strong>with</strong><br />
Bangladesh, Bhutan, China, Myanmar, <strong>and</strong> Nepal. The region has the potential to develop<br />
into India’s powerhouse, being a vibrant source <strong>of</strong> energy, oil, natural gas, coal, <strong>and</strong><br />
limestone; <strong>and</strong> endowed <strong>with</strong> India’s largest perennial water system in the river Brahmaputra<br />
<strong>and</strong> its tributaries. The NER is also rich in horticultural products, plantation crops,<br />
vegetables, spices, rare herbs, <strong>and</strong> medicinal plants. The region <strong>of</strong>fers unlimited tourism<br />
opportunities, rare flora <strong>and</strong> fauna, natural scenic beauty, unique performing arts, <strong>and</strong> varied<br />
cuisine <strong>and</strong> h<strong>and</strong>icrafts. The region being a great source <strong>of</strong> bamboo <strong>and</strong> a number <strong>of</strong> agro<br />
resources, capacity building in the bamboo sector as well as in other agro-processing areas<br />
should be taken up.<br />
23
2.4 International Engagement <strong>and</strong> Opportunities<br />
The NER is unique in terms <strong>of</strong> opportunities. While it is an industrial desert where almost all<br />
immediate consumables are imported from outside the region, it is the focal point <strong>of</strong> trade<br />
<strong>with</strong>in a vast area. The NER’s locational advantage <strong>and</strong> rich natural resources provide a<br />
backdrop to its development as a base for cooperation not only <strong>with</strong> ASEAN but also <strong>with</strong><br />
neighbouring countries such as Bangladesh, Bhutan, <strong>and</strong> Nepal. And through Myanmar,<br />
regional cooperation centering the NER can be extended to Mekong region, comprising<br />
Cambodia, Lao PDR, Thail<strong>and</strong>, <strong>and</strong> Vietnam. The NER can emerge as a strategic base for<br />
foreign/domestic investors to tap the world’s largest market in SAARC, BIMSTEC, <strong>and</strong><br />
ASEAN. At the same time, it has certain peculiarities <strong>and</strong> problems, which, if tackled <strong>and</strong><br />
leveraged in the right perspective, could yield rich dividends. It is therefore essential to<br />
evolve a regional approach as opposed to individual state approach while drawing trade<br />
policy for the NER.<br />
Supply-side constraints are inhibiting the NER’s two-way trade <strong>with</strong> its two neighbours.<br />
India’s merch<strong>and</strong>ise trade due to Free <strong>Trade</strong> Agreements – regional <strong>and</strong> bilateral FTAs - is<br />
<strong>and</strong> expected to increase by manifolds in coming years, <strong>and</strong> the NER is the central to India’s<br />
trade integration <strong>with</strong> ASEAN. Without improved connectivity, the NER is not likely to<br />
witness higher trade creation <strong>and</strong> expansion <strong>of</strong> its export. Its “l<strong>and</strong>lockedness” negates most<br />
<strong>of</strong> the benefits <strong>of</strong> trade liberalization due mainly to higher transportation cost. Therefore, the<br />
region has to be “l<strong>and</strong>linked” through alternate access to sea <strong>and</strong> rest part <strong>of</strong> India cutting<br />
across Bangladesh. The Kaladan multimodal transport project would cease its<br />
“l<strong>and</strong>lockedness”, but transhipment facility at Chittagong port in Bangladesh <strong>and</strong> transit<br />
through Bangladesh will help facilitate the region’s national <strong>and</strong> international trade in a big<br />
way. In parallel, the region’s physical infrastructure should be complete overhaul,<br />
particularly, road <strong>and</strong> railway infrastructure. Railway facility is yet to penetrate some <strong>of</strong> the<br />
NER states such as Sikkim, Mizoram, <strong>and</strong> Manipur. Higher investment in railway would help<br />
the region to better integrate <strong>with</strong> not only rest part <strong>of</strong> India but also neighbouring countries<br />
such as Bangladesh <strong>and</strong> Myanmar. The need is to link Manipur <strong>and</strong> then the border town<br />
Moreh <strong>with</strong> India’s railway system. Greater aviation network <strong>with</strong> Southeast Asia, Nepal,<br />
Bangladesh <strong>and</strong> China would pave the way in enhancing trade as well as investment in the<br />
region. We should favourably consider Indian <strong>and</strong> foreign airlines to connect the NER <strong>with</strong><br />
Bangkok, Dhaka <strong>and</strong> Singapore. Therefore, connectivity should be the primary area <strong>of</strong><br />
concern for any development in the region.<br />
The NER enjoys very special advantages over other parts <strong>of</strong> India in trade in view <strong>of</strong> India’s<br />
Look <strong>East</strong> Policy (LEP) in general <strong>and</strong> India’s economic engagement <strong>with</strong> her eastern<br />
neighbours through India-ASEAN FTA <strong>and</strong> other bilateral FTAs in particular. Facilitation <strong>of</strong><br />
border trade should be another important priority for the government. The present pattern <strong>of</strong><br />
border trade is restricted trade, particularly between India <strong>and</strong> Myanmar. The <strong>of</strong>ficial trade,<br />
mostly under barter arrangements, is modest <strong>and</strong> dwindling. By far the largest volume <strong>of</strong><br />
trade is taking place through illegal channels. There is need to re-look the contents <strong>of</strong> current<br />
border trade between the two countries <strong>of</strong> around 40 items, many <strong>of</strong> these, <strong>of</strong>fered by<br />
Myanmar are banned for import in that country. A revision <strong>of</strong> the list <strong>of</strong> tradable items for<br />
border trade, to include some <strong>of</strong> the essential items <strong>and</strong> also high value products, which are<br />
currently being traded through illegal channels, may be considered. The NER has to identify<br />
such products, based on supply-dem<strong>and</strong> balances in the region, <strong>and</strong> taking note <strong>of</strong> those in<br />
earlier studies (for example, dairy products, medicines, machinery <strong>and</strong> engineering goods,<br />
construction materials, two-wheelers, car parts, raw materials for textiles, plastic materials,<br />
wood <strong>and</strong> wood products, etc.). Finally, the NER needs to plug into the growing trade <strong>with</strong><br />
24
ASEAN countries particularly in items like bamboo <strong>and</strong> wood products, ores <strong>and</strong> rubber<br />
products, horticulture, etc. At the same time, it is imperative to integrate IT facilities in<br />
promoting infrastructure for trade <strong>with</strong> the ASEAN countries.<br />
There is urgent need to promote interaction <strong>with</strong> neighbouring countries for enhancement <strong>of</strong><br />
cross-border trade <strong>and</strong> investment. We therefore look at these two specific issues in next few<br />
chapters in order to “set-in-place” an international vision for the NER.<br />
25
Chapter 3<br />
NER-Bangladesh Border <strong>Trade</strong>: Emerging Pattern<br />
The primary objective <strong>of</strong> this chapter is to underst<strong>and</strong> the pattern <strong>of</strong> border trade that is taking<br />
place between the NER <strong>and</strong> Bangladesh. This analysis is going to help us understating the<br />
nature <strong>of</strong> constraints that are acting as the barriers to trade between the NER <strong>and</strong> Bangladesh<br />
in later chapters.<br />
3.1 <strong>Trade</strong> between India <strong>and</strong> Bangladesh<br />
<strong>Trade</strong> <strong>of</strong>fers immense opportunities for raising the economic welfare <strong>of</strong> Bangladesh <strong>and</strong><br />
India. Within South Asia, the bilateral trade between India <strong>and</strong> Bangladesh covers more than<br />
one-fourth <strong>of</strong> total regional trade. India has been the largest trading partner <strong>of</strong> Bangladesh for<br />
over last two decades <strong>and</strong> a remarkable growth in India’s two-way trade <strong>with</strong> Bangladesh has<br />
resulted in robust growth <strong>of</strong> all the economies in South Asia. But, the trade between<br />
Bangladesh <strong>and</strong> India is largely one-sided, as the volume <strong>of</strong> imports from India to<br />
Bangladesh is considerably very large, whereas the volume <strong>of</strong> exports from Bangladesh to<br />
India is very low (Figure 3.1). It appears that Bangladesh has a high bilateral trade deficit<br />
<strong>with</strong> India, which has increased from US$ 44 million in 1981 to US$ 2.5 billion in 2009, <strong>and</strong><br />
there is debate whether this is a matter <strong>of</strong> any concern. 12 The last decade (2000-2009) has<br />
witnessed fastest rise in Bangladesh’s export to India (42.65 per cent per annum), whereas<br />
Bangladesh’s import from India during the same period has also reduced to 16.24 per cent per<br />
annum (Figure 3.2). Nevertheless, Bangladesh exports a miniscule (one per cent) share <strong>of</strong><br />
India’s imports, a negligible share (one per cent) <strong>of</strong> its own exports, <strong>and</strong> a small range <strong>of</strong><br />
products (fertilizer <strong>and</strong> jute goods made up two-thirds <strong>of</strong> exports). Although ready-madegarments<br />
(RMG) is the major exportable for Bangladesh, its exports to India are indeed quite<br />
insignificant.<br />
Figure 3.1 Bangladesh’s <strong>Trade</strong> <strong>with</strong> India: 1981-2009<br />
9<br />
8<br />
Import from India<br />
US$ million<br />
7<br />
6<br />
5<br />
4<br />
3<br />
2<br />
1<br />
Export to India<br />
0<br />
1980 1985 1990 1995 2000 2005 2010<br />
*In log scale<br />
Source: IMF DOTS.<br />
Figure 3.2. <strong>Trade</strong> Growth<br />
12 Bangladesh’s perennial large bilateral trade deficit <strong>with</strong> India might be a cause for concern but it has not led<br />
to any balance <strong>of</strong> payments problem for Bangladesh as consistent trade surpluses <strong>with</strong> such trading partners as<br />
US <strong>and</strong> EU compensate for these deficits.<br />
26
(%)<br />
50<br />
45<br />
40<br />
35<br />
30<br />
25<br />
20<br />
15<br />
10<br />
5<br />
0<br />
44.33<br />
42.65<br />
18.47<br />
16.24<br />
13.32<br />
0.79<br />
1981-1990 1991-2000 2001-2009<br />
Export to India<br />
Import from India<br />
Source: IMF DOTS.<br />
Despite India’s unilateral concessions to Bangladesh <strong>and</strong> the existence <strong>of</strong> a large l<strong>and</strong> border<br />
between the two countries, India’s trade <strong>with</strong> Bangladesh is not growing at a considerable<br />
pace. Bilateral trade is highly tilted toward India; India’s exports to Bangladesh are about<br />
US$ 2433.77 million <strong>and</strong> imports from Bangladesh are about US$ 254.66 million. The total<br />
bilateral trade between India <strong>and</strong> Bangladesh witnessed CAGR <strong>of</strong> 7 per cent in 2005-06 to<br />
2009-10, <strong>of</strong> which India’s exports to Bangladesh increased by CAGR <strong>of</strong> 8 per cent during<br />
2005-06 to 2009-10, <strong>and</strong> India’s imports from Bangladesh grew at a much higher pace, 15<br />
per cent, in the entire period. India’s imports from Bangladesh witnessed a higher growth in<br />
the last few years, which, indirectly suggests existence <strong>of</strong> a large trade potential between<br />
India <strong>and</strong> Bangladesh.<br />
Year<br />
Table 3.1: India’s Merch<strong>and</strong>ise <strong>Trade</strong> <strong>with</strong> Bangladesh<br />
<strong>India's</strong> Export to<br />
Bangladesh<br />
<strong>India's</strong> Import from<br />
Bangladesh<br />
(US$ million)<br />
Total Bilateral <strong>Trade</strong><br />
Balance <strong>of</strong> <strong>Trade</strong><br />
(BOT)<br />
2005-06 1664.36 127.03 1791.39 1537.33<br />
2006-07 1629.57 228 1857.57 1401.57<br />
2007-08 2923.72 257.02 3180.74 2666.7<br />
2008-09 2497.87 313.11 2810.98 2184.76<br />
2009-10 2433.77 254.66 2688.43 2179.11<br />
Source: DGCIS, Govt. <strong>of</strong> India.<br />
27
Table 3.2: India’s Top Ten Export Commodity Groups to Bangladesh in 2009-10<br />
HS Code<br />
Commodity groups<br />
Export<br />
(US$ million)<br />
52 Cotton 455.29<br />
7 Edible vegetables <strong>and</strong> certain roots <strong>and</strong> tubers 251.52<br />
87<br />
Vehicles other than railway or tramway rolling stock, <strong>and</strong> parts <strong>and</strong><br />
accessories<br />
244.02<br />
23 Residues <strong>and</strong> waste from the food industries; prepared animal fodder 198.22<br />
72 Iron <strong>and</strong> steel 133.69<br />
27<br />
Mineral fuels, mineral oils <strong>and</strong> products <strong>of</strong> their distillation;<br />
bituminous substances; mineral waxes<br />
131.11<br />
10 Cereals 121.00<br />
29 Organic chemicals 84.40<br />
54 Man-made filaments 75.61<br />
84<br />
Source: DGCIS, Govt. <strong>of</strong> India.<br />
Nuclear reactors, boilers, machinery <strong>and</strong> mechanical appliances; parts<br />
there<strong>of</strong>.<br />
India’s export to Bangladesh has increased considerably in the last few years. Table 3.2<br />
depicts India’s major exported commodities to Bangladesh in 2009-10. Top 10 export<br />
commodity groups from India to Bangladesh accounts for about 72 per cent <strong>of</strong> India’s total<br />
exports to Bangladesh. India’s export basket to Bangladesh is dominated by cereals, cotton<br />
<strong>and</strong> vegetable products. These products contribute more than 30 per cent <strong>of</strong> total Indian<br />
export to Bangladesh. Other important products in the Indian export basket are residues <strong>and</strong><br />
waste from the food industries, iron <strong>and</strong> steel, mineral fuels, mineral oils <strong>and</strong> products <strong>of</strong> their<br />
distillation etc. India imports much less than its exports to Bangladesh. Table 3.3 presents the<br />
major imported commodity groups by India from Bangladesh. Major products imported from<br />
Bangladesh are vegetable products, textile articles <strong>and</strong> fishes. The top ten imported products<br />
accounts for about 79 per cent <strong>of</strong> total imports from Bangladesh.<br />
65.21<br />
Table 3.3: India’s Top Ten Import Commodity Groups from Bangladesh in 2009-10<br />
HS Code<br />
Commodity Groups<br />
53 Other vegetable textile fibres; paper yarn <strong>and</strong> woven fabrics <strong>of</strong> paper<br />
yarn.<br />
63 Other made up textile articles; sets; worn clothing <strong>and</strong> worn textile<br />
articles; rags<br />
Import (US$<br />
million)<br />
55.26<br />
51.18<br />
3 Fish <strong>and</strong> crustaceans, molluscs <strong>and</strong> other aquatic invertebrates. 25.43<br />
25 Salt; sulphur; earths <strong>and</strong> stone; plastering materials, lime <strong>and</strong> cement. 19.99<br />
74 Copper <strong>and</strong> articles there<strong>of</strong>. 11.58<br />
28 Inorganic chemicals; organic or inorganic compounds <strong>of</strong> precious metals,<br />
<strong>of</strong> rare-earth metals, or radi. elem. or <strong>of</strong> isotopes.<br />
9.79<br />
41 raw hides <strong>and</strong> skins (other than fur skins) <strong>and</strong> leather 7.91<br />
28
HS Code<br />
Commodity Groups<br />
Import (US$<br />
million)<br />
31 Fertilizers. 7.30<br />
72 Iron <strong>and</strong> steel 7.01<br />
52 Cotton. 6.16<br />
Source: DGCIS, Govt. <strong>of</strong> India.<br />
Table 3.4: India’s <strong>Trade</strong> Intensity Indices <strong>with</strong> Bangladesh<br />
Year<br />
India’s Export Intensity Indices <strong>with</strong><br />
Bangladesh (x ij )<br />
India’s Import Intensity Indices <strong>with</strong><br />
Bangladesh (m ij )<br />
2005 13.87 0.81<br />
2006 10.41 1.28<br />
2007 10.93 1.11<br />
2008 14.78 0.98<br />
2009 8.12 0.64<br />
Source: calculated based on Export-Import databank, Government <strong>of</strong> India.<br />
The trade intensity indices on both imports <strong>and</strong> exports demonstrate the bilateral trade<br />
orientation <strong>of</strong> a country <strong>with</strong> its trading partner. 13 Export <strong>and</strong> import intensity indices have<br />
been calculated for India’s trade <strong>with</strong> Bangladesh for the period 2005-2009. The results are<br />
noted in Table 3.4. It is observed that India’s export intensities <strong>with</strong> Bangladesh were much<br />
higher than its import indices. This implies that India exported more to Bangladesh than it<br />
imported from Bangladesh leading to the balance <strong>of</strong> trade being in India’s favour. This is a<br />
disappointing picture from Bangladesh point <strong>of</strong> view. Though the export-import relationship<br />
should be looked at the world trade level rather than bilateral level, yet this trade imbalance<br />
still has some economic <strong>and</strong> political implications for Bangladesh. Secondly, low indices for<br />
exports <strong>and</strong> imports, which were far below from the desired level <strong>of</strong> 100, imply that India-<br />
Bangladesh bilateral trade is not as high as it should be. So there is a scope for mutual trade<br />
expansion between the two countries.<br />
13 Export Intensity Index (xij) = (Xij/Xi) / (Mj/Mw-Mi), where, xij = Export intensity index <strong>of</strong> trade <strong>of</strong> country i<br />
<strong>with</strong> country j, Xij = Exports <strong>of</strong> country i to trading partner j, Xi = Total exports <strong>of</strong> country i Mj = Total imports<br />
<strong>of</strong> country j, Mw = Total world imports, Mi = Total imports <strong>of</strong> country i. Import Intensity Index (mij) =<br />
(Mij/Mi) / (Xj/ Xw-Xi), where mij = import intensity index <strong>of</strong> trade <strong>of</strong> country i <strong>with</strong> country j, Mij = Imports <strong>of</strong><br />
a country i from trading partner j, Mi = Total imports <strong>of</strong> country i, Xj = Total exports <strong>of</strong> country j, Xw = Total<br />
world exports, Xi = Total exports <strong>of</strong> country i. The value <strong>of</strong> index ranges from 0 to 100. If the value is zero, it<br />
implies no trade relationship between partner countries. On the other h<strong>and</strong>, if the value <strong>of</strong> import intensity index<br />
is more (or less) than 100, it indicates that country i is importing more (or less) from country j than might be<br />
expected from that country’s share in total world trade. In the case <strong>of</strong> exports, the same argument also holds<br />
true.<br />
29
3.3 <strong>Trade</strong> between NER <strong>and</strong> Bangladesh<br />
India <strong>and</strong> Bangladesh share almost 4096.70 km long international borders. Out <strong>of</strong> which the<br />
<strong>North</strong> <strong>East</strong>ern Region (NER), comprising <strong>of</strong> Arunachal Pradesh, Assam, Manipur,<br />
Meghalaya, Mizoram, Nagal<strong>and</strong> <strong>and</strong> Tripura, shares almost 1880 km border <strong>with</strong> Bangladesh<br />
(wherein 1434 km is l<strong>and</strong> border <strong>and</strong> 446 km is riverine tract). Four states <strong>of</strong> the NER,<br />
namely, Assam, Meghalaya, Tripura, <strong>and</strong> Mizoram shares international borders <strong>with</strong><br />
Bangladesh (Table 3.5). Except Meghalaya, rest <strong>of</strong> the NER states share both l<strong>and</strong> <strong>and</strong><br />
riverine border <strong>with</strong> Bangladesh, among which Tripura <strong>and</strong> Mizoram have the longest l<strong>and</strong><br />
<strong>and</strong> riverine border <strong>with</strong> Bangladesh respectively. However, a large part <strong>of</strong> this international<br />
border <strong>with</strong> Bangladesh is pours. Map 3.1 presents international border that the NER shares<br />
<strong>with</strong> Bangladesh.<br />
Map 3.1: NER-Bangladesh International Border <strong>and</strong> Selected LCSs<br />
3.3.1 <strong>Trade</strong> Flows between NER <strong>and</strong> Bangladesh<br />
The first <strong>Trade</strong> Agreement between India <strong>and</strong> Bangladesh was signed in 1972. The India-<br />
Bangladesh <strong>Trade</strong> Agreement (IBTA) has been renewed for a period <strong>of</strong> three years up to 31<br />
March 2012. It governs the present trading arrangements between the two countries. To<br />
facilitate NER-Bangladesh border trade in goods <strong>and</strong> services, the Government <strong>of</strong> India<br />
through the Office <strong>of</strong> the Commissioner <strong>of</strong> Custom in Shillong has set-up 26 L<strong>and</strong> Customs<br />
Stations (LCS) along the NER-Bangladesh borders. Out <strong>of</strong> the 26 LCS, 20 are functional <strong>and</strong><br />
remaining 6 are non-functional LCSs (Table 3.6(a)). Table 3.6(b) shows the state-wise<br />
distribution <strong>of</strong> LCSs in the NER <strong>of</strong> India <strong>and</strong> their counterparts in Bangladesh.<br />
30
Table 3.5: NER-Bangladesh Border Length<br />
State L<strong>and</strong> border Riverine Total<br />
(km)<br />
Assam 160 103 263<br />
Meghalaya 443 - 443<br />
Tripura 773 83 856<br />
Mizoram 58 260 318<br />
Total 1434 446 1880<br />
Source: NEC.<br />
Table 3.6(a): State-wise Distribution <strong>of</strong> LCSs in NER Dealing NER-Bangladesh <strong>Trade</strong><br />
State Functional Non-functional Total<br />
Assam 5 3 8<br />
Meghalaya 8 2 10<br />
Mizoram 0 1 1<br />
Tripura 7 0 7<br />
Total 20 6 26<br />
Source: Office <strong>of</strong> the Commissioner <strong>of</strong> Custom, Shillong.th<br />
State<br />
Assam<br />
Meghalaya<br />
Table 3.6(b): State-wise List <strong>of</strong> LCSs Dealing NER-Bangladesh <strong>Trade</strong><br />
No.<br />
LCS in NER No. LCS in Bangladesh<br />
Functional<br />
1 Karimganj Steamer ghat <strong>and</strong> Ferry Station (Karimganj 1 Jakiganj (Sylhet division)<br />
district)<br />
2 Sutark<strong>and</strong>i (Karimganj district) 2 Sheola (Sylhet division)<br />
3 Guwahati Steamerghat (Kamrup district) 3 --<br />
4 Dhubri Steamer ghat (Dhubri district) 4 Rowmati (Mymansing division)<br />
5 Mankachar (Dhubri district) 5 Natun B<strong>and</strong>ar (Rongpur division)<br />
Non-functional<br />
6 Mahisashan Rly. Station (Karimganj district) 6 Shahbazpur (Sylhet division).<br />
7 Golakganj (Dhubri district) 7 Sonahaat(Rongpur Division)<br />
8 Silchar RMS 8 Independent <strong>of</strong> any border<br />
Functional<br />
1 Borsora (West Khasi Hills district) 1 Borsora (Sunamganj division)<br />
2 Bholaganj (<strong>East</strong> Khasi Hills district) 2 Chatak (Sunamganj division)<br />
3 Dawki (Jaintia Hills district) 3 Tamabil (Sylhet division)<br />
4 Shellabazar (West Khasi Hills district) 4 Sunamganj(Sylhet division)<br />
5 Baghmara (West Khasi Hills district) 5 Bijoypur (Mymansing division)<br />
6 Dalu (West Garo Hills district) 6 Naku Gaon (Mymansing division)<br />
7 Ghasuapara (South Garo Hills district) 7 Karoitol (Mymansing division)<br />
8 Mahendraganj (West Garo Hills district) 8 Dhannua Kamalpur (Mymansing division)<br />
Non-functional<br />
9 Ryngku (<strong>East</strong> Khasi Hills district) 9 Kalibari (Sonamganj division)<br />
10 Balat (<strong>East</strong> Khasi Hills district) 10 Dolura (Sylhet division)<br />
Non-functional<br />
Mizoram 1 Demagiri (Lunglei district) 1 Rangamati (Sylhet division)<br />
Functional<br />
1 Agartala (Tripura West district) 1 Akhaura ( Comilla division)<br />
Tripura<br />
2 Srimantapur (Tripura district) 2 Bibir Bazar (Comilla division)<br />
3 Dhalaighat (Dhalai district) 3 Kumarghat (Sunamganj division)<br />
4 Khowaighat (Tripura West district) 4 Balla (Habiganj division )<br />
5 Manu( Dhalai district) 5 Chatlapur (Sylhet division )<br />
6 Muhurighat (Tripura South district) 6 Belonia (Feni division )<br />
7 Old Ragnabazar(Tripura <strong>North</strong> district) 7 Betul (Fultali) (Sylhet division)<br />
Source: Office <strong>of</strong> the Commissioner <strong>of</strong> Custom, Shillong.<br />
31
Out <strong>of</strong> the four NER states having international borders <strong>with</strong> Bangladesh, except Mizoram,<br />
the NER-Bangladesh trade mainly flows through Assam, Meghalaya <strong>and</strong> Tripura. A 2-year<br />
average (2006-08) <strong>of</strong> the NER-Bangladesh trade shows that the share <strong>of</strong> Meghalaya in the<br />
NER-Bangladesh trade is the highest (Table 3.7). The contribution <strong>of</strong> Meghalaya to the total<br />
volume <strong>of</strong> the NER-Bangladesh trade st<strong>and</strong>s at 63.83 per cent; the same for Tripura <strong>and</strong><br />
Assam are 18.26 <strong>and</strong> 17.91 per cent respectively. While both Assam-Bangladesh <strong>and</strong><br />
Meghalaya-Bangladesh trade are characterized by higher export <strong>and</strong> negligible import,<br />
Tripura-Bangladesh trade exhibits just opposite trends, that is, higher import <strong>and</strong> lower<br />
export.<br />
States<br />
Table 3.7: NER-Bangladesh <strong>Trade</strong> Volume<br />
Volume (2-years Share in Total<br />
Average, 2006-08)<br />
<strong>Trade</strong><br />
(Rs. lakh) (%)<br />
Assam 7049.00 17.91<br />
Meghalaya 25120.84 63.83<br />
Tripura 7185.14 18.26<br />
NER total 39,354.98 100.00<br />
Source: Office <strong>of</strong> the Commissioners <strong>of</strong> Customs, Shillong.<br />
Table 3.8: Trends in Assam-Bangladesh <strong>Trade</strong>, 2-years Average, 2006-08<br />
LCS<br />
Export Import Total<br />
Volume Share Volume Share Volume Share<br />
(Rs. lakh) (%) (Rs. lakh) (%) (Rs. lakh) (%)<br />
Karimganj Steamer & Ferry 396.50 8.35 36.00 1.57 432.50 6.14<br />
Station<br />
Sutark<strong>and</strong>i 3785.00 79.67 2232.00 97.09 6017.00 85.35<br />
Guwahati Steamer Ghat 549.50 11.57 21.50 0.93 571.00 8.10<br />
Mankachar 19.50 0.41 9.50 0.41 29.00 0.41<br />
Assam total 4750.50 100.00 2299.00 100.00 7049.50 100.00<br />
Source: Office <strong>of</strong> the Commissioners <strong>of</strong> Customs, Shillong.<br />
32
Figure 3.3: Trends in Export <strong>and</strong> Import <strong>with</strong> Bangladesh: Assam<br />
Karimganj LCS<br />
Mankachar LCS<br />
Rs. crore<br />
0 .5 1 1.5 2 2.5<br />
1995 2000 2005 2010<br />
Rs. crore<br />
0 .05 .1 .15 .2<br />
R s . c r o r e<br />
0 .0 5 .1 . 1 5<br />
kg_ex<br />
kg_im<br />
Guwahati Airport LCS<br />
1995 2000 2005 2010<br />
ga_ex<br />
ga_im<br />
Rs. crore<br />
0 1 2 3 4 5<br />
1995 2000 2005 2010<br />
mk_ex<br />
mk_im<br />
Sutark<strong>and</strong>i LCS<br />
1995 2000 2005 2010<br />
sk_ex<br />
ex_im<br />
Figure 3.3 presents trends in export <strong>and</strong> import through LCSs in Assam. Assam-Bangladesh<br />
trade mainly flows through Sutark<strong>and</strong>i LCS in South Assam. Sutak<strong>and</strong>i is located in the<br />
district <strong>of</strong> Karimganj in Barak Valley, about 85 per cent <strong>of</strong> the Assam-Bangladesh trade<br />
flows through this LCS (Table 3.8). Sutark<strong>and</strong>i presently h<strong>and</strong>les Rs. 6 crore <strong>of</strong> annual<br />
average trade, <strong>of</strong> which Rs. 4 crore is export <strong>and</strong> Rs. 2 crore is import (Table 3.8). All the<br />
LCSs deal both export <strong>and</strong> import <strong>with</strong> Bangladesh.<br />
33
Figure 3.4: Trends in Export <strong>and</strong> Import <strong>with</strong> Bangladesh: Meghalaya<br />
Baghmara LCS<br />
Borsora LCS<br />
R s. crore<br />
0 .1 .2 .3 .4 .5<br />
1995 2000 2005 2010<br />
R s. crore<br />
0 5 1 0 1 5<br />
1995 2000 2005 2010<br />
bs_ex<br />
bs_im<br />
bm_ex<br />
bm_im<br />
R s. crore<br />
0 1 2 3<br />
Bholaganj LCS<br />
1995 2000 2005 2010<br />
bg_ex<br />
bg_im<br />
R s. crore<br />
0 .5 1 1.5 2 2.5<br />
Dalu LCS<br />
1995 2000 2005 2010<br />
dl_ex<br />
dl_im<br />
Dawki LCS<br />
R s. crore<br />
0 5 1 0 1 5<br />
1995 2000 2005 2010<br />
dk_ex<br />
dk_im<br />
34
Ghasupara LCS<br />
Hatisar LCS<br />
R s. cr o re<br />
0 2 4 6<br />
R s . c ro re<br />
0 1 2 3 4 5<br />
1995 2000 2005 2010<br />
gp_ex<br />
gp_im<br />
1995 2000 2005 2010<br />
ha_ex<br />
hs_im<br />
Mahendraganj LCS<br />
Shellabazar LCS<br />
R s . c ro re<br />
0 . 5 1 1 .5 2<br />
R s . c ro re<br />
0 5 1 0 1 5 2 0<br />
1995 2000 2005 2010<br />
mg_ex<br />
mg_im<br />
1995 2000 2005 2010<br />
sb_ex<br />
sb_im<br />
In Meghalaya, out <strong>of</strong> 8 functional LCSs, Borsora <strong>and</strong> Ghasuapara in Garo Hills <strong>and</strong> Dawki in<br />
Jaintia Hills play the dominant role in Meghalaya-Bangladesh trade. About Rs. 24 crore <strong>of</strong><br />
India-Bangladesh trade is presently contributed by the Meghalaya. Figure 3.4 presents LCSwise<br />
trend in export <strong>and</strong> import. Borsora contributes about 42 per cent <strong>of</strong> the total<br />
Meghalaya-Bangladesh trade <strong>and</strong> the same for Dawki <strong>and</strong> Ghasuapara are 22 <strong>and</strong> 17 per cent<br />
respectively (Table 3.9). A significant amount <strong>of</strong> trade also flows through LCSs located at<br />
Shellabazar, Mahendraganj, Dalu <strong>and</strong> Bholaganj (Table 3.9). Borsora LCS presently h<strong>and</strong>les<br />
a total export <strong>of</strong> about Rs. 10 crore to Bangladesh – the highest in the NER. Import from<br />
Bangladesh through Mahendraganj LCS is the highest in the state, sharing about 94 per cent<br />
<strong>of</strong> total import <strong>of</strong> Meghalaya from Bangladesh (Table 3.9). Barring Mahendraganj, Dalu <strong>and</strong><br />
Dawki, other LCSs in Meghalaya do not deal <strong>with</strong> import from Bangladesh. Borsora in<br />
export <strong>and</strong> Mahendraganj in import are the busiest LCSs in Meghalaya.<br />
35
LCS<br />
Table 3.9: Meghalaya-Bangladesh <strong>Trade</strong>, 2-years Average, 2006-08<br />
Export Import Total<br />
Volume Share Volume Share Volume Share<br />
(Rs. lakh) (%) (Rs. lakh) (%) (Rs. lakh) (%)<br />
Borsora 10253.00 42.93 0.00 0.00 10253.00 41.96<br />
Bholaganj 1049.50 4.39 0.00 0.00 1049.50 4.30<br />
Dawki 5425.50 22.71 0.75 0.14 5426.25 22.21<br />
Shellabazar 1845.00 7.72 0.00 0.00 1845.00 7.55<br />
Baghmara 68.00 0.28 0.00 0.00 68.00 0.28<br />
Dalu 1123.50 4.70 30.09 5.54 1153.59 4.72<br />
Ghasuapara 4048.00 16.95 0.00 0.00 4048.00 16.57<br />
Mahendraganj 76.50 0.32 512.50 94.32 589.00 2.41<br />
Meghalaya total 23889.00 100.00 543.34 100.00 24432.34 100.00<br />
Source: Office <strong>of</strong> the Commissioners <strong>of</strong> Customs, Shillong.<br />
LCS<br />
Table 3.10: Tripura-Bangladesh <strong>Trade</strong>, 2-years Average, 2006-08<br />
Export Import Total<br />
Volume Share Volume Share Volume Share<br />
(Rs. lakh) (%) (Rs. lakh) (%) (Rs. lakh) (%)<br />
Agartala 57.00 42.04 6644.50 94.25 6701.50 93.27<br />
Srimantapur 75.00 55.31 384.00 5.45 459.00 6.39<br />
Dhalaighat 0.00 0.00 0.00 0.00 0.00 0.00<br />
Khowaighat 0.03 0.02 1.50 0.02 1.53 0.02<br />
Manu 0.07 0.05 3.05 0.05 3.12 0.04<br />
Muhurighat 0.00 0.00 0.00 0.00 0.00 0.00<br />
Old Ragnabazar 3.50 2.58 16.50 0.23 20.00 0.28<br />
Tripura total 135.60 100.00 7049.54 100.00 7185.15 100.00<br />
Source: Office <strong>of</strong> the Commissioners <strong>of</strong> Customs, Shillong.<br />
Tripura h<strong>and</strong>les about Rs. 7 crore <strong>of</strong> annual trade <strong>with</strong> Bangladesh, which is mostly import.<br />
Most <strong>of</strong> the trade in the state (93.27 per cent) flows through Agartala LCS. Figure 3.5 shows<br />
trends in export <strong>and</strong> import at selected LCSs in Tripura. Some trade also passes through<br />
Srimantapur LCS (6.39 per cent). Flow <strong>of</strong> trade through LCSs like Dhalaighat, Khowaighat,<br />
Manu, Muhurighat <strong>and</strong> Old Ragnabazar is insignificant (Table 3.10).<br />
36
Figure 3.5: Trends in Export <strong>and</strong> Import <strong>with</strong> Bangladesh: Tripura<br />
Agartala LCS<br />
Manu LCS<br />
R s. crore<br />
0 2 4 6 8<br />
1998 2000 2002 2004 2006 2008<br />
ag_ex<br />
ag_im<br />
R s. crore<br />
0 .002 .00 4 .006<br />
1998 2000 2002 2004 2006 2008<br />
ma_ex<br />
ma_im<br />
Rs. crore<br />
0 .0005 .001 .0015<br />
Khowaighat LCS<br />
1998 2000 2002 2004 2006 2008<br />
kh_ex<br />
kh_im<br />
R s. crore<br />
0 .01 .02 .03<br />
Old Ragnabazar LCS<br />
1998 2000 2002 2004 2006 2008<br />
or_ex<br />
or_im<br />
Srimantapur LCS<br />
Rs. crore<br />
0 .2 .4 .6<br />
1998 2000 2002 2004 2006 2008<br />
sp_ex<br />
sp_im<br />
37
3.3.2 Commodity-wise <strong>Trade</strong> between NER <strong>and</strong> Bangladesh<br />
<strong>Trade</strong> between the NER <strong>and</strong> Bangladesh is uneven <strong>and</strong> not diversified. Official trade between<br />
the NER <strong>and</strong> Bangladesh is concentrated in agricultural commodities, processed foods,<br />
minerals <strong>and</strong> garments. We present top three export <strong>and</strong> import items traded between the<br />
NER states <strong>and</strong> Bangladesh in Tables 3.11 (Tripura), 3.12 (Meghalaya) <strong>and</strong> 3.13 (Assam).<br />
Appendix 3.1 presents a detailed list <strong>of</strong> items exchanged between the NER <strong>and</strong> Bangladesh<br />
through <strong>of</strong>ficial channels. A minute scrutiny <strong>of</strong> these tables tells us that while the NER export<br />
is dominated by raw materials like coal, limestone, boulders <strong>and</strong> agro-horticultural products<br />
like ginger <strong>and</strong> citrus fruits, imports from Bangladesh is mostly finished goods like cement,<br />
synthetic fabric, readymade garments, <strong>and</strong> processed food.<br />
Table 3.11: Tripura-Bangladesh <strong>Trade</strong>: Top Three <strong>Trade</strong> Items<br />
(a) Export*<br />
LCS YEAR EXPORT ITEM 1 EXPORT ITEM 2 EXPORT ITEM 3<br />
Agartala 1998 Fruits Rohu fish Onion<br />
Agartala 2001 Coal Ginger Dry fish<br />
Agartala 2007 Dry fish (varieties ) Dry chilli Bamboo muli<br />
Khowai 1998 Ginger Fruits Fruits<br />
Manu 1998 Ginger<br />
Manu 2001 Ginger<br />
Manu 2007 Fruits<br />
Old Ragna Bazar 1998 Ginger Fruits Basmati rice<br />
Old Ragna Bazar 2001 Ginger Onion Tomato<br />
Old Ragna Bazar 2007 Fruits (citrus ) Fruits Ginger<br />
Srimantipur 1998 Project goods Ginger Rui fish<br />
Srimantipur 2001 Potato Ginger Fruits<br />
Srimantipur 2007 Raw hides <strong>and</strong> skins Bamboo muli Ginger<br />
*Arranged according to the volume <strong>of</strong> export to Bangladesh.<br />
(b) Import*<br />
LCS YEAR IMPORT ITEM1 IMPORT ITEM 2 IMPORT ITEM 3<br />
Agartala 1998 Hilsa fish Dry fish Potato waffers<br />
Agartala 2001 Hilsa fish Dry fish Mineral water / Juice<br />
Agartala 2007 Small fish (varieties ) Broken or crushed stone Cement<br />
Khowai 2001 Hilsa fish<br />
Khowai 2007 Broken or crushed stone<br />
Manu 1998 Urad pulse Dry ginger Moong pulse<br />
Manu 2007 Crushed stone Small fish varieties<br />
Old Ragna Bazar 2007 Loundry soap Zinc flakes Other knitted or crocheted fabrics<br />
Srimantipur 1998 Cotton yarn waste<br />
Srimantipur 2007 Cement Lay flat tube Broken or crushed stone<br />
*Arranged according to the volume <strong>of</strong> export to Bangladesh.<br />
38
Table 3.12: Meghalaya-Bangladesh <strong>Trade</strong>: Top Three <strong>Trade</strong>d Items<br />
(a) Export*<br />
LCS YEAR EXPORT ITEM1 EXPORT ITEM 2 EXPORT ITEM 3<br />
Bagmara 1998 Lime Stone Cement Boulder stone<br />
Baghmara 2007 Coal<br />
Bholaganj 1998 Lime Stone Cement Boulder stone<br />
Bholaganj 2001 Lime Stone Boulder stone<br />
Bholaganj 2007 Lime Stone<br />
Borsora 1998 Coal Limestone<br />
Borsora 2001 Coal Lime stone<br />
Borsora 2007 Coal Lime stone<br />
Dalu 1998 Coal<br />
Dalu 2001 Coal Stone chips S<strong>and</strong> stone<br />
Dalu 2007 Coal<br />
Dawki 1998 Coal Rice (non basmati) Orange<br />
Dawki 2001 Coal Orange Boulder stone<br />
Dawki 2007 Coal Raw hides <strong>and</strong> skins Orange<br />
Ghasupara 1998 Coal Crushed stone Boulder stone<br />
Ghasupara 2001 Coal Ginger Stone chips<br />
Ghasupara 2007 Coal<br />
Mahendraganj 1998 Coal Crushed stone Boulder stone<br />
Mahendraganj 2001 Coal Stone chips Ballast stone<br />
Mahendraganj 2007 Coal Ginger Tamarind<br />
Shellabazar 1998 Limestone<br />
Shellabazar 2001 Lime Stone<br />
Shellabazar 2007 Lime Stone Shale<br />
*Arranged according to the volume <strong>of</strong> export to Bangladesh.<br />
(b) Import*<br />
LCS YEAR IMPORT ITEM 1 IMPORT ITEM 2 IMPORT ITEM 3<br />
Dawki 2001 Betel nut<br />
Dawki 2007 Food/ edible items<br />
Mahendraganj 2007 Synthetic net fabrics Float glass Cotton waste<br />
Shellabazar 2001 Hilsa fish Processed food products<br />
*Arranged according to the volume <strong>of</strong> import from Bangladesh.<br />
39
Table 3.13: Assam-Bangladesh <strong>Trade</strong>: Top Three <strong>Trade</strong>d Items<br />
(a) Export*<br />
LCS YEAR EXPORT ITEM 1 EXPORT ITEM 2 EXPORT ITEM 3<br />
Amingaon 1998 Tea<br />
Amingaon 2001 Tea Incense stick powder Steel distalation plate<br />
Amingaon 2007 Tea Stainless steel<br />
Hatisar 2007 H.s.d.o. Motor spirit<br />
Karimganj 1998 Non (b) rice Ginger Chillies<br />
Karimganj 2001 Coal Ginger Orange<br />
Karimganj 2007 Ginger Fresh orange Fresh fruits (citrus )<br />
L.G.B.I Airport 2001 Dahena loudh Perfumery compound Aquilaria agallocha<br />
L.G.B.I Airport 2007 Indian perfumery compound Perfume bukhur<br />
Mankachar 2007 Coal Dry fish<br />
Sutark<strong>and</strong>i 1998 Coal N. Basmati rice Ginger<br />
Sutark<strong>and</strong>i 2001 Coal Marble slabs / tiles Orange<br />
Sutark<strong>and</strong>i 2007 Coal Quick lime<br />
*Arranged according to the volume <strong>of</strong> export to Bangladesh.<br />
(b) Import*<br />
LCS YEAR IMPORT ITEM 1 IMPORT ITEM 2 IMPORT ITEM 3<br />
Amingaon 1998 News Print/ Multi Paper<br />
Amingaon 2001 Paper / Tea Sacks Laminated polythene bags Lamp black beads<br />
Amingaon 2007<br />
Bamboo Processing And<br />
Weaving Machinery<br />
Mineral fibre board<br />
Project goods<br />
Hatisar 2007 Bhutan Liquor Plywood Boulder stone<br />
Karimganj 1998 Hilsa Fish<br />
Karimganj 2001 Ginger Bamboo Muli Motor parts<br />
Karimganj 2007 Other Knitted Or Crocheted<br />
Fbrics Of Synthetic Fibre<br />
Cement<br />
L.G.B.I Airport 2001 Perfurmery Compound Aquilaria agallocha<br />
Soap<br />
L.G.B.I Airport 2007 Miscellaneous Goods Electronic goods Baggage<br />
Mankachar 2007 Readymade Garments<br />
Printed book calendar <strong>and</strong><br />
cops<br />
40
Sutark<strong>and</strong>i 1998 Hilsa Fish<br />
Sutark<strong>and</strong>i 2007 Soyabean Oil Cement<br />
*Arranged according to the volume <strong>of</strong> import from Bangladesh.<br />
The NER’s export products to Bangladesh are distinctly different from major export lines<br />
from other parts <strong>of</strong> India to Bangladesh. A quick look at the product-wise trade between the<br />
NER <strong>and</strong> Bangladesh indicates a complementarity between the resource structure <strong>of</strong> the NER<br />
<strong>and</strong> dem<strong>and</strong> structure <strong>of</strong> Bangladesh. 14 Bangladesh lacks in mineral resources like coal <strong>and</strong><br />
limestone which the country imports from the NER. Due to weak resource industry-linkages,<br />
manufacturing base <strong>of</strong> the NER remained underdeveloped <strong>and</strong> hence in return the NER<br />
imports manufacturing goods from Bangladesh. This provides a firm basis for trade<br />
expansion between the two regions. 15<br />
3.4 Case Studies on India-Bangladesh Border <strong>Trade</strong><br />
3.4.1 Assam-Bangladesh Sector<br />
India-Bangladesh border trade through Assam–Bangladesh sector is dominated by export<br />
from India to Bangladesh. Table 3.14 exhibits that except for 2004-05 <strong>and</strong> 2007-08, annual<br />
growth rate has all along been positive. Assam’s export to Bangladesh has also not shown<br />
any wide fluctuations. As has already been mentioned, Meghalaya origin minerals like coal<br />
<strong>and</strong> limestone are mainly exported through LCSs in Assam. This indicates that there is a<br />
steady dem<strong>and</strong> for those minerals in Bangladesh. As far as import is concerned, although the<br />
volume <strong>of</strong> import has started increasing since 2003-04, but the wide fluctuations in year on<br />
year%age change in import perhaps exhibits unsteady dem<strong>and</strong> for the products <strong>of</strong> Bangladesh<br />
in Assam.<br />
Table 3.14: Pattern <strong>of</strong> India-Bangladesh Border <strong>Trade</strong> through Assam-Bangladesh<br />
Sector<br />
Export Import Total <strong>Trade</strong><br />
Year (Rs. lakh) % change (Rs. lakh) % change (Rs. lakh) % Change<br />
2000-01 1064.50 88.90 1153.40<br />
2001-02 1767.10 66.00 106.86 20.20 1873.96 62.47<br />
2002-03 2869.00 62.36 21.67 -79.72 2891.00 54.27<br />
2003-04 4829.00 68.32 155.75 618.74 4984.75 72.42<br />
2004-05 2461.25 -49.03 662.00 325.04 3123.25 -37.34<br />
2005-06 3567.60 44.95 920.31 39.02 4487.91 43.69<br />
2006-07 5238.55 46.84 3063.65 232.89 8302.20 84.99<br />
2007-08 4215.43 -19.53 2154.67 -29.67 6370.10 -23.27<br />
2008-09 4834.56 14.69 2543.12 18.03 7377.68 15.82<br />
Source: Office <strong>of</strong> the Commissioner <strong>of</strong> Customs, Shillong.<br />
14 This was also widely discussed in Das <strong>and</strong> Thomas (2008)<br />
15 According to Brunner (2010), export potential lies in food or fruit processing, bamboo <strong>and</strong> cane products,<br />
jute, floriculture, aromatic plants, aromatic <strong>and</strong> medicinal herbs, spices, rubber, forest products, natural resource<br />
products, tea <strong>and</strong> other plantation crops, inl<strong>and</strong> freshwater fishing, among others.<br />
41
Out <strong>of</strong> five functional LCSs in Assam, we have selected three for case studies. Two in South<br />
Assam, viz., Sutark<strong>and</strong>i <strong>and</strong> Karimganj Steamer <strong>and</strong> Ferry Station (KSFS) through which the<br />
bulk <strong>of</strong> the interregional trade flows <strong>and</strong> one from lower Assam, viz., Mankachar, having<br />
border <strong>with</strong> Bangladesh.<br />
(a) Sutark<strong>and</strong>i LCS<br />
Sutark<strong>and</strong>i LCS was notified in 1948, immediately after the independence, in order to keep<br />
the natural flow <strong>of</strong> trade between Sylhet <strong>and</strong> Cachar which was disrupted due to partition. In<br />
fact, Karimganj was a part <strong>of</strong> the undivided Sylhet district which was added to Cachar<br />
following the Sylhet referendum. Karimganj is well connected <strong>with</strong> Sylhet <strong>of</strong> Bangladesh<br />
through roadways, railways <strong>and</strong> waterways. Sutark<strong>and</strong>i LCS is the l<strong>and</strong> border port in Indian<br />
side <strong>and</strong> Seola is the border port in Bangladesh side. Mainly Meghalaya origin coal <strong>and</strong><br />
quicklime are exported to Bangladesh through Sutark<strong>and</strong>i LCS. Commodities like Vanaspati,<br />
Synthetic Fruit Drinks, Cotton Waste, Cement, Melamine, Tableware, Synthetic Fibres, <strong>and</strong><br />
Aerated water are usually imported. However, as revealed by the trade figures as well as from<br />
the interview <strong>of</strong> the traders, both export <strong>and</strong> import are declining in Sutark<strong>and</strong>i overtime.<br />
<strong>Trade</strong>rs have cited a number <strong>of</strong> reasons for this decline. Due to bad road condition <strong>and</strong><br />
excessive collection at the various gates along Ladrymbai-Karimganj road, cost <strong>of</strong> trade has<br />
been increased manifold which has, in turn, reduced the pr<strong>of</strong>itability <strong>and</strong> hence many <strong>of</strong> the<br />
traders have already quit business.<br />
(b) Karimganj Steamer <strong>and</strong> Ferry Station (KSFS)<br />
Karimganj Steamer <strong>and</strong> Ferry Station (KSFS) was notified in 1948. River Barak passes<br />
through Karimganj in India <strong>and</strong> Zakiganj (Sylhet) in Bangladesh. In fact, river Barak acts as<br />
border demarcation. Indo-Bangladesh trade here flows across the river. The volume <strong>of</strong> trade<br />
that flows through KSFS is not as bulk as through Sutark<strong>and</strong>i. Indian exporters mainly export<br />
agro-horticultural products like fresh fruits, ginger, orange <strong>and</strong> bamboo which are mainly<br />
grown in the hills like Mizoram, <strong>North</strong> Cachar Hills <strong>and</strong> Meghalaya. The importers mainly<br />
import cement for which there is a good market in the Valley. Besides cement, knitted<br />
synthetic fabric, woven fabrics <strong>and</strong> soap are also imported through this LCS. It may be noted,<br />
as the river plays the role <strong>of</strong> ‘no man’s l<strong>and</strong>” at KSFS, people can easily move across this<br />
border <strong>with</strong> luggage as they travel by boat. This facility is not available in case <strong>of</strong> Sutark<strong>and</strong>i<br />
as no vehicles are allowed to travel through “no man’s l<strong>and</strong>” across Sutark<strong>and</strong>i <strong>and</strong> Seola. As<br />
a result, it is convenient for the passengers to cross through KSFS than through Sutark<strong>and</strong>i.<br />
The volume <strong>of</strong> trade that flows through KSFS is not very significant. However, whatever<br />
trade flows across the Barak river is characterized by the dominance <strong>of</strong> export from the<br />
Indian side. As high volume low value products like citrus fruits, agro-horticultural products<br />
<strong>and</strong> forest products are exported to Bangladesh from KSFS, volume <strong>of</strong> trade does not reflect<br />
the flurry <strong>of</strong> trade LCS<br />
(c) Mankachar<br />
Mankachar is located in the eastern part <strong>of</strong> Dhubri which has border <strong>with</strong> the Rajsahi district<br />
<strong>of</strong> Bangladesh. Mankachar LCS was notified in 1950. It is connected <strong>with</strong> Natun B<strong>and</strong>ar<br />
(Rajsahi) in Bangladesh. There are two authorized routes through which cross border trade<br />
flows: (i) Tura-Rahumari road, <strong>and</strong> (ii) Kalo river from the approach <strong>of</strong> Tura road to the<br />
Jinjiram river. The volume <strong>of</strong> trade flows through Mankachar is not very significant. <strong>Trade</strong>rs<br />
basically export coals <strong>of</strong> Garo hills origin through Mankachar to Bangladesh. Besides coal,<br />
42
dry fish is also occasionally exported. <strong>Trade</strong>rs also import some amount <strong>of</strong> ready made<br />
garments from Bangladesh. Volume <strong>of</strong> trade that flows through Mankachar is not very<br />
significant. However, whatever trade flows across the border is found to be unidirectional,<br />
i.e., exports from Indian side to Bangladesh. As has already been mentioned, coal from<br />
Garohills is mainly exported this LCS.<br />
3.4.2 Meghalaya-Bangladesh Sector<br />
Meghalaya contributes the majority share <strong>of</strong> the NER-Bangladesh trade (more than 63 per<br />
cent <strong>of</strong> the interregional trade). However, the trade through Meghalaya-Bangladesh sector is<br />
characterized by unidirectional flow <strong>of</strong> export from Indian side to Bangladesh (Table 3.15).<br />
Except for 2004-05, the annual growth <strong>of</strong> export for all the years during 2000-2007 has been<br />
positive which indicates stability in export. However, the trade decelerated in 2007-08,<br />
presumably due to global economic crisis.<br />
Table 3.15: Pattern <strong>of</strong> India-Bangladesh Border <strong>Trade</strong> through Meghalaya-Bangladesh<br />
Sector<br />
Year Export Import Total <strong>Trade</strong><br />
(Rs. lakh) % change (Rs. lakh) % change (Rs. lakh) % Change<br />
2000-01 12050.75 - 0.40 12051.14<br />
2001-02 16344.35 35.63 2.55 537.50 16346.90 35.65<br />
2002-03 17199.00 5.23 6.40 150.98 17205.00 5.25<br />
2003-04 18851.31 9.61 25.70 301.56 18877.01 9.72<br />
2004-05 16378.54 -13.12 32.82 27.70 16411.36 -13.06<br />
2005-06 17950.70 9.60 207.53 532.33 18158.23 10.64<br />
2006-07 23538.18 31.13 499.61 140.74 24037.79 32.38<br />
2007-08 23654.12 0.49 554.92 11.07 24209.04 0.71<br />
2008-09 24043.56 1.65 578.23 4.20 24621.79 1.70<br />
Source: Office <strong>of</strong> the Commissioner <strong>of</strong> Customs, Shillong<br />
Out <strong>of</strong> eight functional LCSs in Meghalaya, four were surveyed in this study - one each from<br />
Jaintia Hills (Dawki), West Khasi Hills (Borsora), West Garo Hills (Dalu) <strong>and</strong> South Garo<br />
Hills (Baghmara).<br />
(a) Dawki<br />
Dawki in the Jaintia Hills District borders <strong>with</strong> Tamabil (Sylhet) in Bangladesh. As the<br />
district has rich deposits <strong>of</strong> coal for which there is a huge dem<strong>and</strong> in Bangladesh, Dawki has<br />
become one <strong>of</strong> the important border point for coal trade. As the traditional Shillong-Sylhet<br />
road passes through Dawki, the place is known for centre <strong>of</strong> traditional hills-plain trade. The<br />
LCS at Dawki was notified in 1948. Although there are three authorized routes for trade, viz.,<br />
(i) Piyan river, (ii) Shillong-Sylhet road, <strong>and</strong> (iii) Rangpani river which flows down to<br />
Bangladesh plain, trade basically flows through the Shillong-Sylhet road. Some trade,<br />
43
particularly, during the rainy season also takes place through river routes. <strong>Trade</strong>rs from<br />
Meghalaya export coal, limestone, raw hides, citrus fruits <strong>and</strong> horticultural products. They<br />
import synthetic drinks, potato crackers, fruit juice <strong>and</strong> miscellaneous food products from<br />
Bangladesh. <strong>Trade</strong> through Dawki is basically centered on the export <strong>of</strong> coal from Jaintia<br />
Hills, limestone <strong>and</strong> horticultural products <strong>of</strong> <strong>East</strong> Khasi Hills origin. As a result, trade is<br />
almost unidirectional as import is insignificant compared to export. In spite <strong>of</strong> fluctuations in<br />
export during 2004-07, Dawki is considered to be one <strong>of</strong> the widely used border trading port<br />
as the road connectivity across the border is better.<br />
(b) Borsora<br />
Borsora in West Khasi Hills (Meghalaya) borders <strong>with</strong> Borsora in Sylhet (Bangladesh). The<br />
LCS at the Indian side was notified in 1951. There are five authorized routes for trade under<br />
this LCS. These are: (i) Cherragaon (India) to Cherragaon (Bangladesh), (ii) Borsora<br />
(india)—Tahirpur via Borsora (Bangladesh), (iii) Trolley track from Chalitacherra quary to<br />
Samsar in Bangladesh, (iv) Trolley track from Gauripur (India) to Samsar in Bangladesh, <strong>and</strong><br />
(v) Jadukata river. All the l<strong>and</strong> routes <strong>and</strong> trolley tracks are used for trade whenever these are<br />
fit for vehicular movement. The river route is also used for trade during the rainy season.<br />
<strong>Trade</strong>rs from Borsora export coal <strong>and</strong> limestones <strong>of</strong> West Khasi Hills origin to Bangladesh.<br />
<strong>Trade</strong>rs are reported to have not imported anything from Bangladesh through this LCS.<br />
(c) Dalu<br />
Dalu in West Garo Hills <strong>of</strong> Meghalaya (India) borders <strong>with</strong> Nakugaon in Bangladesh. The<br />
LCS at Dalu was notified in 1950. As the Garo hills districts are rich in mineral resources like<br />
coal, limestone, clay, phosphorus, etc, the locally mined minerals are exported to Bangladesh<br />
across the border. The LCS has two authorized routes, viz., (i) Bhugai river <strong>and</strong> (ii) Dalu-<br />
Naltabari road. Currently regular trade flows through the l<strong>and</strong> route <strong>and</strong> the river route is used<br />
for trade only during the rainy season. <strong>Trade</strong>rs from Dalu exports only coal to Bangladesh.<br />
They import, although not significant, readymade garments, bleaching powder <strong>and</strong> synthetic<br />
net fabrics from Bangladesh. <strong>Trade</strong> at Dalu is also mainly centered on the export <strong>of</strong> coal from<br />
Garo Hills to Bangladesh. Till 2005-06, no import was reported through this LCS.<br />
(d) Baghmara<br />
Baghmara is the headquarter <strong>of</strong> the South Garo Hills District. It is situated on the banks <strong>of</strong><br />
Simsang River on the Bangladesh border. The LCS at Baghmara was notified in 1950. It is<br />
connected to Bijoypur in Bangladesh across the border. There are two authorized routes for<br />
trade under this LCS, viz., (i) Baghmara-Durgapur road <strong>and</strong> (ii) Someshwari river. <strong>Trade</strong>rs<br />
from Baghmara export coal <strong>of</strong> Garohills origin to Bangladesh. No import is recorded at this<br />
LCS for last couple <strong>of</strong> years. Baghmara is not a widely used LCS through which traders<br />
export to Bangladesh. It is mainly used while the export routes in other LCSs in Garohills are<br />
choked particularly due to rain or other natural hazards. Although traders occasionally use<br />
Baghmara for export, they have not reported any import through Baghmara.<br />
44
Table 3.16: Pattern <strong>of</strong> India-Bangladesh Border <strong>Trade</strong><br />
through Tripura-Bangladesh Sector<br />
Year Export Import Total <strong>Trade</strong><br />
(Rs. lakh) % change (Rs. lakh) % change (Rs. lakh) % Change<br />
2000-01 75.33 630.68 706.01<br />
2001-02 130.00 72.57 442.62 -29.82 572.00 -18.98<br />
2002-03 152.80 17.54 582.48 31.60 735.28 28.55<br />
2003-04 138.49 -9.37 970.63 66.64 1109.12 50.84<br />
2004-05 202.43 46.17 978.30 0.79 1180.73 6.46<br />
2005-06 73.63 -63.63 3559.34 263.83 3632.97 207.69<br />
2006-07 86.56 17.56 4339.22 21.91 4425.78 21.82<br />
2007-08 112.54 30.01 6342.87 46.18 6455.41 45.86<br />
2008-09 142.43 26.56 7983.45 25.86 8125.88 25.88<br />
Source: Office <strong>of</strong> the Commissioner <strong>of</strong> Customs, Shillong.<br />
3.4.3 Tripura-Bangladesh Sector<br />
Unlike Assam <strong>and</strong> Meghalaya, cross-border trade in Tripura is characterized by the<br />
dominance <strong>of</strong> import from Bangladesh. As Tripura is located at the furthest corner <strong>of</strong> the<br />
country, import from Bangladesh proves to be more cost-effective than import from the<br />
mainl<strong>and</strong> India. It is due to the geographical distance. As has already been mentioned, while<br />
Kolkata is 1680 km from Agartala via the Siliguri Corridor, the distance reduces to only 400<br />
km when travelled via Dhaka.<br />
Thus, fourfold reduction in distance reduces transport cost by four times. This transport cost<br />
differential between Agartala-Dhaka <strong>and</strong> Agartala-Kolkata makes Dhaka as the lucrative<br />
source for import than Kolkata. Table 3.16 shows that import is more stable than export.<br />
Except 2001-02, all year on year growth rates are positive. One may not miss to note that<br />
there has been a sudden decline in export <strong>and</strong> rise in import since 2005-06. <strong>Trade</strong>rs feel that it<br />
is because <strong>of</strong> the border fencing which has helped in channelizing the informal imports into<br />
the formal route <strong>and</strong> simultaneously negatively impacted the <strong>of</strong>ficial export due to increased<br />
surveillance. Out <strong>of</strong> the seven functional LCSs in Tripura, we have chosen only Agartala for<br />
case study.<br />
(a) Agartala LCS<br />
Agartala LCS was notified in 1949 <strong>and</strong> is located about 2 km away from the Agartala town<br />
opposite to Akhaura in Bangladesh. The trade flows through authorized Agartala-Akhaura<br />
road. As Agartala is far away from the mainl<strong>and</strong> India, due to the l<strong>and</strong>locked location <strong>of</strong> the<br />
state, import from Bangladesh in some cases is more beneficial than importing them from<br />
mainl<strong>and</strong> India. However, due to supply constraints export trade is not very vibrant. <strong>Trade</strong>rs<br />
<strong>of</strong> Agartala import food items, synthetic drinks, cement, crushed stones, bricks, float glass,<br />
plastic items <strong>and</strong> readymade garments from Bangladesh. They also occasionally export citrus<br />
fruits, bamboo, dry fish, dry chilly, etc to Bangladesh.<br />
45
3.5 Summing Up<br />
In sum, the pattern <strong>of</strong> India-Bangladesh border trade that flows through the NER-Bangladesh<br />
sector is characterized by resource-industry linkages. The rationale <strong>of</strong> the trade lies in free<br />
trade principle. Some critical minerals which are available in the NER but not available in<br />
Bangladesh provide the basis <strong>of</strong> the NER-Bangladesh trade. What follows is that the NER’s<br />
export products to Bangladesh are distinctly different from major export lines from rest part<br />
<strong>of</strong> India to Bangladesh. The product-wise trade between the NER <strong>and</strong> Bangladesh indicates a<br />
complementarity between the resource structure <strong>of</strong> the NER <strong>and</strong> dem<strong>and</strong> structure <strong>of</strong><br />
Bangladesh. Bangladesh lacks in mineral resources like coal <strong>and</strong> limestone which the country<br />
imports from the NER. Due to weak resource industry-linkages, manufacturing base <strong>of</strong> the<br />
NER remained underdeveloped <strong>and</strong> hence in return the NER imports manufacturing goods<br />
from Bangladesh. This provides a firm basis for trade expansion between the two regions. We<br />
found following features <strong>of</strong> the pattern <strong>of</strong> India-Bangladesh trade.<br />
(a) Export from the NER to Bangladesh dominates NER-Bangladesh trade.<br />
(b) The NER exports raw materials like coal, limestone, stone chips, bamboo, etc to<br />
Bangladesh <strong>and</strong> imports manufactured goods like cement, plastic goods, readymade<br />
garments, process food <strong>and</strong> drinks.<br />
(c) Minerals <strong>of</strong> Meghalaya origin are basically exported to Bangladesh through the LCSs <strong>of</strong><br />
Assam <strong>and</strong> Meghalaya.<br />
(d) <strong>Trade</strong> flows through Tripura-Bangladesh sector is dominated by imports from<br />
Bangladesh.<br />
(e) As the resource structure <strong>of</strong> the NER <strong>and</strong> dem<strong>and</strong> structure <strong>of</strong> Bangladesh are<br />
complementary to each other, there exists a huge potential for trade between these two<br />
regions. As the NER exports industrial raw material to Bangladesh, trend <strong>of</strong> NER’s export is<br />
found to be stable.<br />
(f) Export trade in exhaustible resources like coal <strong>and</strong> limestone suffers from severe<br />
limitations in that the trade dries up <strong>with</strong> the depletion <strong>of</strong> stock <strong>of</strong> resources. As a result, for<br />
sustainable growth it is important to diversify the export basket <strong>and</strong> also to add value to<br />
export by switching over from export <strong>of</strong> raw materials to export <strong>of</strong> processed/semi-processed<br />
goods.<br />
46
Appendix 3.1: LCS-wise Major Export <strong>and</strong> Import since 2006-2008<br />
State LCS Export Import<br />
Karimganj Steamerghat Ginger, citrus fruits, orange, dry<br />
<strong>and</strong> Ferry Station fish, chaw-chai squash, bamboo,<br />
Assam<br />
Meghalaya<br />
Cement, other knitted items <strong>of</strong> synthetic<br />
fibre <strong>and</strong> woven fabrics, molasses <strong>and</strong><br />
soap.<br />
Sutark<strong>and</strong>i Coal <strong>and</strong> quick lime Cement , hilsha fish, ,synthetic drinks,<br />
roasted or fried vegetable products, chips,<br />
sugar confectionary, woollen <strong>and</strong> metal<br />
furniture, cap, empty cartoon, melamine<br />
table <strong>and</strong> kitchen ware, soap, semai,<br />
sanitary napkin, “Pran” c<strong>and</strong>y, gum c<strong>and</strong>y,<br />
potato crackers, roasted peanuts, edible oil,<br />
fruit juice, picky chips, molasses, chutney,<br />
cotton waste ,other knitted crocheted <strong>of</strong><br />
synthetic fibre, biscuits, dry cell battery,<br />
aerated water, rose water <strong>and</strong> float glass .<br />
Guwahati Steamerghat High Speed Diesel Cement<br />
Dhubri Steamerghat - -<br />
Mankachar Coal, crushed stone & dry fish. Readymade garments, printed book <strong>and</strong><br />
calendar.<br />
Borsora Coal & lime stone. nil<br />
Bholaganj Lime stone & boulder stone. nil<br />
Dawki<br />
Coal, limestone, boulder stone,<br />
quartz stone, tomato, raw hides &<br />
skin, orange, citrus fruits.<br />
Food items.<br />
Shellabazar Lime stone & shale. nil<br />
Baghmara Coal. -<br />
Dalu Coal, lime stone & boulder stone. Readymade garments, synthetic net fabric<br />
<strong>and</strong> bleaching powder.<br />
Ghasuapara Coal & ginger -<br />
Mahendraganj<br />
Coal, boulder stone, crushed<br />
stone, ginger, tamarind &<br />
bamboo.<br />
Tripura Agartala Raw hides & skin, tomato, potato,<br />
ginger, dry chili, dry fish, bamboo<br />
& refined soya bean oil.<br />
Synthetic net fabrics, cotton waste,<br />
readymade garments, float glasses.<br />
Cement, crushed stone, quick lime, hilsha<br />
<strong>and</strong> other small fish, dry fish, salted fish,<br />
jute rope, raw jute, animal feed, soya bean<br />
oil , other knitted or crotched synthetic<br />
fibre, ,molasses, food items, palm oil, lay<br />
flat tube, cotton waste , ceramic tiles,<br />
aerated water, synthetic drinks, float<br />
glasses, h<strong>and</strong> pump, matters <strong>of</strong> cellular<br />
rubber ,other trashing machine, zinc<br />
flakes, brick crusher machine, resins, other<br />
household articles, agricultural<br />
machineries, dry cell battery, biscuits,<br />
potato chips <strong>and</strong> crackers, , vanaspati,<br />
cashew net (in shell), plastic frame <strong>of</strong><br />
door/window, cosmetics <strong>and</strong> toilet items,<br />
waste <strong>of</strong> synthetic fibre, mango juice,<br />
wooden, plastic <strong>and</strong> metal furniture,<br />
weeder machine, knitted cotton fabrics,<br />
foot wear, machine for framing foundry<br />
mould <strong>of</strong> s<strong>and</strong>, melamine table <strong>and</strong> kitchen<br />
ware , PVC pipes <strong>and</strong> tubes, other house<br />
hold articles, soap, other threshing<br />
machine, jamdani saree, slurry pump,<br />
ceramic tiles, cori<strong>and</strong>er, iron drum,<br />
sweater, vacuum pump,<br />
47
Srimantapur<br />
Ginger, potato, parts &<br />
accessories <strong>of</strong> agricultural<br />
products, sanitary ware, tamarind<br />
, motor cycles parts, raw hides &<br />
skin, bay leaves (Tez pata), palm<br />
oil, coloured woven fabrics,<br />
agarbatti, braziers, printed<br />
pictures, marble stone & bamboo.<br />
Broken or crushed stone, cement, synthetic<br />
drinks, lay flat tube, PVC pipes &filters,<br />
foods items, molasses, soya bean oil, head<br />
gear <strong>of</strong> textile fabrics, woven <strong>and</strong><br />
polyester fibre, other non-knitted<br />
crocheted fibre, aerated water, palm oil,<br />
float glass, cotton saree soap, ceramic tiles,<br />
mosquito net.<br />
Dhalaighat nil nil<br />
Khowaighat - Crushed stone.<br />
Manu Jack fruits, orange & tomato Hilsha <strong>and</strong> other small fishes <strong>and</strong> crushed<br />
stone.<br />
Muhurighat - -<br />
Old Ragnabazar Ginger, citrus fruits & orange Printed mosquito net, woven synthetic<br />
staple fibre, other crocheted fabrics <strong>of</strong><br />
cotton, vest, zinc flakes, ceramic tiles,<br />
plastic frames <strong>of</strong> doors <strong>and</strong> windows, foot<br />
wear, laundry soap.<br />
Source: Office <strong>of</strong> the Commissioner <strong>of</strong> Custom, Shillong.<br />
48
Appendix 3.2<br />
Important Agreements / MoUs for Facilitating Economic Cooperation between<br />
India <strong>and</strong> Bangladesh<br />
<br />
<br />
<br />
<br />
<br />
<br />
<br />
<br />
<br />
<br />
<br />
<br />
<br />
<br />
The first <strong>Trade</strong> Agreement between India <strong>and</strong> Bangladesh was signed in 1972. The India-<br />
Bangladesh <strong>Trade</strong> Agreement has been renewed for a period <strong>of</strong> three years up to 31<br />
March 2012. It governs the present trading arrangements between the two countries.<br />
Other Agreements/MoUs for facilitating trade <strong>and</strong> economic linkages include:<br />
Protocol on Inl<strong>and</strong> Water Transit <strong>and</strong> <strong>Trade</strong> (IWTT);<br />
Bilateral Air Services Agreement between India <strong>and</strong> Bangladesh;<br />
Bilateral Agreement on the Establishment <strong>of</strong> Joint Economic Commission (JEC);<br />
India-Bangladesh Convention for the Avoidance <strong>of</strong> Double Taxation;<br />
India-Bangladesh Agreement for the Regulation <strong>of</strong> motor vehicle passenger traffic;<br />
Agreement on Revised Travel Arrangements between India <strong>and</strong> Bangladesh;<br />
Rules for Interchange <strong>of</strong> Traffic between India <strong>and</strong> Bangladesh;<br />
MOU between BIS <strong>and</strong> BSTI for cooperation in the area <strong>of</strong> st<strong>and</strong>ards;<br />
MOU for cooperation in the field <strong>of</strong> agriculture;<br />
MOU for cooperation in the field <strong>of</strong> science <strong>and</strong> technology;<br />
Protocols for operation <strong>of</strong> passenger bus service between Dhaka <strong>and</strong> Kolkata, <strong>and</strong> Dhaka<br />
<strong>and</strong> Agartala;<br />
Bilateral <strong>Investment</strong> Protection <strong>and</strong> Promotion Agreement (BIPPA); Discussions are also<br />
underway for concluding agreement on regulation <strong>of</strong> passenger <strong>and</strong> cargo vehicular<br />
traffic;<br />
Agreement on Bulk Power Transmission between Power Grid Corporation <strong>of</strong> India<br />
Limited <strong>and</strong> Bangladesh Power Development Board.<br />
49
Chapter 4<br />
NER-Myanmar Border <strong>Trade</strong>: Emerging Pattern<br />
The objective <strong>of</strong> this chapter is to discuss the India–Myanmar trade pattern in general <strong>and</strong> the<br />
border trade in particular. The discussion in this chapter will help us underst<strong>and</strong>ing the nature<br />
<strong>of</strong> “behind the border” issues that are prohibiting the trade to grow between the NER <strong>and</strong><br />
Myanmar in later chapters.<br />
4.1 <strong>Trade</strong> between India <strong>and</strong> Myanmar<br />
Since early 1990s, <strong>with</strong> the adoption <strong>of</strong> Look <strong>East</strong> Policy (LEP), India-Myanmar engagement<br />
has been growing on substantive ground <strong>and</strong> increasing being structured. Several empirical<br />
studies show the extent <strong>of</strong> economic integration between South <strong>and</strong> Southeast Asia, where<br />
Myanmar has been playing the lead catalytic role. 16 Myanmar is the l<strong>and</strong>-bridge that connects<br />
world’s two largest markets – South <strong>and</strong> Southeast Asia. It is therefore an important country<br />
for both India <strong>and</strong> ASEAN that helps integrate economies across the border.<br />
India’s change in policy towards Myanmar has paid a rich dividend. For example, the<br />
bilateral trade between India <strong>and</strong> Myanmar has grown from US$ 12 million in 1980 to about<br />
US$ 1.5 billion in 2009, increased by an extraordinary 46 per cent per annum in the last two<br />
decades (Table 4.1). The bilateral trade between the two countries increased exponentially<br />
(Figure 4.1 (a, b)) over time. In particular, the last decade witnessed the fastest growth in<br />
bilateral trade (Table 4.2), helped the bilateral trade to reach US$ 1.4 billion in 2009. This<br />
phenomenal rise in bilateral trade has been driven by Myanmar’s increasing exports to India.<br />
Today, Myanmar exports goods worth about US$ 1.09 billion goods to India, which<br />
contributes to 85 per cent <strong>of</strong> total bilateral trade <strong>and</strong> one-fifth <strong>of</strong> Myanmar’s exports to the<br />
world (Figure 4.2). In contrast, Myanmar’s export to China is half <strong>of</strong> what is exported to<br />
India. What follows is that India is Myanmar’s the second largest export destination, next to<br />
Thail<strong>and</strong>. 17<br />
Year<br />
Table 4.1: India-Myanmar Bilateral <strong>Trade</strong><br />
Export Import Total <strong>Trade</strong> BOT<br />
(US$ million)<br />
1980 4.770 7.620 12.390 -2.850<br />
1990 1.435 90.144 91.579 -88.709<br />
2000 48.050 179.175 227.225 -131.125<br />
2001 53.047 197.809 250.856 -144.762<br />
2002 71.528 345.639 417.167 -274.111<br />
2003 86.001 390.768 476.769 -304.767<br />
2004 104.705 400.052 504.757 -295.347<br />
2005 111.322 495.952 607.274 -384.630<br />
2006 132.717 718.395 851.112 -585.678<br />
16 Refer, for exemple, Francois et al. (2009), Das et al (2005), etc.<br />
17 Refer Appendix 4.1, which provides top 10 trading partners <strong>of</strong> Myanmar.<br />
50
2007 174.020 802.793 976.813 -628.773<br />
2008 212.230 893.916 1106.146 -681.686<br />
2009 209.778 1195.260 1405.038 -985.482<br />
Source: IMF DOTS.<br />
Table 4.2: Growth in India’s <strong>Trade</strong> <strong>with</strong> Myanmar*<br />
Export Import Total<br />
Periods (%)<br />
1980-1989 -215.89 76.58 76.14<br />
1990-1999 46.80 63.17 69.20<br />
2000-2009 75.96 115.83 119.40<br />
1990-2009 32.45 44.60 45.92<br />
Note: *Compound Annual Growth Rate (CAGR).<br />
Source: IMF DOTS.<br />
While India’s increasing trade deficit <strong>with</strong> Myanmar is a matter <strong>of</strong> concern, that increased<br />
from miniscule US$ 2.5 million in 1980 or about US$ 131 million in turning <strong>of</strong> the last<br />
decade to about US$ 1 billion in 2009, India has been providing a consistently higher market<br />
access to Myanmar, which is perhaps the highest in volume that India provides to the LDCs<br />
in the world. If trade liberalization is one <strong>of</strong> the determinants that helped Myanmar to<br />
increase her export to India, trade facilitation by opening <strong>of</strong> border trade between the two<br />
countries in 1995 is equally responsible for higher bilateral trade between the two countries in<br />
later years, particularly since 1997 onward. Since then India has become Myanmar’s one <strong>of</strong><br />
the largest trading partners. Nevertheless, India exports a miniscule (less than one per cent)<br />
share <strong>of</strong> India’s global export, a negligible share (even less than one per cent) <strong>of</strong> its own<br />
imports, <strong>and</strong> a small range <strong>of</strong> imports (edible vegetables <strong>and</strong> wood <strong>and</strong> articles) <strong>and</strong> relatively<br />
diversified exports (pharmaceuticals, iron <strong>and</strong> steel <strong>and</strong> electrical machinery).<br />
Figure 4.1(a): India’s Merch<strong>and</strong>ise <strong>Trade</strong> <strong>with</strong> Myanmar: 1980-2009<br />
8<br />
7<br />
Import from Myanmar<br />
6<br />
5<br />
in log scale<br />
4<br />
3<br />
Export to Myanmar<br />
2<br />
1<br />
0<br />
-1<br />
1980<br />
1981<br />
1982<br />
1983<br />
1984<br />
1985<br />
1986<br />
1987<br />
1988<br />
1989<br />
1990<br />
1991<br />
1992<br />
1993<br />
1994<br />
1995<br />
1996<br />
1997<br />
1998<br />
1999<br />
2000<br />
2001<br />
2002<br />
2003<br />
2004<br />
2005<br />
2006<br />
2007<br />
2008<br />
2009<br />
Source: IMF DOTS.<br />
51
Figure 4.1(b): India’s <strong>Trade</strong> <strong>with</strong> Myanmar: Exponential Trend<br />
1200<br />
1000<br />
800<br />
y = 1E-128e 0.1501x<br />
R 2 = 0.9136<br />
US$ million<br />
600<br />
400<br />
y = 1E-166e 0.193x<br />
R 2 = 0.8201<br />
200<br />
0<br />
1980<br />
1981<br />
1982<br />
1983<br />
1984<br />
1985<br />
1986<br />
1987<br />
1988<br />
1989<br />
1990<br />
1991<br />
1992<br />
1993<br />
1994<br />
1995<br />
1996<br />
1997<br />
1998<br />
1999<br />
2000<br />
2001<br />
2002<br />
2003<br />
2004<br />
2005<br />
2006<br />
2007<br />
2008<br />
2009<br />
2010<br />
2011<br />
Export Import Expon. (Import) Expon. (Export)<br />
Source: IMF DOTS.<br />
Figure 4.2: Trends in <strong>Trade</strong> Share: Myanmar’s <strong>Trade</strong> <strong>with</strong> India<br />
90<br />
80<br />
70<br />
60<br />
50<br />
%<br />
40<br />
30<br />
20<br />
10<br />
0<br />
-10<br />
1980<br />
1981<br />
1982<br />
1983<br />
1984<br />
1985<br />
1986<br />
1987<br />
1988<br />
1989<br />
1990<br />
1991<br />
1992<br />
1993<br />
1994<br />
1995<br />
1996<br />
1997<br />
1998<br />
1999<br />
2000<br />
2001<br />
2002<br />
2003<br />
2004<br />
2005<br />
2006<br />
2007<br />
2008<br />
2009<br />
Import<br />
Export<br />
Source: IMF DOTS.<br />
52
HS<br />
CODE<br />
Table 4.3: Indian Exports to Myanmar: Top 10 Commodity Groups in 2009-10<br />
Commodity<br />
53<br />
Export<br />
Share*<br />
(US$ Million) (%)<br />
30 Pharmaceutical products 55.98 27.00<br />
72 Iron <strong>and</strong> steel 37.99 18.32<br />
85 Electrical machinery <strong>and</strong> equipment 16.69 8.05<br />
27 Mineral fuels, mineral oils <strong>and</strong> products 12.87 6.21<br />
40 Rubber <strong>and</strong> articles there<strong>of</strong>. 8.79 4.24<br />
39 Plastic <strong>and</strong> articles 8.37 4.04<br />
84 Machinery <strong>and</strong> mechanical appliances 8.14 3.93<br />
52 Cotton 5.96 2.87<br />
73 Articles <strong>of</strong> iron or steel 5.67 2.74<br />
23 Residues <strong>and</strong> waste from food industries 4.52 2.18<br />
Total 164.98 79.57<br />
Note: *Share in India’s total export to Myanmar.<br />
Source: Government <strong>of</strong> India.<br />
India’s export to Myanmar has increased considerably in the last few years. Table 4.3 presents<br />
India’s top 10 exported commodities to Myanmar in 2009-10, whereas Table 4.5 shows top 10<br />
exported products at a disaggregated level (6-digit HS) for the years 2009-10 <strong>and</strong> 2000-01. Indian<br />
exports to Myanmar are relatively diversified where the top 10 commodity groups account for about<br />
80 per cent <strong>of</strong> India’s total exports to Myanmar in 2009-10. India’s export basket to Myanmar is<br />
dominated by finished goods such as pharmaceutical products, iron <strong>and</strong> steel, electrical machinery<br />
<strong>and</strong> equipment, which contribute about 2/3 rd <strong>of</strong> total Indian export to Myanmar. Other important<br />
products in the Indian export basket are residues <strong>and</strong> waste from the food industries, mineral fuels,<br />
mineral oils <strong>and</strong> products <strong>of</strong> their distillation, rubber <strong>and</strong> products, plastic <strong>and</strong> products, machinery<br />
<strong>and</strong> mechanical appliances, cotton etc. During 2000-01 <strong>and</strong> 2009-10, Indian exports to Myanmar<br />
increased substantially <strong>and</strong> also witnessed a compositional change. In contrast, while India’s<br />
imports from Myanmar are three times higher than its exports to Myanmar, imports are mainly<br />
primary products <strong>and</strong> relatively less diversified.<br />
Table 4.4: Indian Imports from Myanmar: Top 10 Commodity Groups in 2009-10<br />
HS<br />
Commodity<br />
Import Share<br />
CODE<br />
(US$ Million) (%)<br />
7 Edible vegetables <strong>and</strong> certain roots 851.53 65.89<br />
44 Wood <strong>and</strong> articles <strong>of</strong> wood 404.95 31.33<br />
17 Sugars <strong>and</strong> sugar confectionery. 16.84 1.30<br />
5 Products <strong>of</strong> animal origin 6.22 0.48<br />
9 C<strong>of</strong>fee, tea, mate <strong>and</strong> spices. 3.07 0.24<br />
41 Raw hides <strong>and</strong> skins <strong>and</strong> leather 2.05 0.16<br />
8 Edible fruit <strong>and</strong> nuts; peel or citrus fruit 1.77 0.14<br />
99 Miscellaneous goods. 1.24 0.10<br />
96 Miscellaneous manufactured articles. 0.54 0.04<br />
12 Oil seeds <strong>and</strong> olea. Fruits; misc. Grains, 0.51 0.04<br />
Total 1288.72 99.72<br />
Note: *Share in India’s total export to Myanmar.<br />
Source: Government <strong>of</strong> India.
Table 4.4 presents the major imported commodity groups by India from Myanmar, where<br />
Table 4.6 shows the same at 6-digit level. Major products imported from Myanmar are edible<br />
vegetables, <strong>and</strong> wood <strong>and</strong> wood products, which together account for about 97 per cent <strong>of</strong><br />
total imports from Myanmar. However, composition <strong>of</strong> Indian imports from Myanmar has<br />
not changed much over time. Finally, India’s trade <strong>with</strong> Myanmar witnessed a higher growth<br />
in the last decade, which indirectly suggests existence <strong>of</strong> a large trade potential between the<br />
two countries.<br />
54
HS<br />
CODE<br />
Commodity<br />
271019 Other Petroleum Oils And Oils Obtaind From Bituminous<br />
Minerals Etc<br />
Table 4.5: Trends in Top 10 Indian Exports to Myanmar at 6-digit HS<br />
2009-10 HS Commodity<br />
2000-01<br />
(US$ Million) CODE<br />
(US$ Million)<br />
12.79 300490 Other Medcne Put Up For Retail Sale 3.61<br />
230400 Oil-Cake & Othr Solid Residue W/N Grnd/In Pllts Form<br />
Obtnd Frm Soya-Bean Oil Extrctn<br />
4.5 831110 Coat Elctrd Of Bs Mtl Fr Elctrc Arc Wldng 3.07<br />
251110 Natural Barium Sulhpate (Barytes) 1.32 360300 Safety Fuses Detonating Fuses Percussion Or Detonating Caps;<br />
Igniters;Elec Detonatrs<br />
1.91<br />
20230 Boneless Meat Of Bovine Animals , Frozen 1.29 732690 Other Articles Of Heading 7326 1.86<br />
210111 Extrcts Essncs & Cncntrts Of C<strong>of</strong>fe 0.88 300390 Othr Medicants (Excl Headng 3002,3005,3006) For Therapeutic<br />
Prophylactic Uses<br />
1.62<br />
190110 Food Prpns Fr Infnt Use Put Up Fr Rtl Sale 0.71 300410 Medicaments Containing Pencillin/Drvtvs Thr<strong>of</strong> Wth A<br />
Pencllnc Acid Strctr/ Strptmycns Or Thr Dervtvs Put Up For Rtl<br />
Sale<br />
1.38<br />
90930 Seeds Of Cumin 0.61 980100 Project Goods 1.2<br />
283711 Cyanides & Cyanide Oxide Of Sodium 0.6 300450 Other Mdcmnts Cntng Vitamins/ Other Products Of Heading No<br />
2936 Put Up For Retail Sale<br />
40210 Milk & Cream In Pwdr,Grnls Or Othr Solid Forms Contng<br />
Fat Not Exceeding 1.5% By Wt<br />
0.51 820310 Files,Rasps & Smrl Tools 0.98<br />
21019 Othr Meat Of Swine,Sltd,In Brine,Drd/Smkd 0.49 300420 Medicaments Containing Other Antibiotics And Put Up For<br />
Retail Sale<br />
TOTAL 207.97 TOTAL 52.71<br />
Source: Government <strong>of</strong> India.<br />
1.05<br />
0.96<br />
55
HS CODE<br />
Table 4.6: Trends in Top 10 Indian Imports from Myanmar at 6-digit HS<br />
Commodity<br />
2009-10 HS CODE<br />
Commodity<br />
2000-01<br />
(US$ Million)<br />
(US$ Million)<br />
71331 Beans Of The Spp Vigna Mungo,Hepper Or Vigna<br />
500.4 440399 Other Wood In Rough 73.35<br />
Radiata,Wilczek Dried & Shld<br />
440349 Othr Tropical Wood 228.47 440349 Othr Tropical Wood 58.87<br />
71390 Othr Dried & Shld Luguminous Vegitabls 215.63 71390 Othr Dried & Shld Luguminous Vegitabls 22.72<br />
440399 Other Wood In Rough 162.03 71331 Beans Of The Spp Vigna Mungo,Hepper Or Vigna<br />
Radiata,Wilczek Dried & Shld<br />
9.19<br />
71339 Oter Beans Dried & Shld 121.53 71310 Peas (Pisum Sativum) Dried & Shld 3.37<br />
170199 Sugr Refind Nt Contng Frvrng/Colrng Matter 14.43 80290 Other Nuts Fresh Or Dried 2.59<br />
71320 Chickpeas (Garbanzos) Dried & Shld 7.37 71320 Chickpeas (Garbanzos) Dried & Shld 1.96<br />
50100 Human Hair,Unworked; Waste Of Human Hair 6.22 71333 Kidny Bens Incl Whte Pea Bens Dried & Shld 1.89<br />
71333 Kidny Bens Incl Whte Pea Bens Dried & Shld 5.92 120799 Othr Oil Seeds & Olegnus Fruits W/N Brokn 1.01<br />
441299 Othr Plywood,Vinered Panels&Lmntd Wood Panel And<br />
Laminated Wood<br />
3.26<br />
Total 1289.8 Total 181.69<br />
Source: Government <strong>of</strong> India.<br />
56
4.2 <strong>Trade</strong> between NER <strong>and</strong> Myanmar<br />
India <strong>and</strong> Myanmar share a common border <strong>of</strong> 1,643 km. Four states <strong>of</strong> the NER, namely,<br />
Arunachal Pradesh, Manipur, Mizoram, <strong>and</strong> Nagal<strong>and</strong>, shares international borders <strong>with</strong><br />
Myanmar (Table 4.7). However, a large part <strong>of</strong> this international border <strong>with</strong> Myanmar is<br />
pours, mountainous <strong>and</strong> inhabited. Till date, four LCSs are in operation, serving the trade<br />
between the two countries (Table 4.7), <strong>of</strong> which Moreh in Manipur is the busiest LCS,<br />
h<strong>and</strong>ling almost 99 per cent <strong>of</strong> the NER’s trade <strong>with</strong> Myanmar.<br />
Table 4.7: LCSs in NER Dealing <strong>Trade</strong> <strong>with</strong> Myanmar<br />
NER State LCS in India LCS in Neighbouring<br />
country<br />
Neighbouring<br />
country<br />
Arunachal Pradesh Nampong Myanmar<br />
Manipur Moreh Tamu/Namphalong Myanmar<br />
Mizoram<br />
Zokhawthar<br />
(Champai)<br />
Rangamati<br />
Myanmar<br />
Nagal<strong>and</strong> Avankhung Myanmar<br />
Source: <strong>North</strong> <strong>East</strong>ern Council (NEC)<br />
In general, the NER-Myanmar trade mainly flows through Moreh in Manipur. In the last<br />
decade, the NER’s average annual export to Myanmar was about US$ 2.36 million, whereas<br />
the average annual import from Myanmar was US$ 1.88 million. It contributed a miniscule<br />
2.08 per cent <strong>and</strong> 0.49 per cent in country’s total export to <strong>and</strong> import from Myanmar<br />
respectively in the last decade (Table 4.8). In US$ term, while Indian export <strong>and</strong> import <strong>with</strong><br />
Myanmar witnessed a massive 76 per cent <strong>and</strong> 116 per cent, respectively in last decade, the<br />
same from the NER faced consistently negative growth in the last decade. 18 Unlike the NER-<br />
Bangladesh trade, the NER’s trade <strong>with</strong> Myanmar has always remained less than a% <strong>of</strong><br />
India’s total trade <strong>with</strong> Myanmar since opening <strong>of</strong> LCS at Moreh in 1995. Therefore, border<br />
trade potential between India <strong>and</strong> Myanmar is yet to be unrealized.<br />
Table 4.8: NER’s <strong>Trade</strong> <strong>with</strong> Myanmar+<br />
Year#<br />
Indian Export<br />
to Myanmar<br />
Indian<br />
Import from<br />
Myanmar<br />
NER Export<br />
to Myanmar<br />
NER Import<br />
from<br />
Myanmar<br />
NER Share* (%)<br />
(US$ million) Export Import<br />
2000 48.05 179.18 1.23 2.75 2.56 1.53<br />
2001 53.05 197.81 0.26 1.61 0.49 0.81<br />
2002 71.53 345.64 1.03 2.43 1.44 0.70<br />
2003 86.00 390.77 2.02 1.90 2.35 0.49<br />
18 However, in Indian rupee term, NER’s export to Myanmar witnessed positive growth, but the NER’s import<br />
from Myanmar couldn’t escape negative growth rate in the last decade.
2004 104.71 400.05 1.43 1.19 1.37 0.30<br />
2005 111.32 495.95 0.88 1.18 0.79 0.24<br />
2006 132.72 718.40 13.52 0.59 10.18 0.08<br />
2007 174.02 802.79 0.75 3.26 0.43 0.41<br />
2008 212.23 893.92 1.06 1.79 0.50 0.20<br />
2009 209.78 1195.26 1.47 2.12 0.70 0.18<br />
Average** 120.34 561.98 2.36 1.88 2.08 0.49<br />
CAGR (%) 75.96 115.83 -14.51 -194.96<br />
*Share in India. **Average for the period 2000-2009. +NER export <strong>and</strong> import consider trade through Moreh<br />
only. #<strong>Trade</strong> data for India counts calendar year while the same for NER consider financial year.<br />
Sources: IMF for India’s trade <strong>with</strong> Myanmar, <strong>and</strong> Indian Customs for NER’s trade <strong>with</strong> Myanmar.<br />
4.2.1 India-Myanmar Border <strong>Trade</strong> at Moreh LCS<br />
The LCS at Moreh is situated near the India-Myanmar border on a 9.28 acres plot. It is near<br />
the Lokchao bridge which connects Indian territory <strong>with</strong> Myanmar. Moreh in Manipur is the<br />
largest LCS h<strong>and</strong>ling about US$ 3.59 million India-Myanmar merch<strong>and</strong>ise trade, <strong>of</strong> which<br />
export <strong>and</strong> import contribute 41 per cent <strong>and</strong> 59 per cent respectively. Map 4.1 plots the<br />
location <strong>of</strong> Moreh LCS. As noted in Figures 4.3(a) <strong>and</strong> 4.3(b), export through Moreh LCS<br />
increased from US$ 0.14 million (Rs. 0.46 crore) in 1995-96 to a peak <strong>of</strong> US$ 13.52 million<br />
(Rs. 61.27 crore) in 2006-07 <strong>and</strong> then reduced to US$ 1.47 million (Rs. 6.55 crore) in 2009-<br />
10. Import, on the other, witnessed relatively less fluctuations, increased from US$ 1.66<br />
million (Rs. 5.39 crore) in 1995-96 to US$ 2.12 million (Rs. 9.42 crore) in 2009-10. The<br />
interesting development is that the second half <strong>of</strong> last decade witnessed a rise in Indian export<br />
through Moreh, compared to previous two periods (Figure 4.4), whereas import declined<br />
consistently from US$ 72 billion in 1995-96/1999-2000 to US$ 38 billion in 2005-06/2009-<br />
10.<br />
Map 4.1: Location <strong>of</strong> LCS in India – Myanmar Border<br />
58
Figure 4.3 (a): Border <strong>Trade</strong> at Moreh LCS in US$<br />
16<br />
14<br />
12<br />
10<br />
US$ million<br />
8<br />
6<br />
4<br />
2<br />
0<br />
-2<br />
1995-<br />
96<br />
1996-<br />
97<br />
1997-<br />
98<br />
1998-<br />
99<br />
1999-<br />
00<br />
2000-<br />
01<br />
2001-<br />
02<br />
2002-<br />
03<br />
2003-<br />
04<br />
2004-<br />
05<br />
2005-<br />
06<br />
2006-<br />
07<br />
2007-<br />
08<br />
2008- 2009-<br />
09 10<br />
Export 0.14 8.41 6.93 1.22 0.77 1.23 0.26 1.03 2.02 1.43 0.88 13.52 0.75 1.06 1.47<br />
Import 1.66 4.56 10.24 1.50 1.55 2.75 1.61 2.43 1.90 1.19 1.18 0.59 3.26 1.79 2.12<br />
Source: Indian Customs.<br />
Figure 4.3 (b): Border <strong>Trade</strong> at Moreh LCS in INR<br />
70<br />
60<br />
50<br />
40<br />
Rs. crore<br />
30<br />
20<br />
10<br />
0<br />
-10<br />
1995-<br />
96<br />
1996-<br />
97<br />
1997-<br />
98<br />
1998-<br />
99<br />
1999-<br />
00<br />
2000-<br />
01<br />
2001-<br />
02<br />
2002-<br />
03<br />
2003-<br />
04<br />
2004-<br />
05<br />
2005-<br />
06<br />
2006-<br />
07<br />
2007-<br />
08<br />
2008-<br />
09<br />
Export 0.46 29.80 25.17 5.03 3.31 5.53 1.23 5.00 9.41 6.49 3.87 61.27 3.09 4.53 6.55<br />
Import 5.39 16.17 37.19 6.19 6.68 12.35 7.59 11.83 8.85 5.38 5.21 2.70 13.47 7.62 9.42<br />
2009-<br />
10<br />
Source: Indian Customs.<br />
59
Figure 4.4: <strong>Trade</strong> at Moreh: 5-years Aggregate<br />
90<br />
80<br />
70<br />
63.77<br />
71.62<br />
79.31<br />
US$ million<br />
60<br />
50<br />
40<br />
30<br />
27.65<br />
46.01<br />
38.42<br />
20<br />
10<br />
0<br />
1995-96/1999-2000 2000-01/2004-05 2005-06/2009-10<br />
Export<br />
Import<br />
Source: Calculated based on sources mentioned in Table 4.8.<br />
Table 4.9: Top Three <strong>Trade</strong>d Items at Moreh LCS*<br />
Year Export Item 1 Export Item 2 Export Item 3<br />
1998 Wheat flour Soya bari Flavouring essence<br />
2001 Soyabari Sumon rose powder Cumin seeds<br />
2007 Soyabari Soya grid Cumin seed<br />
2009 Soyabari<br />
Year Import Item 1 Import Item 2 Import Item 3<br />
1998<br />
2001 Betel nut Garlic Pulses<br />
2007 Betel nut Ginger Pulses<br />
2009 Ginger Betel nut Pulses<br />
*Arranged according to the volume <strong>of</strong> export/import to/from Myanmar.<br />
Source: Indian Customs.<br />
There is a lot <strong>of</strong> difference in the commodity composition <strong>of</strong> trade in the Moreh LCS.<br />
Appendix 4.2 provides a detailed list <strong>of</strong> items being traded at Moreh LCS. Important<br />
commodities being imported from Myanmar consist <strong>of</strong> betel nuts, dry ginger, pulses, whereas<br />
60
soyabari, cumin seed, soya grid <strong>and</strong> skimmed milk powder are some major exported items. 19<br />
The formal trade volume at Moreh is appeared to be less than the informal trade volume. 20<br />
With the change in dem<strong>and</strong> pattern in both sides <strong>of</strong> the border, trade at Moreh LCS is carried<br />
out more in negative list items than the positive list items. While a formal trade at Moreh<br />
shows trade in traditional primary goods, informal trade, if factored in, indicates a<br />
compositional change in border trade that has undergone between the two countries. Barter<br />
trade <strong>of</strong> 22 agreed items has lost its relevance while the normal or regular trade has gained<br />
the popularity over time. One <strong>of</strong> the primary reasons for a low level <strong>of</strong> border trade at Moreh<br />
LCS is perhaps the unfavourable trading environment. <strong>Trade</strong> at Moreh LCS suffers not only<br />
due to lack in modern trade infrastructure, both hardware <strong>and</strong> s<strong>of</strong>tware, but also absence <strong>of</strong><br />
adequate security, thus making the entire trade very unsecured. On top, the unfriendly<br />
exchange rate between India <strong>and</strong> Myanmar prohibits the formal trade to grow, resulting<br />
which government is loosing revenue. We discuss the barriers to trade at Moreh LCS in<br />
detailed in next chapter.<br />
4.2.1.2. Infrastructure at the Moreh LCS<br />
The Moreh LCS is manned by one superintendent, two inspectors, one sepoy <strong>and</strong> two<br />
contract workers. Gate no.1 which is managed by the LCS is made <strong>of</strong> wooden materials. It is<br />
<strong>of</strong>ten damaged by smugglers in the night. Unlike India-Bangladesh border fencing system the<br />
border is quite open over long stretches. Besides, Gate no.1 is used only for bringing in goods<br />
like betel nuts etc from Myanmar in bulk as part <strong>of</strong> <strong>of</strong>ficial trade. Most <strong>of</strong> the trade is<br />
conducted at Gate no. 2 informally where people <strong>of</strong> both sides cross over freely <strong>and</strong> buy<br />
goods. The LCS is located at a desolate spot <strong>with</strong>out proper fencing. <strong>Trade</strong>rs sometimes keep<br />
their goods in its own warehouse till it is cleared by the food testing laboratory at Guwahati.<br />
This generally takes one month. Table 4.10 presents the status <strong>of</strong> the facilities available at<br />
Moreh LCS.<br />
Electronic Data Interchange (EDI) was introduced in 2009 but is yet to be functional. <strong>Trade</strong><br />
happens only in day time <strong>and</strong> there is no agreement between India <strong>and</strong> Myanmar to have<br />
trade day <strong>and</strong> night probably due to the uncertain law <strong>and</strong> order condition. Even the streets in<br />
the township become deserted by 6 pm everyday. The working time at the LCS is from 10 am<br />
to 4 pm. The LCS is yet to be e-enabled. Loading <strong>and</strong> unloading <strong>of</strong> goods are done by casual<br />
labourers. The main problem is to get the fitness for human consumption certificate from<br />
Guwahati for items like betel nuts <strong>and</strong> dry ginger. It may even take a month. There is no food<br />
testing laboratory in the border <strong>and</strong> no animal quarantines are also there. The place used as<br />
the warehouse for such goods in waiting is actually a rest room for drivers. The facilities are<br />
not properly maintained due to the fact that an Integrated Check Post (ICP) is being<br />
established near the LCS. The l<strong>and</strong> for the ICP has been cleared <strong>and</strong> the l<strong>and</strong>owners have<br />
been given compensation. It is being guarded by the Assam Rifles. However construction is<br />
yet to begin.<br />
19 In terms <strong>of</strong> value also the trade at the LCS is a miniscule <strong>of</strong> the estimated value <strong>of</strong> informal trade occurring at<br />
Gate No. 2 connecting Moreh to Namphalong in Myanmar, which we found during the field survey at Moreh.<br />
20 The total volume <strong>of</strong> trade at Moreh is certainly more than <strong>of</strong>ficial trade <strong>of</strong> Rs. 15 crore. A quick estimate<br />
shows total trade including informal volume is about Rs. 280 crore (Singh, 2011). This does not include the<br />
cl<strong>and</strong>estine trade in drugs <strong>and</strong> small arms whose value also would be substantive.<br />
61
Table 4.10: Facilities at the LCS<br />
Facility Available (Y) Not Available (N)<br />
Food testing laboratory<br />
N<br />
Availability <strong>of</strong> electricity<br />
Telephone<br />
Y<br />
Y<br />
Internet<br />
N<br />
EDI (Icegate)<br />
N<br />
Weighbridge Y* N<br />
Warehouse<br />
Cold storage<br />
Parking place<br />
Transhipment platform / Transit sheds<br />
Secretarial assistance (fax, photocopy, etc.)<br />
Drinking water<br />
Drivers’ rest room<br />
Health centre<br />
Hotels <strong>and</strong> restaurants<br />
Separate entry <strong>and</strong> exit gates<br />
Banks<br />
Courier / Post Office<br />
Servicing centre / Vehicle repair shops<br />
*Not in working condition at the time <strong>of</strong> survey.<br />
Source: Field Survey.<br />
Y<br />
Y<br />
N<br />
N<br />
N<br />
N<br />
N<br />
N<br />
N<br />
N<br />
N<br />
N<br />
N<br />
There is practically no problem <strong>of</strong> congestion as the volume <strong>of</strong> consignments has been<br />
decreasing. Transaction cost in this LCS also includes the un<strong>of</strong>ficial payments traders have to<br />
make all along the route to various organizations including our own security personnel. “Tax”<br />
on goods is highly variable depending upon your skills in negotiation. However, vehicles<br />
plying in this route have to pay a fixed amount every year. For instance, a van owner spends<br />
annually around Rs 40,000 for such expenses. Because <strong>of</strong> the low volume <strong>of</strong> trade waiting<br />
time at the LCS for export is not much. Due to disagreement between vehicle operators <strong>and</strong><br />
the insurgent groups on the annual payment the road is closed several times in a year.<br />
Besides, this any agitation in the districts through which National Highway 39 passes, will<br />
invariably block this highway to put pressure on the authority.<br />
The volume <strong>of</strong> trade would have been substantially higher, were it not for the long time taken<br />
to get a human consumption fitness certificate from Guwahati, the highly overvalued<br />
exchange rate <strong>of</strong> kyat, the absence <strong>of</strong> warehouse in the LCS. On the other h<strong>and</strong>, the market at<br />
Namphalong (Myanmar) across Gate no. 2 sells all sorts <strong>of</strong> goods supplying the chain <strong>of</strong><br />
markets in Manipur specializing in foreign goods. Shoes, blankets, jeans, jackets, electronic<br />
items, steel products, fish, decorative pieces, crockery, cosmetics, mosquito nets etc are<br />
available in this market. All the products which make Moreh such a popular destination for<br />
shoppers in the NER originate in this market. Another distinctive characteristic <strong>of</strong> this market<br />
is its ability to redefine market dem<strong>and</strong> <strong>and</strong> respond to changes. The trade centre set up in<br />
62
Moreh is also not properly used. 21 Another trade centre has been taken over by Kuki<br />
refugees. The Kukis are the dominant tribal group in Moreh.<br />
4.3 Concluding Remarks<br />
With the adoption <strong>of</strong> Look <strong>East</strong> Policy (LEP) in the early 1990s, economic engagement<br />
between India <strong>and</strong> Myanmar has been steadily growing. This is particularly significant for<br />
India as Myanmar is the l<strong>and</strong>-bridge that connects India to the dynamic economies <strong>of</strong> <strong>East</strong><br />
<strong>and</strong> South-<strong>East</strong> Asia. With India entering into economic partnership agreements <strong>with</strong> almost<br />
all countries in this region, Myanmar has assumed added importance.<br />
The change in India’s policy towards Myanmar has paid rich dividends. Official trade<br />
between the two countries increased steadily over the past decade, despite the fact that the<br />
Border <strong>Trade</strong> Agreement <strong>of</strong> 1994 had put a cap on the number <strong>of</strong> items that could be traded<br />
through the local trade points. Myanmar has benefited from the two-way trade, as is<br />
evidenced by the large trade surplus that it has enjoyed. The NER has not benefited much<br />
from India-Myanmar trade - unlike NER-Bangladesh trade, the NER’s trade <strong>with</strong> Myanmar<br />
has remained less than a% <strong>of</strong> India’s total trade <strong>with</strong> Myanmar.<br />
Border trade between the two countries has not progressed further since opening <strong>of</strong> Moreh<br />
LCS in 1995. India <strong>and</strong> Myanmar agreed to allow border trade in 22 commodities in the 1994<br />
Agreement, which was exp<strong>and</strong>ed to 40 items in 2008, but this seems to have lost its relevance<br />
particularly since informal/illegal trade has proliferated. The low level <strong>of</strong> border trade at<br />
Moreh LCS can perhaps be attributed to the unfavourable trading environment <strong>and</strong> the lack <strong>of</strong><br />
essential infrastructure <strong>and</strong> other facilities. These barriers to border trade at Moreh LCS will<br />
be discussed in detail in the next chapter <strong>and</strong> a strategy to overcome the low-level trap that<br />
India-Myanmar trade has fallen into will also be suggested.<br />
Export To<br />
Appendix 4.1: Myanmar’s Top 10 <strong>Trade</strong> Partners<br />
Volume<br />
Share*<br />
(US$ BILLION) (%)<br />
Thail<strong>and</strong> 2.549 43.084<br />
India 1.087 18.366<br />
China,P.R.: Mainl<strong>and</strong> 0.587 9.919<br />
Japan 0.309 5.231<br />
Malaysia 0.131 2.219<br />
Singapore 0.107 1.802<br />
Germany 0.073 1.234<br />
South Korea 0.071 1.204<br />
Bangladesh 0.062 1.052<br />
Vietnam 0.059 0.998<br />
Import From Volume Share**<br />
21 The shop owners who were there during our visit told us that they had come specially for the visiting Planning<br />
Commission members <strong>and</strong> during the last 10 odd years not much business transactions had happened there.<br />
63
(US$ billion) (%)<br />
China, P.R.: Mainl<strong>and</strong> 2.507 35.396<br />
Thail<strong>and</strong> 1.694 23.911<br />
Singapore 0.979 13.819<br />
South Korea 0.447 6.308<br />
Malaysia 0.233 3.283<br />
India 0.231 3.258<br />
Japan 0.222 3.135<br />
Indonesia 0.192 2.714<br />
Germany 0.058 0.823<br />
<strong>North</strong> Korea 0.052 0.740<br />
Australia 0.051 0.726<br />
Notes: * Share in total exports. **Share in total imports.<br />
Source: IMF.<br />
64
Chapter 5<br />
Field Survey Results<br />
This chapter presents the results <strong>of</strong> the primary surveys conducted at the L<strong>and</strong> Customs<br />
Stations (LCSs) situated on India’s border <strong>with</strong> Bangladesh <strong>and</strong> Myanmar. The surveys were<br />
conducted among the traders engaged in border trade on the Indian side <strong>of</strong> the border. The<br />
findings <strong>of</strong> the primary survey will help us understating the nature <strong>of</strong> constraints that are<br />
acting as the barriers to trade between the NER <strong>and</strong> Bangladesh, <strong>and</strong> the NER <strong>and</strong> Myanmar.<br />
It will also help us in undertaking appropriate action to help facilitate the trade in the region.<br />
5.1 The Survey<br />
This field survey was conducted through a structured questionnaire developed by RIS in<br />
consultation <strong>with</strong> local partners. The survey was done by the research scholars <strong>of</strong> the<br />
National Institute <strong>of</strong> Technology (NIT) Silchar <strong>and</strong> Manipur University. Before the field<br />
survey, the proper training was also given to the surveyors.<br />
Table 5.1 L<strong>and</strong> Customs Stations Covered by the Survey<br />
State<br />
LCS<br />
Assam 1. Sutarkh<strong>and</strong>i<br />
2. Karimganj Steamer Ghat /<br />
Karimganj Ferry Station (KSFS)<br />
3. Mankachar<br />
Meghalaya 1. Borsora<br />
2. Dawki<br />
3. Dalu<br />
4. Baghmara<br />
Manipur 1. Moreh<br />
Tripura<br />
1. Agartala<br />
We have covered nine L<strong>and</strong> Customs Stations (LCS) in this study <strong>with</strong> a break-up <strong>of</strong> three in<br />
Assam, four in Meghalaya, <strong>and</strong> one each from Manipur <strong>and</strong> Tripura. Table 5.1 presents the<br />
list <strong>of</strong> LCSs surveyed in this study. Appendix 5.1 provides the questionnaire that was used in<br />
the field survey. Selection <strong>of</strong> LCSs was done based on the trends in trade volume <strong>and</strong> trade<br />
composition. Apparently, these 9 LCSs jointly cover more than 90 per cent <strong>of</strong> the NER’s<br />
annual trade <strong>with</strong> Bangladesh <strong>and</strong> Myanmar in recent years. 22 Survey was done among 64<br />
respondents, thereby making 7 respondents on average per LCS. Due to lack <strong>of</strong> trade <strong>and</strong>/or<br />
inaccessibility, we could not cover remaining LCSs in the NER.<br />
While information on both trade <strong>and</strong> investment was collected through the survey, we report<br />
only the responses on trade here. Since responses on investment were not sufficient, we are,<br />
therefore, constrained not to report the survey findings on investment. As may be seen from<br />
22 See the discussion in previous chapters.<br />
65
the Annexure 5.1, we have emphasized more to find infrastructure barriers that prohibiting<br />
trade <strong>and</strong> investment to grow between the NER <strong>and</strong> Bangladesh <strong>and</strong> the NER <strong>and</strong> Myanmar.<br />
For the sake <strong>of</strong> simplicity, we present here only those findings supplementing the previous<br />
discussion. In this chapter, we provide aggregate information. However, surveyed<br />
information on specific LCS will be provided to the interested reader(s) <strong>with</strong> much greater<br />
details on request. 23<br />
5.2 Basic Pr<strong>of</strong>ile <strong>of</strong> LCSs<br />
Table 5.1 presents the basic pr<strong>of</strong>ile <strong>of</strong> nine LCSs which were surveyed in this study.<br />
<br />
<br />
<br />
<br />
Among the nine LCSs surveyed, Agartala is closest LCS to the state capital, whereas<br />
Baghmara <strong>and</strong> Dalu in Meghalaya are located over 400 km. away from state capital. The<br />
LCS is located only 3 km away from the state capital.<br />
There are also wide variations in topography. Agartala is the most advantageous in terms<br />
<strong>of</strong> communication. It is easily accessible from the state capital. Agartala’s internal <strong>and</strong><br />
external communication links are relatively superior, compared to other LCSs in the<br />
NER.<br />
Due to locational advantages, administering Agartala LCS is relatively favourable <strong>and</strong><br />
also easier than other LCSs in the NER. Working hours in most <strong>of</strong> the LCSs are 10.00 –<br />
16.00 hrs everyday.<br />
<strong>Trade</strong> routes between the NER <strong>and</strong> bordering countries are overl<strong>and</strong> except KSFS in<br />
Assam which shares river border <strong>with</strong> Zakiganj located in neighbouring Bangladesh.<br />
LCS State Bordering<br />
Country<br />
Table 5.2 Basic Pr<strong>of</strong>ile <strong>of</strong> LCSs<br />
LCS in<br />
Bordering<br />
Country<br />
Dawki Meghalaya Bangladesh Tamabil Dawki-<br />
Tamabil<br />
Bagmara Meghalaya Bangladesh Bijoypur Bagmara-<br />
Bijoypur<br />
Borsara Meghalaya Bangladesh Borsara Borsara-<br />
Borsara<br />
Dalu Meghalaya Bangladesh Nakugaon Mankachar-<br />
Nakugaon<br />
Mankachar Assam Bangladesh Rowmari Mankachar-<br />
Rowmari<br />
Sutarkh<strong>and</strong>i Assam Bangladesh Sheola Sutark<strong>and</strong>i-<br />
Sheola<br />
<strong>Trade</strong> Route Working Hours Distance from State<br />
Capital (km)*<br />
10 am to 5 pm 82<br />
10 am to 4 pm 480<br />
10 am to 4 pm 182<br />
10 am to 4 pm 430<br />
10 am to 4 pm 274<br />
6 am to 6 pm 338<br />
KSFS Assam Bangladesh Zakiganj River Kushiara 6 am to 6 pm 324<br />
Agartala Tripura Bangladesh Akhaura Agartala - 9 am to 6 pm 3<br />
Akhaura<br />
Moreh Manipur Myanmar Tamu Moreh – Tamu 9 am to 5 pm 110<br />
*By road.<br />
23 For this matter, please contact the coordinator <strong>of</strong> this study at the <strong>North</strong>eastern Economic Council<br />
(NEC), Shillong.<br />
66
5.3 <strong>Trade</strong>d Goods at LCSs<br />
Table 5.3 presents goods traded at LCSs in the NER. The list presents goods traded both<br />
formally <strong>and</strong> informally. 24 India’s border trade <strong>with</strong> Bangladesh <strong>and</strong> Myanmar have unique<br />
characteristics which are enumerated below.<br />
India-Bangladesh Border <strong>Trade</strong><br />
<br />
<br />
The LCSs in Meghalaya h<strong>and</strong>le export <strong>of</strong> minerals to Bangladesh, <strong>of</strong> which coal <strong>and</strong><br />
limestone are major export items. Dalu <strong>and</strong> Dawki LCSs also h<strong>and</strong>le import cargoes such<br />
as food items, cement etc. coming from Bangladesh.<br />
Unlike Meghalaya, LCSs in Assam h<strong>and</strong>le both export <strong>and</strong> import to <strong>and</strong> from<br />
Bangladesh, showing wide trade varieties. Among 3 LCSs we surveyed in Assam,<br />
Sutark<strong>and</strong>i is the largest LCS. It h<strong>and</strong>les minerals, processed foods <strong>and</strong> agriculture goods,<br />
showing relatively higher trade complementarities.<br />
Table 5.3 LCS-wise <strong>Trade</strong>d Goods in 2010<br />
LCS State Border <strong>with</strong> Goods Exported Goods Imported<br />
Dawki Meghalaya Bangladesh Coal<br />
Limestone/ Quicklime<br />
Quartz stone<br />
Boulders<br />
Oranges<br />
Raw hide<br />
Bagmara Meghalaya Bangladesh Coal<br />
Borsara Meghalaya Bangladesh Coal<br />
Food items<br />
Fireclay bricks<br />
Dalu Meghalaya Bangladesh Coal Cement<br />
Pan product<br />
Mankachar Assam Bangladesh Coal<br />
Limestone<br />
Sutarkh<strong>and</strong>i Assam Bangladesh Coal<br />
Lime<br />
Frutis, incl orange<br />
Cotton<br />
Vegetable<br />
Furniture<br />
RHGS<br />
Ginger<br />
Onion<br />
Citrus fruits<br />
Vegetables<br />
Lime<br />
Fresh fruits<br />
Machineries<br />
Orange<br />
Lime<br />
Dry chilli<br />
Turmeric<br />
Hilsa fish<br />
Green chilli<br />
Books<br />
Religious books<br />
Melamine<br />
Food products<br />
S<strong>of</strong>t drinks<br />
Orange<br />
Mosquito net<br />
Citrus fruits<br />
Furniture<br />
Glass<br />
Plastic furniture<br />
Sarees<br />
Synthetic fruit drinks<br />
Cont…<br />
24 The usual disclaimer is this may not necessarily match <strong>with</strong> the <strong>of</strong>ficially published record.<br />
67
LCS State Border <strong>with</strong> Goods Exported Goods Imported<br />
KSFS Assam Bangladesh Bamboo<br />
Soya food<br />
RHGS<br />
Cotton<br />
Radish<br />
Umbrella<br />
Coal<br />
Fruits / Citrus fruits<br />
Dry chilli<br />
Orange<br />
Rice<br />
Poultry feed<br />
Agartala Tripura Bangladesh Raw hides<br />
Beverage<br />
Broken<br />
Stone<br />
Dry fish<br />
Ginger<br />
Plastic articles<br />
Playing cards<br />
Potato<br />
Skin<br />
Textile<br />
Wall clock<br />
Aromatic water<br />
Bakery products<br />
Beverage<br />
Cement<br />
Cotton<br />
Cracker<br />
Dry fish<br />
Furniture<br />
Food items<br />
Fried vegetables<br />
Fruit (mango & orange)<br />
Drinks<br />
Furniture<br />
Glass sheets,<br />
Hilsa fish<br />
Juice product<br />
Maggi cup<br />
Manufactured goods<br />
Mosquito net<br />
Nuts<br />
Orange juice<br />
Potato<br />
“Pran” products<br />
RHGS<br />
Shampoo<br />
Soap<br />
Synthetic food tem<br />
Synthetic fruit drinks<br />
Tissue paper<br />
Vanaspati<br />
Vegetable,<br />
Wafer<br />
Washing powder<br />
Animal feed<br />
Beverage<br />
Broken or crushed stone<br />
Cement<br />
Ceramic tiles<br />
Cosmetics & toilet products<br />
Cotton waste<br />
Dry fish<br />
Edible oil<br />
Fish<br />
Food items<br />
Furniture<br />
Jute rope<br />
Molasses<br />
Plastic articles<br />
Resins<br />
Textile goods<br />
Cont…<br />
68
LCS State Border <strong>with</strong> Goods Exported Goods Imported<br />
Moreh Manipur Myanmar Fertiliser<br />
Sugar<br />
Life saving drugs<br />
Agarbati<br />
Bicycle spares<br />
Leather products<br />
X –ray <strong>and</strong> photo paper<br />
Paints & varnish Cotton<br />
fabrics<br />
H<strong>and</strong>loom textiles<br />
Stainless steel<br />
Blades<br />
Salt<br />
Cosmetics<br />
Spices<br />
Menthol<br />
Bicycle<br />
Motor cycle<br />
Redwood<br />
Mosquito coil<br />
Soyabari<br />
Electric coil<br />
Bitumen<br />
Wheat flour Machinery<br />
Steel<br />
Bleaching powder<br />
Precious stones<br />
Dry ginger<br />
Reed broom<br />
Pulses<br />
Resin<br />
Betel nut<br />
Bean<br />
Rice<br />
Turmeric<br />
Timber<br />
Sunflower<br />
Red Kidney Bean<br />
Teakwood<br />
Rapeseed<br />
Fresh vegetables<br />
Fruits<br />
Tobacco<br />
Sesame<br />
Soyabean<br />
Katha<br />
Pearls<br />
Kuth root<br />
Onion<br />
Spice<br />
Garlic<br />
Chilly<br />
Coconut<br />
Mosquito coils<br />
Gram<br />
Electric equipment<br />
Garments<br />
Furniture<br />
C<strong>and</strong>le<br />
Electronic equipments<br />
Blanket<br />
Imitation jewellery<br />
Petrol<br />
Fish<br />
<br />
<strong>Trade</strong> at Agartala is one-sided; import is more than export. Import from Bangladesh<br />
through Agartala varies from agriculture <strong>and</strong> food items to cement <strong>and</strong> plastic to textile<br />
<strong>and</strong> clothing. The trade at Agartala LCS is growing heavily due mainly to growing local<br />
dem<strong>and</strong> in both side <strong>of</strong> the border.<br />
69
India-Myanmar Border <strong>Trade</strong> at Moreh<br />
<br />
<br />
<br />
<br />
Unlike Assam, Tripura <strong>and</strong> Meghalaya, border trade at Moreh is in the nature <strong>of</strong> transit<br />
trade. Moreh LCS h<strong>and</strong>les both export <strong>and</strong> import cargoes. However, the volume <strong>of</strong> trade<br />
h<strong>and</strong>led by the LCS is miniscule as compared to the informal/illegal trade that takes place<br />
through the local trade point, better known as “Gate No. 2”. The latter has no customs<br />
<strong>of</strong>ficials; only a few security personnel were found to be manning the gates. The survey<br />
team found that the “no man’s l<strong>and</strong>” was only a narrow strip between the two gates,<br />
which was also being used by the traders (chairs were laid out <strong>and</strong> were obviously being<br />
used).<br />
<strong>Trade</strong> taking place through “Gate No. 2” includes the items indicated in the above table.<br />
Imports consist <strong>of</strong> precious stones, agricultural commodities including beans, vegetables<br />
<strong>and</strong> fruits, besides electronic equipment. Quite clearly, the goods that are traded through<br />
the informal/illegal channels are well beyond the 40 items that have been included in the<br />
Border <strong>Trade</strong> agreement between India <strong>and</strong> Myanmar. Most <strong>of</strong> the products coming<br />
through Moreh are not <strong>of</strong> Burmese origin - they are produced in China <strong>and</strong> elsewhere.<br />
<strong>Trade</strong> through “Gate No. 2” is heavily skewed against India. <strong>Trade</strong>rs on the Indian side <strong>of</strong><br />
the border report that the infrastructure facilities are well developed on the other side <strong>of</strong><br />
the border at Namphalong (Tamu). About 700-800 well stocked shops form the basis for<br />
imports from Myanmar. The situation across the border in Moreh is in sharp contrast –<br />
there are less than 100 shops. There is clearly no momentum in India’s exports to<br />
Myanmar. <strong>Trade</strong>rs informed the survey team that there is a market for Indian products in<br />
Myanmar, some <strong>of</strong> which are currently being supplied at sub-optimal levels. The survey<br />
team saw evidence <strong>of</strong> the dem<strong>and</strong> for Indian products during a brief trip to Namphalong,<br />
the shopping district closest to the border near Tamu. Products include tea, confectionery<br />
products, cosmetics, tyres utensils, fruit juices <strong>and</strong> processed food products. The team<br />
also found that the Indian products are in serious competition <strong>with</strong> the Chinese products<br />
on the display shelf. However, trade expansion from India has <strong>of</strong>ten suffered because <strong>of</strong><br />
supply-side bottlenecks, not the least because <strong>of</strong> the frequent blockades <strong>and</strong> b<strong>and</strong>hs in<br />
Manipur. What seems to be a particular problem is that <strong>of</strong>ten the target <strong>of</strong> these<br />
blockages/b<strong>and</strong>hs is NH 39, the life-line for Moreh’s connectivity <strong>with</strong> India.<br />
<strong>Trade</strong> through the latter channel takes place through head-loads. Consequently, there are<br />
no <strong>of</strong>ficial accounts kept on the volume/value <strong>of</strong> trade coming through “Gate No. 2”.<br />
<strong>Trade</strong> seems to be flourishing since there are no explicit checks at the border by the<br />
governments on either side. The magnitude <strong>of</strong> trade taking place in phenomenal. <strong>Trade</strong>rs<br />
informed the survey team that the daily imports are anything between Rs. 3-4 crore. As is<br />
usually the case, any estimate <strong>of</strong> this kind are likely to be underestimates <strong>of</strong> the actual<br />
level <strong>of</strong> trade taking place. This is borne out from the evidence presented by earlier<br />
studies which have estimated that the value <strong>of</strong> informal border trade transacted through<br />
Moreh is estimated at about Rs. 2000 crore a year 25 . Thus, even if the number provided<br />
by the traders is considered, annual trade taking place through “Gate No. 2” is between<br />
Rs. 1100 <strong>and</strong> Rs 1450 crore. And, this trade balance is hugely against India given the<br />
25 Government <strong>of</strong> Manipur (2009), “Draft Manipur State Development Report”, Planning Department,<br />
Chapter XI, p. 164.<br />
70
large quantities <strong>of</strong> Chinese (<strong>and</strong> some Thai) products being imported. These estimates<br />
should be compared <strong>with</strong> the <strong>of</strong>ficial figures to underst<strong>and</strong> the significance <strong>of</strong><br />
informal/illegal trade taking place through Moreh. Officially, the two-way trade between<br />
India <strong>and</strong> Myanmar was 2009-10 were about Rs. 7000 crore, <strong>of</strong> which India’s imports<br />
from Myanmar were about Rs. 6100 crores. More importantly, imports to India through<br />
the LCS in Moreh were a mere Rs. 16 crore during the same period. The numbers for<br />
informal/illegal trade clearly suggest that these trade <strong>and</strong> related activities are sustaining<br />
the economy <strong>of</strong> the region.<br />
Barter trade is a common practice among traders engaged in informal/illegal trade. Where<br />
currency is used, the mode <strong>of</strong> payment is Indian rupees. This is to be expected since there<br />
is no <strong>of</strong>ficial exchange rate between the rupee <strong>and</strong> the kyat, <strong>and</strong> India has the stronger<br />
currency. It would appear that the exchange rate parity is another factor that is proving to<br />
be an impediment to legal trade through the LCS. Based on the prevailing dollar<br />
exchange rate, the cross-rate between the rupee <strong>and</strong> the kyat gives the following figure: 1<br />
Re = 0.14 kyat. In the informal currency market, traders mutually decide on the exchange<br />
rate on a daily basis. The survey team found that the informal Re/kyat exchange rate can<br />
vary: 1 Re = 25-30 kyat. In other words, the cross-rate can be as high as 210 times the<br />
informal exchange rate.<br />
United Bank <strong>of</strong> India (UBI) <strong>and</strong> the Myanmar Economic Bank have entered into MoUs<br />
for opening LCs. At present, settlement can be made in two currencies, viz. Singapore<br />
dollars <strong>and</strong> Euros. UBI has set up a branch not far from the LCS at Moreh. The survey<br />
team found that not even one LC has been opened so far. The traders seemed to be<br />
unaware <strong>of</strong> how the LCs could be used. However, given the vexatious problem relating to<br />
the <strong>of</strong>ficial exchange rate between the rupee <strong>and</strong> the kyat, the lack <strong>of</strong> interest in the LCs<br />
st<strong>and</strong>s is not entirely unexpected. There is, therefore, less <strong>and</strong> less incentives for formal<br />
trade at Moreh.<br />
One <strong>of</strong> the anomalies that have come to notice is that the UBI branch at Moreh is acting<br />
as a deposit branch. There have been reports <strong>of</strong> huge deposits being made every day<br />
(sometimes up to Rs. 1 crore) <strong>and</strong> these deposits are transmitted electronically to Delhi<br />
<strong>and</strong> Mumbai. This phenomenon strikes as abnormal given the fact that it is the<br />
Myanmarese traders who should be holding on to the Indian rupees given the substantial<br />
trade surplus that they enjoy. The cash deposits taking place in the UBI are therefore a<br />
puzzle that needs to be understood. Further, investigation needs to be conducted as to<br />
whether it is the Indian traders that have established extensive links <strong>with</strong> their Chinese<br />
<strong>and</strong> Thai counter parts <strong>and</strong> it is these traders who are mainly responsible for the imports<br />
that are taking place through “Gate No. 2”.<br />
The traders pointed out that the security personnel <strong>and</strong> the insurgent groups played an<br />
overriding role in undermining their activities. The two forces were <strong>of</strong>ten working in sync<br />
<strong>and</strong> the extortion money that they had to pay was very large as a result. <strong>Trade</strong>rs pointed<br />
out that the Assam Riles <strong>and</strong> the 57 Mountain Division had set up seven check points<br />
between Moreh <strong>and</strong> Imphal on NH 39 <strong>and</strong> their consignments are checked at each <strong>of</strong><br />
these checkpoints <strong>and</strong> extortion money is recovered. Besides cash losses, the traders<br />
complained <strong>of</strong> inordinate delays in getting past these checkpoints – in some instances the<br />
delays caused may even exceed a day.<br />
71
5.4 Infrastructure at LCSs<br />
Infrastructure status at LCSs is presented in Table 5.4. We consider only those infrastructure<br />
facilities which are “on border”. Following observations are worth noting:<br />
<br />
<br />
<br />
<br />
<br />
<br />
<br />
Except Borsara in Meghalaya, electricity is available in the rest <strong>of</strong> LCSs. However, the<br />
quality <strong>of</strong> electricity varies across LCSs. Most <strong>of</strong> the LCSs face frequent power-cut all<br />
through the day.<br />
Telephone facility (l<strong>and</strong>line) is also not available in many LCSs. Except Dawki, none <strong>of</strong><br />
the LCSs in Meghalaya is having telephone facility. Internet is also not available, except<br />
perhaps Agartala.<br />
Absence <strong>of</strong> good quality electricity de-motivated Customs to use EDI facility. Virtually,<br />
EDI facility is completely missing in LCSs in the NER. Therefore, trade is being h<strong>and</strong>led<br />
manually.<br />
Facilities like weighbridge, warehouse, cold storage, etc. which are essential for trade are<br />
not available except Sutark<strong>and</strong>i in Assam <strong>and</strong> Agartala in Tripura (only weighbridge).<br />
There are wide gaps in availability <strong>of</strong> supporting facilities health centre, rest room, hotels<br />
<strong>and</strong> restaurants, etc. across LCSs. For KSFS, LCS is having drivers rest room, others do<br />
not have. Agartala LCS has health centre, whereas other LCSs do not have. Hotels <strong>and</strong><br />
restaurants are not available.<br />
Except KSFS, none is having separate entry <strong>and</strong> exit gates for export <strong>and</strong> import <strong>of</strong><br />
goods.<br />
Availability <strong>of</strong> banks <strong>and</strong> testing laboratories are necessary for trade at border. While<br />
banks are available at some LCSs such as Moreh, KSFS, Sutark<strong>and</strong>i, <strong>and</strong> Dawki, but none<br />
is having food testing laboratory at border.<br />
72
Table 5.4 Availability <strong>of</strong> Infrastructure at LCSs<br />
Facilities/ LCS Dawki Bagmara Borsara Dalu Mankachar Sutarkh<strong>and</strong>i KSFS Agartala Moreh<br />
Electricity Yes Yes No Yes Yes Yes Yes Yes Yes<br />
Telephone Yes No No No No Yes Yes Yes Yes<br />
Internet No No No No No No No Yes No<br />
EDI No No No No No No No No No<br />
Weighbridge No No No No No Yes No Yes No<br />
Warehouse No Yes No No No Yes No No No<br />
Cold Storage No No No No No Yes No No No<br />
Parking Place No No No No No Yes Yes No Yes<br />
Transhipment platform/ transit<br />
sheds<br />
No No No No No Yes Yes No No<br />
Dumping Sheds No No No Yes No No Yes No No<br />
Secretarial assistance No No No No No Yes Yes No No<br />
Drinking Water Yes Yes Yes Yes Yes Yes Yes Yes Yes<br />
Drivers' rest room No No No No No No Yes No No<br />
Passengers rest room Yes No No No No No No Yes No<br />
Health centre No No No No No No No Yes No<br />
Hotels <strong>and</strong> restaurants No No No No No No No No No<br />
Separate entry <strong>and</strong> exit gates No No No No No No Yes No No<br />
Banks Yes No No No No Yes Yes No Yes<br />
Courier/ Post <strong>of</strong>fice No No No No No Yes Yes Yes No<br />
Servicing centre/ Vehicle<br />
repair shops<br />
No No No No No Yes Yes No No<br />
Food testing laboratory No No No No No No No No No
Table 5.5 Major Deficits at LCSs: Views <strong>of</strong> Respondents<br />
LCS<br />
Dawki<br />
Bagmara<br />
Borsara<br />
Dalu<br />
Mankachar<br />
KSFS<br />
Improvement/ provision <strong>of</strong> facilities<br />
Better road connectivity<br />
Provision <strong>of</strong> vehicle scanner<br />
Financial facilities<br />
Road improvement<br />
Provision <strong>of</strong> basic infrastructure<br />
Road condition should be improved<br />
Road connectivity <strong>with</strong> Nangol <strong>and</strong> other coal mine places should be<br />
improved Warehouse facilities should be provided<br />
Bridge between Mankachar <strong>and</strong> Rowmari<br />
Improvement <strong>of</strong> road<br />
Establishing building departmental <strong>of</strong>fice complex<br />
Need warehouse<br />
Weighbridge is required<br />
Dumping ground facility is needed<br />
Acquiring wasted l<strong>and</strong> on the banks <strong>of</strong> river Kushiara for establishing<br />
warehouse dumping sheds which has been under unauthorised possession.<br />
Agartala<br />
Moreh<br />
Vehicle scanner is required<br />
Health <strong>of</strong>fice/ quarantine is needed<br />
Electric generator is required<br />
Door frame detector is needed<br />
Infrastructure inadequate<br />
Animal / plant quarantine facilities not available<br />
Weighbridge non-functional<br />
<br />
The respondents have suggested improvement <strong>of</strong> facilities at LCSs which are mostly<br />
related to improvement <strong>of</strong> infrastructure (Table 5.5). Requirement <strong>of</strong> Agaratala LCS is<br />
basically related to security at border, whereas some LCSs need improvement <strong>of</strong> “behind<br />
the border” infrastructure such as improvement <strong>of</strong> connecting road (Dawki, Bagmara,<br />
Borsara, Dalu).
Table 5.6 Problems <strong>with</strong> Security, Banking <strong>and</strong> St<strong>and</strong>ard / Testing Organisations:<br />
Respondents Opinion<br />
LCS<br />
Problem <strong>with</strong> border<br />
security agencies<br />
Problems <strong>with</strong><br />
St<strong>and</strong>ard or testing<br />
Problems <strong>with</strong> bank<br />
Dawki None reported None reported None reported<br />
Bagmara BSF asks for money None reported None reported<br />
Borsara<br />
Sometimes , not<br />
specified<br />
None reported<br />
Problems present but not<br />
specified<br />
Dalu None reported None reported Problems present but not<br />
specified<br />
Mankachar<br />
BSF asks for money <strong>and</strong><br />
also lack <strong>of</strong> knowledge<br />
on the part <strong>of</strong> BSF<br />
None reported<br />
Takes a lot <strong>of</strong> time<br />
Sutarkh<strong>and</strong>i BSF asks for money Testing lab is situated<br />
far away from the<br />
LCS. So it takes time<br />
a lot <strong>of</strong> time<br />
Not reported<br />
KSFS BSF asks for money Lab is far away from<br />
the LCS<br />
Agartala<br />
Security agencies on<br />
both sides <strong>of</strong> the border<br />
dem<strong>and</strong> bribe for<br />
smooth movement <strong>of</strong><br />
goods.<br />
Testing is a big<br />
problem as the results<br />
take lot <strong>of</strong> time<br />
Not reported<br />
Inefficient leading to<br />
delays in payment<br />
Moreh Assam Rifles <strong>and</strong> 57<br />
Mountain Division seek<br />
extortion money<br />
No testing laboratory<br />
Bank exists but the<br />
trade-related operations<br />
are non-functional<br />
<br />
Respondents have suggested improvement security <strong>and</strong> banking relations at LCSs (Table<br />
5.6). Testing laboratory is very important as it helps remove NTBs. Unfortunately, none<br />
<strong>of</strong> the LCSs is having testing laboratory at border resulting in delay <strong>and</strong> corrupt practices.<br />
5.5 Transaction Costs<br />
Due to absence <strong>of</strong> good quality infrastructure, transaction costs at LCSs are very high, <strong>and</strong><br />
also showing variations. 26 It considers loading / unloading fees at border, parking fees at<br />
border, speed money, <strong>and</strong> clearing agent’s fees.<br />
26 These are provisional estimations.<br />
75
Figure 5.1: Transaction Costs at LCSs: 2010<br />
Total Transaction cost per truck<br />
3000<br />
2500<br />
2000<br />
1500<br />
1000<br />
500<br />
0<br />
Bagmara<br />
Borsara<br />
Dalu<br />
Mankachar<br />
Sutarkh<strong>and</strong>i<br />
KSFS<br />
Agartala<br />
Figure 5.1 presents the estimated transaction costs for selected LCSs. Transaction cost at<br />
Agartala LCS is about Rs. 500 per truck whereas it is about Rs. 2500 in Dalu LCS.<br />
Mankachar, Sutark<strong>and</strong>i <strong>and</strong> Borsara come next. Unlike Petrapole LCS in West Bengal,<br />
transaction time at LCSs in the NER is not very high due mainly to low traffic. Congestion at<br />
border is not a problem in the NER. At present, the field survey data indicates that it takes<br />
about 8-10 hours to clear goods at the border, which also varies across the LCSs.<br />
5.6 Concluding Remarks<br />
The field survey conducted across nine LCSs in the NER clearly shows the LCSs suffer from<br />
tremendous ‘infrastructure deficit’. Unavailability <strong>of</strong> electricity, bad road, manual h<strong>and</strong>ling <strong>of</strong><br />
goods, unfriendly exchange rate <strong>and</strong> many such barriers are making the trade at border a<br />
costly affair. Undoubtedly, these are the barriers which are prohibiting the <strong>of</strong>ficial trade to<br />
grow at the NER. As a result, un<strong>of</strong>ficial (informal) trade is very much rampant. Although<br />
congestion at border is not a problem in the NER, unfriendly trading environment is making<br />
the trade expensive. The field survey shows transaction costs at LCSs are very high, which<br />
vary between Rs. 2500 to Rs. 500. The high transaction cost at border can be mitigated<br />
through implementation <strong>of</strong> trade facilitation measures <strong>and</strong> policies, perhaps <strong>with</strong> a special<br />
focus on the NER.<br />
Our assessment is that trade creation can take place only if measures are taken, in particular<br />
to improve the quality <strong>of</strong> infrastructure at border, connectivity to the rest <strong>of</strong> state <strong>and</strong> the<br />
region <strong>and</strong> improvements in the supply capacities from the Indian side. Informal/illegal trade<br />
is a feature <strong>of</strong> border trade taking place <strong>with</strong> both neighbours. This trade is taking place<br />
through well-established trade points that have historically been used by the people <strong>of</strong> the<br />
region. The informal/illegal trade taking place through Moreh-Tamu is thriving on the back<br />
<strong>of</strong> the supplies being provided by both China <strong>and</strong> Thail<strong>and</strong>. As a result, trade comprises <strong>of</strong><br />
products that are well beyond the 40 items that have been identified by India <strong>and</strong> Myanmar as<br />
a part <strong>of</strong> their Border <strong>Trade</strong> Agreement <strong>of</strong> 1994, as amended in 2008. The magnitude <strong>of</strong><br />
informal/illegal trade taking place on Moreh-Tamu border may prompt the authorities to put<br />
regulations to check the growth <strong>of</strong> this trade. In this context, our assessment is that since the<br />
76
trade point existing in Moreh symbolises the historical links that existed between the people<br />
living in the border areas, it would make little economic sense to impose barriers. Rather, the<br />
efforts must be made to ensure that not only is this trade recognised, so as to get it included<br />
in the formal statistics, the available infrastructure <strong>and</strong> connectivity must be improved to<br />
enable greater trade flows to take place.<br />
<strong>Trade</strong> flows can be improved by adopting two sets <strong>of</strong> strategies for Bangladesh <strong>and</strong><br />
Myanmar. India-Bangladesh trade can be increased manifold through production networks,<br />
provided appropriate investments are made on two sides <strong>of</strong> the border on activities that give<br />
rise to trade complementarities. For instance, the NER, which is a hub <strong>of</strong> fresh fruits <strong>and</strong><br />
vegetables, can act as a source <strong>of</strong> raw materials for the upcoming food processing sector in<br />
Bangladesh. Furthermore, Indian entrepreneurs <strong>and</strong> technologists can help strengthen the<br />
food processing sector by extending the development <strong>of</strong> this sector. And, finally, this<br />
investment should take up primarily in the SME sector.<br />
Yet another sector that can be considered in this regard is the textiles <strong>and</strong> clothing sector. The<br />
NER has traditionally been a treasure trove <strong>of</strong> h<strong>and</strong>loom <strong>and</strong> niche fabrics like the “Assam<br />
muga”. Although the uniqueness <strong>of</strong> “Assam muga” has been recognised through the grant <strong>of</strong><br />
“geographical indication”, the artisans have remained in the poverty trap because <strong>of</strong><br />
inadequate dem<strong>and</strong> for their product. Linking the “Assam muga” producers to the clothing<br />
industry would provide a definite boost to these producers.<br />
While the above examples were intended to highlight the potential for vertical integration that<br />
exists between the NER <strong>and</strong> Bangladesh, the strategic imperative <strong>of</strong> promoting these<br />
activities cannot be overlooked. As mentioned above, promotion <strong>of</strong> such activities would lead<br />
to strong trade complementarities, thus promoting trade between the two countries. Thus,<br />
India’s exports <strong>of</strong> raw materials can be matched by its imports <strong>of</strong> processed products from<br />
Bangladesh. This pattern <strong>of</strong> trade will enable Bangladesh to export higher value added<br />
products <strong>and</strong> can thus help reduce its large trade imbalance <strong>with</strong> India.<br />
In case <strong>of</strong> border trade <strong>with</strong> Myanmar, efforts would have to be made by both Government <strong>of</strong><br />
Manipur <strong>and</strong> the Government <strong>of</strong> India to address the supply-bottlenecks that have caused a<br />
huge trade imbalance against India in the trade taking place through “Gate No. 2”. As<br />
indicated in the discussion above, there is evidence <strong>of</strong> dem<strong>and</strong> for Indian products in<br />
Myanmar <strong>and</strong> therefore it is important to widen the market for these products. While the<br />
market for traditional products is well recognised, it is important that non-traditional products<br />
are identified for possible export to Myanmar.<br />
The Government <strong>of</strong> Manipur has been arguing that industrialization must precede the opening<br />
up <strong>of</strong> trade. 27 The Government has argued that local industry like agro-processing,<br />
horticulture, textiles, etc. must be encouraged through the employment-led expansion <strong>of</strong> the<br />
regional market, which can result in substitution <strong>of</strong> imported product <strong>with</strong> local produce<br />
while at the same time servicing external dem<strong>and</strong>. It has further been pointed out that there is<br />
ample scope for the development <strong>of</strong> manufacturing/processing units for medicines, rubber<br />
goods, cycles <strong>and</strong> cycle parts, pharmaceuticals, edible oils, petroleum products, cement,<br />
cotton yarns, etc.<br />
We would argue that a well-honed strategy, which has a medium-term perspective, needs to<br />
be put in place. This strategy should be developed in the context <strong>of</strong> the closer economic<br />
integration that India is seeking <strong>with</strong> its immediate neighbourhood, the ASEAN region.<br />
27 Government <strong>of</strong> Manipur (2009), “Draft Manipur State Development Report”, Planning Department,<br />
Chapter XI, p. 165.<br />
77
While the infrastructure needs have been given serious attention, including the discussions on<br />
the Asia Highway Project that would go through Moreh, the stakeholders seem to be some<br />
distance away from putting in place plans that would help in exploiting the markets in the<br />
South <strong>East</strong> Asia. From India’s point <strong>of</strong> view, the lack <strong>of</strong> initiative on this score seems<br />
particularly stark given that the country had signed the India-ASEAN Free <strong>Trade</strong> Agreement<br />
almost a year <strong>and</strong> a half ago, <strong>and</strong> that the first phase <strong>of</strong> implementation <strong>of</strong> this FTA has<br />
already been gone through since the FTA became operational in January 2010.<br />
78
Appendix 5.1<br />
EXPANSION OF NORTH EAST INDIA’S TRADE AND INVESTMENT WITH BANGLADESH AND<br />
MYANMAR: AN ASSESSMENT OF THE OPPORTUNITIES AND CONSTRAINTS<br />
QUESTIONNAIRE<br />
Sr. No.<br />
Border: India-Bangladesh / India-Myanmar<br />
1. Identification <strong>of</strong> the LCS<br />
1.1. Name <strong>of</strong> the LCS: _______________________________ (India)<br />
1.2. Name <strong>of</strong> the other side <strong>of</strong> the LCS: ____________________(Bangladesh)<br />
___________________ (Myanmar)<br />
1.3. Name <strong>of</strong> the organization:__________________________________________<br />
1.4. Address <strong>of</strong> the organization:<br />
_______________________________________________________________<br />
Telephone: _________________________<br />
Mobile: ______________________<br />
Fax: ______________________<br />
Email: __________________________<br />
Website (if any): ________________________________________________<br />
1.5. Name <strong>of</strong> the respondent: Mr/Ms/Mrs __________________________________<br />
1.6. Designation <strong>of</strong> the respondent:_________________________________________<br />
1.7. Name <strong>of</strong> the enumerator: Mr/Ms/Mrs____________________________________<br />
1.8. Date <strong>of</strong> survey:_______________________<br />
For <strong>of</strong>fice use only:<br />
Cooperation <strong>of</strong> respondent: Good/Moderate/Poor<br />
Reliability <strong>of</strong> information: High/Moderate/Poor/Very Poor<br />
Report collected: Yes/No. If yes, describe it_____________________________<br />
Reviewed by: ____________________________ Date: ______________________<br />
If sent back for verification/correction:<br />
Verification done: Yes/No. If yes, date <strong>of</strong> verification: _______________________<br />
Verified by: ______________________________ Date: _____________________<br />
<br />
<br />
2: General Information<br />
Type <strong>of</strong> business Exporter<br />
Importer<br />
Both Exporter <strong>and</strong> Importer<br />
Others (please specify_________________)<br />
Managing international trade Goods<br />
<br />
<br />
Passengers<br />
Both goods <strong>and</strong> passengers<br />
State: LCS: <strong>Trade</strong> Route:<br />
79
No <strong>of</strong> years in the business Export: Import:<br />
Registration Number Export: Import:<br />
No <strong>of</strong> consignments (2007-2010)<br />
Top five traded products (2007 – 2010)<br />
Total trade h<strong>and</strong>led at this LCS (2007 – 2010) (specify<br />
the unit:______)<br />
*January – July 2010<br />
Export<br />
2007:<br />
2008:<br />
2009:<br />
2010*:<br />
Export<br />
1<br />
2<br />
3<br />
4<br />
5<br />
Export<br />
2007:<br />
2008:<br />
2009:<br />
2010*:<br />
Import<br />
2007:<br />
2008:<br />
2009:<br />
2010*:<br />
Import<br />
1<br />
2<br />
3<br />
4<br />
5<br />
Import<br />
2007:<br />
2008:<br />
2009:<br />
2010*:<br />
Name <strong>and</strong> address <strong>of</strong> the Chamber <strong>of</strong> Commerce / Industry<br />
Association in which you / your organization are a member<br />
Name <strong>of</strong> Bank <strong>and</strong> branch through which transactions are<br />
processed<br />
Working hours <strong>of</strong> the LCS India side:<br />
<br />
Other side (Bangladesh / Myanmar):<br />
No <strong>of</strong> government <strong>of</strong>ficials managing the LCS (as on July<br />
2010)<br />
Road distance <strong>of</strong> the LCS from state capital (in km)<br />
No <strong>of</strong> all-weather road access (routes) between state capital<br />
<strong>and</strong> LCS<br />
3: Pattern <strong>of</strong> <strong>Trade</strong><br />
3.1 Export through the LCS [add additional sheet if needed]<br />
Year 2010 (January –<br />
July)<br />
Name <strong>of</strong> goods<br />
Quantity<br />
(unit: ______)<br />
Value (unit:_________)<br />
80
Year: 2009 Name <strong>of</strong> goods Quantity<br />
(unit: ______)<br />
Value (unit:_________)<br />
Year: 2008 Name <strong>of</strong> goods Quantity<br />
(unit: ______)<br />
Value (unit:_________)<br />
Year: 2007 Name <strong>of</strong> goods Quantity<br />
(unit: ______)<br />
Value (unit:_________)<br />
3.2 Import through the LCS [add additional sheet if needed]<br />
Year 2010 (January –<br />
July)<br />
Name <strong>of</strong> goods<br />
Quantity<br />
(unit: ______)<br />
Value<br />
(unit:_________)<br />
Year: 2009 Name <strong>of</strong> goods Quantity<br />
(unit: ______)<br />
Value (unit:______)<br />
81
Year: 2008 Name <strong>of</strong> goods Quantity<br />
(unit: ______)<br />
Value (unit:_______)<br />
Year: 2007 Name <strong>of</strong> goods Quantity<br />
(unit: ______)<br />
Value (unit:_______)<br />
3.3 What are the other goods you think exporters from your state can export to Bangladesh / Myanmar? Please<br />
specify.<br />
3.4 What are the other goods that importers <strong>of</strong> your state can import from Bangladesh / Myanmar? Please specify:<br />
3.5 Please specify the origin <strong>of</strong> the goods that you are exporting to the partner country (Bangladesh / Myanmar /<br />
Other)<br />
3.6 Please specify the origin <strong>of</strong> the goods that you are importing from the partner country (Bangladesh / Myanmar /<br />
Other)<br />
3.7 Please specify the informal trade (including smuggling <strong>of</strong> goods) at this LCS.<br />
Export<br />
Year Product <strong>Trade</strong> value (specify<br />
unit:_______)<br />
2007<br />
Destination country(s)<br />
2008<br />
82
2009<br />
2010*<br />
*January – July 2010<br />
Import<br />
Year Product <strong>Trade</strong> value (specify<br />
unit:_______)<br />
2007<br />
Origina country(s)<br />
2008<br />
2009<br />
2010*<br />
*January – July 2010<br />
3.8 Please specify the trade at this LCS if conducted through barter system<br />
Export<br />
Year Product <strong>Trade</strong> value (specify<br />
unit:_______)<br />
2007<br />
Destination country(s)<br />
2008<br />
2009<br />
2010*<br />
*January – July 2010<br />
Import<br />
Year Product <strong>Trade</strong> value (specify<br />
unit:_______)<br />
2007<br />
Origina country(s)<br />
2008<br />
2009<br />
83
2010*<br />
*January – July 2010<br />
4. Barriers to <strong>Trade</strong><br />
4.1 What kind <strong>of</strong> constraints do you face in connection <strong>with</strong> your export/import through LCS? (please add separate<br />
page if needed)<br />
Infrastructure Non-infrastructure Others (please specify)<br />
Export Import Export Import Export Import<br />
4.2 Is there any problem <strong>with</strong> Customs classification? If yes, please specify.<br />
4.3 Is there any problem in obtaining Rules <strong>of</strong> Origin (RoO) Certificate? If yes, please specify.<br />
4.4 Do you face any problem in clearing consignments at Customs? If yes, please specify.<br />
4.5 Do you face any problem <strong>with</strong> border security agencies? If yes, please specify.<br />
4.6 Do you face any problem <strong>with</strong> st<strong>and</strong>ards <strong>and</strong> testing? If yes, please specify.<br />
4.7 Do you face any problem <strong>with</strong> business mobility? If yes, please specify.<br />
4.8 Do you face any problem <strong>with</strong> banks in transacting business? If yes, please specify.<br />
84
4.9 Does currency exchange rate pose any problem in conducting cross-border trade <strong>with</strong> Bangladesh / Myanmar? If<br />
yes, please specify.<br />
4.10 What is the mode you follow for dispute settlement, if any, <strong>with</strong> the exporters/importers from<br />
Bangladesh/Myanmar?<br />
4.11 Do you face any problem <strong>of</strong> unauthorized payment to any organization? If yes, please specify.<br />
4.12 What are the documents required for export/import through this border? Use additional sheets, if required.<br />
Export documents<br />
Import documents<br />
4.13 Is export/import duty structure trade promoting? If not, please specify<br />
4.14 Is Electronic Data Interchange (EDI) (for example ICEGATE) working at this border? If yes, please answer the<br />
following:<br />
(a) Year <strong>of</strong> introduction <strong>of</strong> EDI: _______________<br />
(b) Category <strong>of</strong> users: _____________<br />
(c) No. <strong>of</strong> trade declarations used through EDI per shipment: ____________<br />
4.15 Is trade h<strong>and</strong>led during night-time? Yes/No<br />
(a) If yes, what is the operation time? _____________<br />
(b) If no, what are the reasons for not having a night-time operation?<br />
4.16 Does this border have a cargo warehouse? Yes/No. If yes, complete the following:<br />
Size (specify<br />
unit)<br />
Capacity Working time Facilities Is it e-enabled?<br />
Yes/No<br />
4.17 What are the deficits <strong>of</strong> this border? Please arrange them serially. Add additional sheets if required.<br />
Facilities Yes/No Facilities Yes/No Facilities Yes/No<br />
85
4.18 What is the time (monthly average) taken for cargo clearance at this LCS?<br />
Year<br />
2005<br />
2006<br />
2007<br />
2008<br />
2009<br />
2010*<br />
Parking time (days) for<br />
export per<br />
truck/container<br />
*Take monthly average <strong>of</strong> January – August 2010<br />
Customs time (days) for<br />
export per<br />
truck/container<br />
Loading/unloading time<br />
(days) for export/import per<br />
truck/container<br />
4.19 What are the transaction costs (monthly average) at this LCS? (specify unit______) (US$/tonne)<br />
Year Loading/unloading Parking fees Speed money Clearing agent’s<br />
fees<br />
2005<br />
2006<br />
2007<br />
2008<br />
2009<br />
2010*<br />
*Take monthly average <strong>of</strong> January – August 2010<br />
87
4.20 What are the modes <strong>of</strong> transport currently used for cross-border trade? What are the limitations <strong>of</strong> the existing<br />
transport system?<br />
4.21 Are there any alternative routes for conducting the business? If yes, specify.<br />
4.22 Do you face any problem <strong>with</strong> parking at the LCS? If yes, specify<br />
4.23 Do you face any problem <strong>with</strong> loading <strong>and</strong> unloading at the LCS? If yes, please specify.<br />
4.24 Do you face any problem <strong>with</strong> dumping ground at the LCS? If yes, please specify.<br />
4.25 Do you face any problem <strong>with</strong> warehousing <strong>and</strong> storage at the LCS? If yes, please specify.<br />
4.26 Do you face any problem <strong>of</strong> congestion at the LCS? If yes, please specify.<br />
4.27 Whether the LCS has the following facilities?<br />
Facility Available (Y) Not available (N)<br />
Electricity<br />
Availability <strong>of</strong> electricity per day (good/bad)<br />
Telephone<br />
Internet<br />
EDI (Icegate)<br />
Weighbridge<br />
Warehouse<br />
Cold storage<br />
88
Parking place<br />
Transshipment platform / Transit sheds<br />
Dumping sheds<br />
Secretarial assistance (fax, photocopy etc.)<br />
Drinking water<br />
Drivers’ rest room<br />
Passengers rest room<br />
Health centre<br />
Hotels <strong>and</strong> restaurants<br />
Separate entry <strong>and</strong> exit gates<br />
Banks<br />
Courier / Post Office<br />
Servicing centre / Vehicle repair shops<br />
4.28 What improvement in infrastructure would promote border trade? Please specify:<br />
1.<br />
2.<br />
3.<br />
4.<br />
5.<br />
6.<br />
7.<br />
8.<br />
9.<br />
10.<br />
5. Cross-border <strong>Investment</strong> Opportunities<br />
5.1 Do you think there is scope for investment in Bangladesh/Myanmar from <strong>North</strong> <strong>East</strong>ern India? If yes, please<br />
specify it.<br />
Sectors Industries Type<br />
5.2 Are you aware <strong>of</strong> the investment regulatory framework in Bangladesh/Myanmar? If yes, please specify if there is<br />
any inadequacy in the framework.<br />
89
5.3 What type <strong>of</strong> risks that Indian investment may face in Bangladesh/Myanmar? If yes, please specify the risk<br />
factors.<br />
Business<br />
Political<br />
5.4 Do the financial organizations in India lend fund for investment in Bangladesh/Myanmar?<br />
5.5 Do you find any problem in getting institutional credit for your business? If yes, please specify.<br />
5.6 If Indian firms invest in Bangladesh/Myanmar on ‘buy back’ format, will the import be made duty free?<br />
5.7 Have you made any investment in Bangladesh/Myanmar? If yes, please specify the area.<br />
5.8 Are there any other investors from your state who have invested in Bangladesh/ Myanmar? If yes, how many?<br />
Specify their areas.<br />
5.9 Is there any investment in your state from Bangladesh/Myanmar? If yes, specify the details.<br />
5.10 Are you aware <strong>of</strong> the investment regulatory framework <strong>of</strong> your state? Does it allow investors from<br />
Bangladesh/Myanmar?<br />
5.11 Does exchange rate pose any problem in conducting cross-border trade <strong>with</strong> Bangladesh / Myanmar? If yes,<br />
please specify.<br />
5.12 What is the currency used for transaction? Is there any difference between <strong>of</strong>ficial <strong>and</strong> un<strong>of</strong>ficial exchange<br />
rates? If yes, how do businesses sort out this difference?<br />
5.13 What are the barriers you think prohibiting investment flows between Indian <strong>North</strong>eastern States <strong>and</strong><br />
Bangladesh / Myanmar? Please mark them serially.<br />
1.<br />
2.<br />
3.<br />
4.<br />
90
5.<br />
5.14 What would promote cross-border investment flows between Indian <strong>North</strong>eastern States <strong>and</strong> Bangladesh /<br />
Myanmar? Please specify.<br />
1.<br />
2.<br />
3.<br />
4.<br />
5<br />
91
Chapter 6<br />
Policy Recommendations <strong>and</strong> the Way Forward<br />
The <strong>North</strong> <strong>East</strong> Region (NER) is critically located for it holds the key to India’s economic<br />
integration efforts <strong>with</strong> its neighbours in South <strong>and</strong> South <strong>East</strong> Asia. The importance <strong>of</strong> the<br />
region is greatly enhanced since it provides a critical link for the Asian Highway Project that<br />
will connect Asia <strong>with</strong> Europe.<br />
History suggests that the connectivity between countries had taken place on the back <strong>of</strong><br />
strong <strong>and</strong> sustainable economic links. Thus, the road <strong>and</strong> rail networks that have developed<br />
in most regions <strong>of</strong> the world are in the nature <strong>of</strong> economic corridors that have joined the<br />
major centres <strong>of</strong> trade <strong>and</strong> commerce. India’s connectivity <strong>with</strong> its eastern neighbours has<br />
been no exception. While <strong>with</strong> Bangladesh, the connectivity <strong>with</strong> the other parts <strong>of</strong> India had<br />
developed when the region was a part <strong>of</strong> undivided India, Myanmar had long been an<br />
extended part <strong>of</strong> the Indian Union prior to the 1940s. With the re-defining <strong>of</strong> regional politics<br />
more than 60 years ago, the political lines were drawn more sharply, but this did not result in<br />
the severing <strong>of</strong> the economic links between the peoples living on the borders. Imperatives <strong>of</strong><br />
the local economy together <strong>with</strong> the strong ethnic links between the peoples on the two sides<br />
<strong>of</strong> the political boundaries have helped maintain the trade links through the local trade points,<br />
although it must be argued that these boundaries have thwarted the natural growth <strong>of</strong> trade<br />
<strong>and</strong> commerce. But, <strong>with</strong> the new found emphasis on regional integration, alongside<br />
improvement <strong>of</strong> bilateral relations in recent years, possibilities <strong>of</strong> developing the economic<br />
ties are now being explored. A logical starting point for such an exercise involving the<br />
neighbouring countries, <strong>with</strong> whom India shares common l<strong>and</strong> frontiers, is to study the<br />
dynamics <strong>of</strong> trade taking place through the local trade points. Over the years, both the<br />
Government <strong>of</strong> India <strong>and</strong> the Governments <strong>of</strong> the State where these trade points exist, have<br />
realised the importance <strong>of</strong> these trade points <strong>and</strong> have set up L<strong>and</strong> Customs Stations (LCSs)<br />
<strong>with</strong> the objective <strong>of</strong> brining the informal/illegal trade taking place onto the formal channels.<br />
An elaborate plan has now been drawn up to convert a number <strong>of</strong> these LCSs into Integrated<br />
Check Posts (ICPs), which would provide better facilities to the traders.<br />
The present study is an attempt to provide inputs to the Government <strong>of</strong> India as it undertakes<br />
the task <strong>of</strong> strengthening the border trade taking place on India’s borders <strong>with</strong> Bangladesh<br />
<strong>and</strong> Myanmar. The study seeks to provide a better underst<strong>and</strong>ing <strong>of</strong> the dynamics <strong>of</strong> India’s<br />
border trade <strong>with</strong> its neighbours <strong>and</strong> to suggest ways in which this trade can be strengthened.<br />
This was done by looking at the functioning <strong>of</strong> several LCSs situated at the India-Bangladesh<br />
<strong>and</strong> India-Myanmar borders.<br />
The recommendations <strong>of</strong> this study are presented in four parts. The first relates to the policy<br />
measures that are needed to provide impetus to border trade. The second would cover the<br />
infrastructure <strong>and</strong> trade facilitation measures that must be taken to provide added incentives<br />
to the traders. The third relates to the payments arrangements, <strong>with</strong>out which trade will<br />
always face impediments. And, finally, suggestions would be made as to how the supply-side<br />
issues can be addressed, keeping in view a medium term perspective.<br />
92
I. Policy Measures<br />
3. Development <strong>of</strong> “border haats”, alongside upgrading the LCSs into ICPs, would<br />
provide tremendous boost to border trade. While steps have already been taken to<br />
open border on the India-Bangladesh border, similar initiatives can also be taken on<br />
the India-Myanmar border.<br />
4. The Border <strong>Trade</strong> Agreement between India <strong>and</strong> Myanmar needs to be revisited <strong>with</strong><br />
a view to substantially increase the list <strong>of</strong> products in which barter trade is allowed at<br />
present. The list <strong>of</strong> 40 items has lost its relevance while the normal or regular trade<br />
has gained the popularity over time. With almost all possible tradable items being<br />
traded through Moreh, the most important trade point on the India-Myanmar border,<br />
artificial barriers like the ones imposed through the Border <strong>Trade</strong> Agreement would<br />
only result in the development <strong>of</strong> a parallel economy. Government may, therefore,<br />
allow normal trade to take place in accordance <strong>with</strong> the Foreign <strong>Trade</strong> Policy.<br />
II.<br />
Infrastructural bottlenecks<br />
5. Essential infrastructure necessary to promote border trade is lacking in all the LCSs<br />
that were covered by the study. Road connectivity needs to be improved. The<br />
National Highways <strong>and</strong> the State Highways linking the LCSs <strong>with</strong> the rest <strong>of</strong> the<br />
country should be upgraded. Upgradation <strong>of</strong> the road infrastructure will help in<br />
improving the supplies <strong>of</strong> goods from the rest <strong>of</strong> the region <strong>and</strong> would help in<br />
reducing the large trade imbalances that India faces exist at some <strong>of</strong> the trade points,<br />
in particular at Moreh. This study has pointed out that there is a dem<strong>and</strong> for Indian<br />
products in Myanmar, <strong>and</strong> possibly beyond, which can be satisfied if critical<br />
connectivity <strong>with</strong> the rest <strong>of</strong> the country is put in place. Local enterprise will also<br />
receive an additional incentive to go beyond the borders if the problems in l<strong>and</strong><br />
connectivity are addressed.<br />
6. Although the LCSs have been set up in most <strong>of</strong> the border trade points that were<br />
included in the study, facilities available at these LCSs are not conducive to<br />
conducting high volumes <strong>of</strong> trade. Communication systems are in a state <strong>of</strong> disrepair<br />
in most <strong>of</strong> the border trade points. In some cases, like Moreh, where communication<br />
systems are in place, the service is highly erratic. Most <strong>of</strong> the other infrastructural<br />
facilities are either non-functional or are unavailable. These include weighbridges,<br />
warehouses <strong>and</strong> dumping sheds.<br />
7. Since food items account for a significant proportion <strong>of</strong> trade taking place through the<br />
border trade points, specific infrastructural needs <strong>of</strong> these products would have to be<br />
addressed. Animal <strong>and</strong> plant testing <strong>and</strong> quarantine facilities, conforming to<br />
international st<strong>and</strong>ards, need to be put in place near the LCSs to prevent spread <strong>of</strong><br />
undesirable pests <strong>and</strong> pathogens. Since a significant proportion <strong>of</strong> the traded products<br />
are in the nature <strong>of</strong> perishables, establishment <strong>of</strong> cold storages would go a long way<br />
not only in fetching better value for the products that are currently being traded, there<br />
would be an additional incentive for pushing up trade in these products.<br />
8. Upgrading <strong>of</strong> the infrastructure should be done <strong>with</strong> a view to improving the<br />
efficiency <strong>of</strong> the customs authorities so that the lead time for clearances is reduced to<br />
the bare minimum. Appropriate trade facilitation measures would have to be taken to<br />
reduce the transactions cost. It may be mentioned in this context that the use <strong>of</strong><br />
information technology (IT) <strong>and</strong> information technology enabled services (ITES) has<br />
93
provided fillip to trade facilitation in many countries <strong>and</strong> these experiences need to be<br />
replicated in India to facilitate border trade.<br />
III.<br />
Payments Arrangements<br />
13. Payments arrangements remain the most serious hindrance in promoting border trade<br />
through the formal channels. This is particularly true <strong>of</strong> India-Myanmar trade where<br />
the absence <strong>of</strong> a realistic exchange rate that can be used for <strong>of</strong>ficial purposes has<br />
prevented the formal trade at the border from taking roots. It was indicated that the<br />
cross rate between rupee <strong>and</strong> kyat is 210 times higher than the rate that is being used<br />
in the grey market through which the informal/illegal trade is taking place. The rupee<br />
has come to be accepted as the currency for conducting India-Myanmar trade at the<br />
border. It is, therefore, strongly recommended that two Governments agree to the<br />
conduct <strong>of</strong> border trade in Indian rupees. This could be the first step towards<br />
introducing rupee trade to conduct the entire India-Myanmar trade.<br />
14. Once the payments arrangements are sorted out, the banking systems in the two<br />
countries, led by the UBI <strong>and</strong> the Myanmar Economic Bank, should be so developed<br />
as to respond to the requirements <strong>of</strong> the traders. The lack <strong>of</strong> interest on the part <strong>of</strong> the<br />
in using Letters <strong>of</strong> Credit (LCs) is likely to hamper the development <strong>of</strong> trade through<br />
formal channels. It has to be recognised that even in the best <strong>of</strong> situations, LCs are<br />
difficult for the small traders to h<strong>and</strong>le <strong>and</strong>, therefore, concerted efforts would have to<br />
be taken to ensure that this instrument is put to use. It may be suggested that the<br />
traders associations involved in border trade together <strong>with</strong> export promotion councils,<br />
like the SHEFEXIL, <strong>and</strong> the banks undertake a series <strong>of</strong> programmes to popularise the<br />
use <strong>of</strong> LCs.<br />
IV.<br />
Addressing the Supply-side Bottlenecks<br />
6. While many <strong>of</strong> the measures suggested in the foregoing would lead to the removal <strong>of</strong><br />
supply-side bottlenecks on the Indian side <strong>of</strong> the border, there is a need to take a<br />
medium-term perspective to address the supply-side issues so as to make effective use<br />
<strong>of</strong> the border trade points. For so doing, the Government <strong>of</strong> India, along <strong>with</strong> the<br />
concerned State Government, would have to devise an elaborate plan that links the<br />
development <strong>of</strong> certain sectors in the NER <strong>with</strong> the trade channels provided by the<br />
border trade points.<br />
7. The NER has long been the hub <strong>of</strong> niche products in the h<strong>and</strong>icrafts <strong>and</strong> h<strong>and</strong>loom,<br />
much <strong>of</strong> which is in the state <strong>of</strong> decline for want <strong>of</strong> effective government intervention.<br />
As their budgetary position has deteriorated, the State Governments have lowered the<br />
level <strong>of</strong> support that was once given to the artisans. It is suggested that these activities<br />
need to be revived <strong>with</strong> Central assistance through a well coordinated programme to<br />
promote the artisans. This programme could be modelled on the One Village One<br />
Product movement that was initiated in Japan in the late 1970s, which promoted one<br />
competitive <strong>and</strong> staple product from a village to improve the living st<strong>and</strong>ards <strong>of</strong> the<br />
population. More recently, Thail<strong>and</strong> developed the One Tambon One Product (OTOP)<br />
programme to encourage village communities to improve the quality <strong>and</strong> marketing <strong>of</strong><br />
the locally made products, including h<strong>and</strong>icrafts, cotton <strong>and</strong> silk garments, pottery,<br />
fashion accessories, household items, <strong>and</strong> foods. The OTOP programme, which is<br />
94
more relevant for the NER, selected one superior product from each tambon (subdistrict),<br />
granted it a br<strong>and</strong> (“starred OTOP product”), <strong>and</strong> provided local <strong>and</strong><br />
international stage for the promotion <strong>of</strong> these products. Besides promoting the<br />
products, the OTOP Programme (renamed as the “Local <strong>and</strong> Community Products”,<br />
even though the “OTOP” br<strong>and</strong> name has been retained), led to promotion <strong>of</strong> tourism<br />
in the districts from which the products had originated.<br />
8. In case <strong>of</strong> Bangladesh, the Government <strong>of</strong> India <strong>and</strong> the State Government may also<br />
consider developing a tripartite relationship aimed at promoting trade <strong>and</strong> investment<br />
in Bangladesh <strong>and</strong> India. The focus <strong>of</strong> these efforts could be the support that India<br />
needs to provide to Bangladesh to set up enterprises in the small <strong>and</strong> medium<br />
enterprise (SME) sector, which are based on resources that are provided from India’s<br />
NER. The sectors that select themselves naturally are food processing <strong>and</strong> textiles <strong>and</strong><br />
clothing. The industries set up in Bangladesh <strong>with</strong> India’s support can leverage the<br />
vast market in the NER that is waiting to be exploited.<br />
9. Development <strong>of</strong> local industries is an imperative that must be given high priority,<br />
especially in the face <strong>of</strong> the strong in-roads that imported products are making into the<br />
local economy. Industries like agro-processing, horticulture, textiles, etc. must be<br />
encouraged through the employment-led expansion <strong>of</strong> the regional market, which can<br />
result in substitution <strong>of</strong> imported product <strong>with</strong> local produce while at the same time<br />
servicing external dem<strong>and</strong>. At the same time, possibilities <strong>of</strong> developing<br />
manufacturing/processing units for medicines, rubber goods, cycles <strong>and</strong> cycle parts,<br />
pharmaceuticals, edible oils, petroleum products, cement, <strong>and</strong> cotton yarns in the<br />
NER must be explored.<br />
10. There is an urgent need to focus on trade-related capacity building/development<br />
amongst <strong>of</strong>ficials, entrepreneurs, for this is the sine qua non for strengthening the<br />
human resource base. Strengthening <strong>of</strong> human resources would only help improve the<br />
quality <strong>of</strong> services but will also encourage the stakeholders to take new initiatives.<br />
Structured programmes covering cross-cutting issues would go a long way in<br />
improving the delivery <strong>of</strong> trade-related services that would in turn help in the<br />
development <strong>of</strong> border trade. Needless to say, proactive involvement <strong>of</strong> the State<br />
Governments <strong>and</strong> their agencies is essential for getting the desired results.<br />
95
References<br />
Barro, R. J. (1990), ‘Government Spending in a Simple Model <strong>of</strong> Endogenous Growth’, Journal <strong>of</strong> Political Economy, 98, 5,<br />
S102- S125.<br />
Barro, R. J. (1991), ‘Economic Growth in a Cross-section <strong>of</strong> Countries’, Quarterly Journal <strong>of</strong> Economics, 106, 407-443.<br />
Bhattacharya, Biswa <strong>and</strong> Prabir De (2006) “Promotion <strong>of</strong> <strong>Trade</strong> <strong>and</strong> <strong>Investment</strong> between People’s Republic <strong>of</strong> China <strong>and</strong><br />
India: Toward a Regional Perspective”, Asian Development Review, Vol. 22, No. 1, Asian Development Bank, Manila<br />
Brunner, Hans-Peter W., ed., (2010) <strong>North</strong> <strong>East</strong> India – Local Economic Development <strong>and</strong> Global Markets, Sage<br />
Publications, New Delhi<br />
Canning, D. (2006), ‘A Database <strong>of</strong> World Infrastructure Stocks, 1950-95’, World Bank Policy Research Working Paper No.<br />
1929, World Bank, Washington D.C.<br />
Das, Gurudas (2005) Structural Change <strong>and</strong> Strategy <strong>of</strong> Development: Resource-Industry Linkages in <strong>North</strong> <strong>East</strong>ern<br />
Region, 2005, Akansha Publishing House, New Delhi<br />
Das, Gurudas <strong>and</strong> C. Joshua Thomas (2008), Indo - Bangladesh Border <strong>Trade</strong>, Akansha Publishing House, New Delhi<br />
De, Prabir (2008) “<strong>Trade</strong> Transportation Costs in South Asia: An Empirical Investigation” in Douglas Brooks <strong>and</strong> David<br />
Hummels (eds.) Infrastructure’s Role in Lowering Asia’s <strong>Trade</strong> Costs: Building for <strong>Trade</strong>, Edward Elgar, Cheltenham.<br />
Francois J et. Al. (2009) Pan-Asian Integration: Linking <strong>East</strong> <strong>and</strong> South Asia, Basingstoke: Palgrave Macmillan.<br />
Reserve Bank <strong>of</strong> India (2000), Barter <strong>Trade</strong> <strong>with</strong> Myanmar under the Indo-Myanmar Border <strong>Trade</strong> Agreement, A.P.(DIR<br />
Series) Circular No.17, October 16.<br />
Straub, S. (2008), ‘Infrastructure <strong>and</strong> Development: A Critical Appraisal <strong>of</strong> the Macro Level Literature’, World Bank Policy<br />
Research Working Paper 4590, World Bank, Washington, D.C.<br />
World Bank (1994), World Development Report, 1994, Washington, D.C.<br />
96
Annexure 1<br />
Commodities identified for exchange by residents living along the border between India <strong>and</strong><br />
Myanmar under the Indo-Myanmar Border <strong>Trade</strong> Agreement<br />
1. Mustard/Rape Seed<br />
2. Pulses <strong>and</strong> Beans<br />
3. Fresh Vegetable<br />
4. Fruits<br />
5. Garlic<br />
6. Onions<br />
7. Chillies<br />
8. Spices (excluding nutmeg, mace, cloves, Cassia)<br />
9. Bamboo<br />
10. Minor forest products excluding Teak<br />
11. Betel Nuts <strong>and</strong> leaves<br />
12. Food items for local consumption<br />
13. Tobacco<br />
14. Tomato<br />
15. Reed Broom<br />
16. Sesame<br />
17. Resin<br />
18. Corri<strong>and</strong>er Seeds<br />
19. Soyabean<br />
20. Roasted Sunflower Seeds<br />
21. Katha<br />
22. Ginger<br />
23. Any other commodities as may be mutually agreed upon between the two sides.<br />
97
RIS<br />
Research <strong>and</strong> Information System<br />
for Developing Countries<br />
Ministry <strong>of</strong> Development <strong>of</strong><br />
<strong>North</strong> <strong>East</strong>ern Region<br />
<strong>North</strong> <strong>East</strong>ern Council