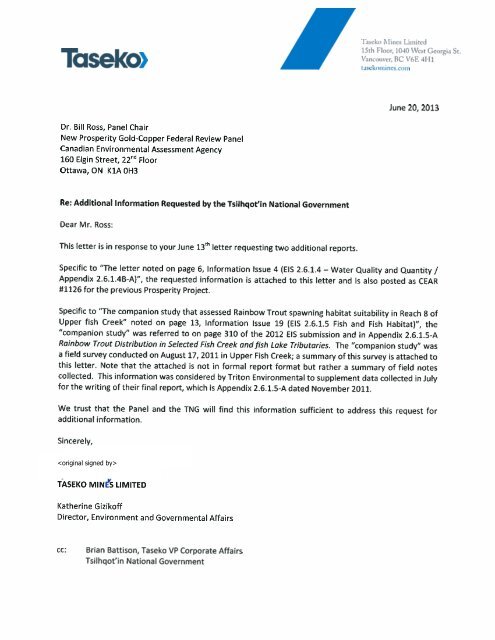
June 20, 2013 Dr. Bill Ross, Panel Chair New Prosperity Gold ...
June 20, 2013 Dr. Bill Ross, Panel Chair New Prosperity Gold ...
June 20, 2013 Dr. Bill Ross, Panel Chair New Prosperity Gold ...

Create successful ePaper yourself
Turn your PDF publications into a flip-book with our unique Google optimized e-Paper software.
Ta Vancouver,<br />
Taseko Mines Limited<br />
ta 15thkoiiilnes.com<br />
Floor; BC 1040\‘6E West 4111 Georgia St.<br />
<strong>June</strong> <strong>20</strong>, <strong>20</strong>13<br />
<strong>Dr</strong>. <strong>Bill</strong> <strong>Ross</strong>, <strong>Panel</strong> <strong>Chair</strong><br />
<strong>New</strong> <strong>Prosperity</strong> <strong>Gold</strong>-Copper Federal Review <strong>Panel</strong><br />
Canadian Environmental Assessment Agency<br />
160 Elgin Street, 22nd Floor<br />
Ottawa, ON K1A 0H3<br />
Re: Additional Information Requested by the Tsilhqot’in National Government<br />
Dear Mr. <strong>Ross</strong>:<br />
This letter is in response to your<strong>June</strong> l3~~ letter requesting two additional reports.<br />
Specific to “The letter noted on page 6, Information Issue 4 (ElS 2.6.1.4 — Water Quality and Quantity /<br />
Appendix 2.6.1.4B A)”, the requested information is attached to this letter and is also posted as CEAR<br />
#1126 for the previous <strong>Prosperity</strong> Project.<br />
Specific to “The companion study that assessed Rainbow Trout spawning habitat suitability in Reach 8 of<br />
Upper fish Creek” noted on page 13, Information Issue 19 (ElS 2.6.1.5 Fish and Fish Habitat)”, the<br />
“companion study” was referred to on page 310 of the <strong>20</strong>12 ElS submission and in Appendix 2.6.1.5-A<br />
Rainbow Trout Distribution in Selected Fish Creek and fish Lake Tributaries. The “companion study” was<br />
a field survey conducted on August 17, <strong>20</strong>11 in Upper Fish Creek; a summary of this survey is attached to<br />
this letter. Note that the attached is not in formal report format but rather a summary of field notes<br />
collected. This information was considered by Triton Environmental to supplement data collected in July<br />
for the writing of their final report, which is Appendix 2.6.1.5-A dated November <strong>20</strong>11.<br />
We trust that the <strong>Panel</strong> and the TNG will find this information sufficient to address this request for<br />
additional information.<br />
Sincerely,<br />
LIMITED<br />
Katherine Gizikoff<br />
Director, Environment and Governmental Affairs<br />
Brian Battison, Taseko VP Corporate Affairs<br />
Tsilhqot’in National Government
Upper Fish Creek Survey<br />
Crew BR and RT<br />
Wx cloudy with showers<br />
Air temp 14 °<br />
Water Temp 18 °<br />
The objective of the survey was to collect habitat suitability data at flow that approximated those<br />
that will be experienced post project. These flows will be reduced from current values due to the<br />
placement of a tailings storage facility upstream of Fish Lake. The flow levels expected are:<br />
May - 0.15 m3/s to 0.43 m3/s <strong>June</strong> – 0.04 m3/s to 0.13 m3/s. A survey conducted by Triton<br />
on July 24 indicated that flow levels were at or above the upper limits of post project flows.<br />
Field work was scheduled to take place later to capture the lower bounds of the future flows.<br />
The survey was initiated on August17, <strong>20</strong>11. When the crew arrived at Upper Fish Creek the<br />
discharge was 0. The channel showed indications of a recent and rapid flow recession. Algae<br />
mats on the dewatered riffles were wetted and grasses within dry channel area were still at<br />
repose. It is unclear how recently the flow recession had occurred but based on our observation<br />
it appeared to be in the range of days. It is also not clear why flow recession would have been<br />
as rapid as seemed to occur.<br />
A habitat assessment was undertaken to document the habitat strata in Upper fish Creek in the<br />
area downstream of the proposed tailings dam. The stream was walked from the mouth for a<br />
lineal distance of 1.95 km upstream based on GPS tracking from the mouth, which was estimated<br />
to be approximately 3-4 km of stream length. Habitat units were defined by distance upstream<br />
along with substrate within the units. Arial extents of potential spawning areas were estimated.<br />
Although there was no flow the channel was wetted in sections that were contained within riffle<br />
units that provided tailwater controls for the wetted sections. These sections were classified as<br />
pool/glide on the survey sheet but are likely primarily glides when continuous flows are present.<br />
Repeating sections of riffle and pool/glide would describe the overall stream morphology of<br />
upper fish creek (see attached spreadsheet). The riffles were comprised on small and large<br />
cobbles with some small boulders. A few of the riffles had some gravels but the smaller<br />
substrate fraction was generally absent. Riffle gradients varied from 1 to 4 %. Most of the riffles<br />
were completely dewatered although some were wetted to depths of 5 cm. Some riffles were<br />
short < 2 m in length and functioned as weirs providing local hydraulic control, while some<br />
riffles exceeded 30 m in length. The pools controlled by the riffles could be classified in three<br />
different substrate types. Lower pool/glides had primarily cobble boulder beds with overlying<br />
fines, some small pockets of gravel were observed but the area was limited. The mid survey area<br />
had smaller substrates and this is the area where the majority of the spawning potential was<br />
noted. The stream section located between 900m and 1.2 km from the mouth had areas of good<br />
spawning gravel and evidence of active spawning within these areas. Rainbow trout fry were<br />
also observed in this area although in low numbers.
Upstream of this section the pools/glides had primarily silty bottoms, with limited spawning<br />
potential.<br />
Several relic beaver dams were located along the channel. They appear to have been abandoned<br />
for several years but still pose passage problems. Redds and fry were located above the beaver<br />
dams suggesting spring freshette provides options for upstream passage. These could include<br />
bypass flows. These potential bypass flows may not be present post project and may exacerbate<br />
passage impacts.<br />
The observed spawning sites were located in what would be glide habitat. In the largest area at<br />
km 1.03 to 1.15 gravels were distributed downstream of a pool/glide below a riffle. Downstream<br />
of the pool the channel became constricted that resulted in localize velocity increases. The<br />
gravels there appeared to have had a heady concentration of spawners based on the disturbance<br />
noted. There does not appear to be much gravel recruitment to upper Fish Creek. What is there<br />
is maintained through the riffle/glide morphology of the system. Even with lower flows<br />
hydraulic conditions could be manipulated to provide the necessary spawning requirements.<br />
Provided there is no new recruitment of beavers perhaps the existing relic dams could be<br />
removed modified to mitigate the loss of high bypass flows.<br />
Photos
Photo 2 typical cobble boulder riffle<br />
Photo 1 Pool between riffles
Photo 3 Relic Beaver Dam<br />
Photo 4 Large Relic Beaver Dam > m high
Photo Main spawning location gravels are present upstream and through the channel narrowing<br />
providing up to 100 m² of spawning habitat No flow at time of survey August 17, <strong>20</strong>11<br />
Prepared for:<br />
Taseko Mines Limited<br />
10<strong>20</strong> – 800 West Pender Street<br />
Vancouver, BC V6C 2V6<br />
Prepared by:<br />
Triton Environmental Consultants Ltd.<br />
1326 McGill Rd.<br />
Kamloops, BC<br />
V2C 6N6
Habitat Assessment of Upper Fish Creek August 17, <strong>20</strong>11<br />
Wx Cldy with showers Air Temp 15 ° Water Temp 18 °<br />
Crew BR RT<br />
Started survey 0:900 hours<br />
Location Habitat Unit Substrate<br />
Spawning<br />
area m² Comments<br />
Mouth 0<br />
1 0‐45<br />
Lake<br />
backwater Cobble Boulder interspaced with fines<br />
2 45 ‐50 Cobble Riffle Large and small cobble No flow in Creek<br />
3 50‐67 Pool/Glide Cobble dominant substrate, limited gravels<br />
Pool at time of visit downstream<br />
riffle impounds water<br />
4 67‐70 Cobble Riffle Large and small cobble No flow through rifle<br />
5 70‐76 Pool/Glide Cobble dominant substrate, limited gravels<br />
6 76‐85<br />
cobble/bldr<br />
riffle Large and small cobble some small boulder No flow through riffle<br />
7 85‐122 Pool/Glide<br />
Sands and some gravels (5²), with scattered<br />
boulders 5<br />
Pockets of potential spawning<br />
gravels 5 m²<br />
8 122‐141<br />
cobble/bldr<br />
riffle<br />
Large and small cobble some small boulder<br />
9 141‐157 Pool/Glide<br />
Sands and some gravels (5 m²) , with scattered<br />
boulders 5<br />
10 157‐159 Cobble Riffle Large and small cobble<br />
11 159‐170 Pool/Glide Cobbles with some fines<br />
12 170‐174 Cobble Riffle<br />
Large and small cobble with some small<br />
boulders (1 m width)<br />
Pockets of potential spawning<br />
gravels 5 m²<br />
no spawning gravel noted. Location<br />
of staff gauge 0.08 pool backwatered<br />
from DS weir<br />
13 174‐184 Pool/Glide Cobbles with some fines
Location Habitat Unit Substrate<br />
Spawning<br />
area m²<br />
Comments<br />
14 184‐<strong>20</strong>8 Cobble riffle<br />
Large and small cobble with some small<br />
boulders channel width 1m<br />
15 <strong>20</strong>8‐215<br />
Split channel<br />
cobble riffles<br />
(2) Large and small cobbles<br />
16 215‐230 Pool/Glide Cobbles with some fines<br />
17 230‐232 Cobble riffle<br />
Large and small cobble with some small<br />
boulders<br />
18 232‐241 Pool/Glide cobble and large boulder with covering fines<br />
19 241‐276 Cobble riffle<br />
Large and small cobble with some small<br />
boulders<br />
<strong>20</strong> 276‐300 Pool/Glide<br />
Fines and small gravel some spawning<br />
potential with appropriate velocities (5 m²) 5<br />
21 300‐305 Cobble riffle<br />
Large and small cobble with some small<br />
boulders<br />
22 305‐322 Pool/Glide<br />
Fines and small gravel some spawning<br />
potential with appropriate velocities (5‐7 m²) 7<br />
23 322‐331 Cobble riffle<br />
Large and small cobble with some small<br />
boulders<br />
24 331‐347 Pool/Glide<br />
Fines and small gravel some spawning<br />
potential with appropriate velocities (5‐10 m²) 10<br />
25 347‐373 Cobble riffle<br />
Large and small cobble with some small<br />
boulders deposit of gravels at upstream end<br />
of riffle could be used for spawning with<br />
appropriate flows.<br />
26 373‐380 Pool/Glide Cobbles and fines<br />
27 380‐382 Cobble riffle<br />
Large and small cobble with some small<br />
boulders<br />
28 382‐391 Pool/Glide Cobbles and fines<br />
29 391‐397 Cobble riffle Large and small cobble
Location Habitat Unit Substrate<br />
Spawning<br />
area m²<br />
30 377 Beaver dam Relic dam 60 cm high veg growing on top<br />
Fine sediments overlaying cobble boulder<br />
31 377‐411 Pool/Glide vegetated with grasses<br />
32 411‐438 Cobble riffle Large and small cobble<br />
33 438‐447 Pool/Glide cobble boulder with fines<br />
34 447‐483 Cobble riffle Large and small cobble<br />
35 483 Beaver Dam Relic dam 70 cm high<br />
36 483‐513 Pool <strong>Dr</strong>y pond above relic beaver dam<br />
37 513 Beaver dam Relic keeping flows out of downstream pond<br />
38 513‐551 Pool/Glide cobbles fines<br />
39 551‐573 Cobble riffle Large and small cobble<br />
40 573 Beaver dam 60 cm high looks like barrier<br />
Predominantly fines with some cobbles at<br />
41 573‐600 Beaver pond upstream end<br />
42 600‐608 Cobble Riffle Large and small cobble<br />
43 608‐614 Pool/Glide cobbles fines<br />
Cobles with some lateral gravel pockets (1‐2<br />
44 614‐618 Cobble Riffle m²) 2<br />
45 618‐621 Pool/Glide cobbles fines<br />
46 621‐625 Cobble Riffle Large and small cobble<br />
47 625‐634 Pool/Glide cobbles and some gravels 3m² 3<br />
48 634‐644 Cobble Riffle Large and small cobble<br />
49 644‐676 Pool/Glide cobbles and some gravels 5m² 5<br />
Large and small cobble heavily matted with<br />
50 676‐685 Cobble Riffle algae<br />
51 685‐700 Pool/Glide cobbles and fines<br />
52 700‐703 Cobble Riffle Large and small cobble<br />
Long<br />
53 703‐772 Pool/glide cobbles and fines no spawning gravel found<br />
Comments
Location Habitat Unit Substrate<br />
Spawning<br />
area m²<br />
54 772‐780 Cobble Riffle Large and small cobble<br />
55 780‐800 Pool/Glide cobbles and fines<br />
56 800‐806 Cobble Riffle Large and small cobble<br />
57 806‐829 Pool/Glide cobbles and fines<br />
58 829‐838 Cobble Riffle Large and small cobble<br />
59 838‐905 Pool/Glide Cobble Boulder fines<br />
No defined<br />
60 905‐9<strong>20</strong> channel channel definition lost flows through grasses<br />
61 9<strong>20</strong>‐925 Cobble Riffle Large and small cobble<br />
spawning gravels present (50 m ²) depth <strong>20</strong> ‐<br />
62 925‐955 Pool/Glide 30 cm 50<br />
63 955‐960 Cobble Riffle Large and small cobble<br />
spawning gravels present (5 m ²) depth <strong>20</strong> ‐30<br />
64 960‐978 Pool/Glide cm<br />
65 978‐981 Cobble Riffle cobble gravel<br />
spawning gravels present (<strong>20</strong> m ²) depth <strong>20</strong> ‐<br />
66 981‐995 Pool/Glide 30 cm <strong>20</strong><br />
67 995‐1.03 Cobble Riffle Large and small cobble<br />
68 1.03‐1.15‐ Pool/Glide Sands gravels 100m² spawning gravels 100<br />
69 1.15 ‐1.<strong>20</strong> Cobble Riffle Large and small cobble<br />
70 1.<strong>20</strong>‐1.28 Pool/Glide fines<br />
71 1.28‐1.32 Pool/Glide fines channel has instream vegetation grasses<br />
72 1.32‐1.35 Cobble Riffle Cobbles and small boulders 3‐4% gradient<br />
73 1.35‐1.39 Pool/Glide cobble and fines<br />
74 1.39‐1.42 Cobble Riffle Large and small cobble<br />
75 1.42 Beaver Dam Relic dam 1 m high looks like barrier<br />
Comments<br />
saw rainbow trout fry in riffle 5 cm<br />
water depth ‐ no flow<br />
gravels on inside of meander bend<br />
and tail out of larger pool redds<br />
present
Location Habitat Unit Substrate<br />
76 1.42‐1.49 Pool/Glide fines<br />
Spawning<br />
area m²<br />
77 1.49‐1.62 Cobble Riffle Large and small cobble<br />
78 1.62‐1.67 Pool/Glide fines<br />
79 1.67‐1.69 Cobble Riffle Large and small cobble<br />
80 1.69‐1.72 Pool/Glide cobbles and fines<br />
81 1.72‐1.73 Cobble Riffle Large and small cobble<br />
82 1.73‐1.81 Pool/Glide fines braided area of channels<br />
83 1.81‐1.82 Cobble Riffle Large and small cobble<br />
Meandering silty channel with side channels<br />
84 1.82‐1.95 Pool/Glide and grassy banks<br />
End of survey 212<br />
Comments<br />
Saw fry so fish can get above beaver<br />
dam likely at high flows
Suite 1400 - 750 West Pender Street<br />
Vancouver, BC Canada V6C 2T8<br />
File No.:VA101-266/9-A.01<br />
Cont. No.:VA09-01164 Tel: 604.685.0543<br />
Fax: 604.685.0147<br />
www.knightpiesold.com<br />
August 18, <strong>20</strong>09<br />
Mr. Roderick Bell-Irving<br />
Manager, Environmental Assessment<br />
Taseko Mines Limited<br />
Suite 300 - 905 West Pender Street<br />
Vancouver, BC V6C 1L6<br />
Dear Rod,<br />
Re:<br />
Potential for Flow Losses in Fish Creek<br />
Concerns have been raised by various parties that a substantial amount of flow in Fish Creek may be<br />
going to ground and not resurfacing further downstream, thereby suggesting that the subsurface flows are<br />
instead being conveyed to neighbouring basins and water courses, most notably the Taseko River. This<br />
idea of a possible interbasin transfer of flows is based on some of the Fish Creek annual unit hydrograph<br />
plots presented in Appendix C of the <strong>Prosperity</strong> Project Hydrometeorology Report (Ref. No. VA101-<br />
00266/01-2, Dec. 3, <strong>20</strong>07), which indicate substantial differences in unit area flows for different points on<br />
Fish Creek. For example, Figure C9 (shown in Appendix A of this letter), which presents unit flows for<br />
1993 for Fish Creek stations H2, H3, and H4b, indicates that unit flows drop substantially between<br />
stations H2 and H3, and then only recover slightly between stations H3 and H4b, thereby demonstrating a<br />
net loss of unit flow between stations H2 and H4b. The locations of the stations, as well as other stations<br />
for which reasonable amounts of data are also available, are shown on Figure 1. The full descriptive<br />
names of these stations are as follows:<br />
• Station H17 - Fish Creek upstream of Fish Lake<br />
• Station H2 - Fish Creek at the outlet of Fish Lake<br />
• Station H3 - Fish Creek upstream of the ore body<br />
• Station H6 - Fish Creek downstream of the ore body, and<br />
• Station H4 - Fish Creek upstream of the Taseko River.<br />
Please note that stations on Figure 1 that have the same number but different letter suffix are essentially<br />
located in same place. The letter simply indicates that the gauge was re-installed at some point.<br />
In an effort to assess the validity of interbasin groundwater flow supposition, all the available hydrology<br />
data were carefully examined, and it has been concluded that the surface flow loss pattern suggested by<br />
Figure C9 is almost certainly an artifact of data error. This conclusion is based on the following<br />
information:<br />
1. A review of all the figures in Appendix C of the hydrometeorology report indicates that there are no<br />
consistent patterns of relative unit flows. In years 1992, 1994, 1996, and 1997 there appears to be a<br />
net gain of unit flow between stations H2 and H4b, while for years 1993 and 1998 there appears to be<br />
a net loss, and in 1995 the unit flow was reasonably constant (except for clearly anomalous flows in<br />
November and December).
2. A comparison of discharge measurements that were manually recorded at different locations on the<br />
same date also fails to indicate a consistent pattern of surface flow loss. The discharge<br />
measurements recorded in the 1990s are summarized in Table 1 and those recorded in the <strong>20</strong>00s<br />
are in Table 2. Corresponding plots of unit runoff trends are shown on Figures 2 and 3. When<br />
viewing these data please keep in mind that the <strong>20</strong>00 data are likely more accurate than the 1990<br />
data.<br />
The key points that come to mind when viewing these Tables and Figures are as follows:<br />
Table 1 and Figure 2 – The data are inconclusive. There does not appear to be any strong indication<br />
of a substantial loss of flow to ground that is available to feed a neighbouring basin.<br />
• H2 to H3 - There are no consistent trends. Stations H2 and H3 are located very close together<br />
and should have very similar unit runoff, as they appear to do on the dates corresponding to the<br />
largest measured flows (4/7/1992 and 5/13/1994). For the remaining three dates when flows are<br />
concurrently measured at both sites the measurements indicate that the unit runoff essentially<br />
doubles as one progresses downstream, which is physically impossible unless there was massive<br />
seepage from the lake that was surfacing immediately downstream of the outlet, which is very<br />
unlikely. This pattern is most likely an artifact of flow measurement error.<br />
• H3 to H6 - Once again the trends are not consistent. Two dates show a substantial decrease in<br />
flows, while the third date shows a minor increase. Overall, there appears to be a decrease in<br />
flows.<br />
• H6 to H4b - There are only two dates with concurrent measurements. In both instances there<br />
appears to be an increase in flows.<br />
Table 2 and Figure 3 - Overall, there appear to be higher unit flows at station H17b than at all stations<br />
downstream of Fish Lake, although trends between stations H17b and H6b appear to be confounded<br />
by the attenuating effect of the lake. There appears to be an increasing trend of unit flows between<br />
stations H6b and H4c. The latter pattern is generally consistent with the pattern detected in the 1990<br />
flow data.<br />
• H17b to H6b - Four dates indicate decreasing unit flows and three dates indicate increasing unit<br />
flows. The decreasing trends are substantially stronger and all occur in May, while the increasing<br />
trends all occur in <strong>June</strong>. This pattern is fairly consistent with the expected attenuating effect of<br />
Fish Lake.<br />
• H6b to H4c - There is generally a trend of increasing unit flows in <strong>20</strong>06, except during the very<br />
lowest flow periods when there appears to be a slight decreasing trend, although differences in<br />
the low flows are likely within the measurement error. In <strong>20</strong>07, flows at the two sites appear to be<br />
very similar.<br />
3. Figure 4 presents the unit runoff hydrographs for stations H17b, H6b, and H4c, for the most complete<br />
and reliable year of record available, which is <strong>20</strong>07. This figure suggests that annual unit flows are<br />
very similar at H6b and H4c, but that H17b has substantially higher runoff. This pattern is consistent<br />
with the higher average basin elevation of H17b and correspondingly the expected<br />
enhanced precipitation during the winter months and reduced evapotranspiration during the summer<br />
months.<br />
To conclude, there is no compelling hydrologic evidence to support the idea that Fish Creek is losing a<br />
substantial amount of surface flow to groundwater that is being conveyed to neighbouring drainages.<br />
2 of 3 VA09-01164<br />
August 18, <strong>20</strong>09
TABLE 1<br />
TASEKO MINES LIMITED<br />
PROSPERITY GOLD-COPPER PROJECT<br />
FISH CREEK MEASURED UNIT DISCHARGES (l/s/km 2 ) 1992-1996<br />
Date Year Month Day H2 H3 H6 H4b<br />
4/7/1992 1992 4 7 14.7 13.6 10.4<br />
4/8/1992 1992 4 8 10.4<br />
6/15/1992 1992 6 15 0.4 0.7<br />
6/16/1992 1992 6 16 0.8<br />
9/2/1992 1992 9 2 0.2<br />
9/2/1992 1992 9 2 0.1<br />
9/3/1992 1992 9 3 1.9<br />
10/17/1992 1992 10 17 0.0<br />
11/25/1992 1992 11 25 0.2<br />
2/1/1993 1993 2 1 0.1 0.0 0.1<br />
4/28/1993 1993 4 28 0.5 1.0 0.6<br />
5/1/1993 1993 5 1 1.8<br />
6/16/1993 1993 6 16 2.0<br />
6/19/1993 1993 6 19 1.3<br />
8/26/1993 1993 8 26 0.4 0.8<br />
8/27/1993 1993 8 27 1.4<br />
8/29/1993 1993 8 29 1.1<br />
5/13/1994 1994 5 13 12.5 12.2<br />
5/15/1994 1994 5 15 9.8 16.2<br />
8/22/1994 1994 8 22 0.0<br />
8/28/1994 1994 8 22 0.2<br />
8/31/1994 1994 8 31 0.9<br />
6/17/1995 1995 6 17 0.4<br />
6/19/1995 1995 6 19 1.1<br />
4/15/1996 1996 4 15 14.6<br />
4/17/1996 1996 4 17 18.8<br />
6/27/1996 1996 6 27 21.9<br />
7/8/1996 1996 7 8 4.2<br />
7/9/1996 1996 7 9 3.2 3.5<br />
10/4/1996 1996 10 4 0.2 0.3<br />
M:\1\01\00266\09\A\Data\Hydrology\Ratings_<strong>20</strong>06 - <strong>20</strong>08\Measured Flow compare\1990s flows\[Gaugings Compare - 1990_VM.xls]Tab 1 - Summary H2H3H6H4b<br />
Print Aug/18/09 14:51:51<br />
NOTE:<br />
1. DATASETS WITH CONCURRENT DISCHARGES AT TWO OR MORE SITES ARE INDICATED WITH SHADING.<br />
0 05AUG'09 ISSUED FOR LETTER VA09-01164 JGC CB JGC<br />
REV DATE DESCRIPTION PREP'D CHK'D APP'D
TABLE 2<br />
TASEKO MINES LIMITED<br />
PROSPERITY GOLD-COPPER PROJECT<br />
FISH CREEK MEASURED UNIT DISCHARGES (l/s/km 2 ) <strong>20</strong>06-<strong>20</strong>08<br />
Date Year Month Day H17b H6b H4c<br />
5/9/<strong>20</strong>06 <strong>20</strong>06 5 9 4.1<br />
5/9/<strong>20</strong>06 <strong>20</strong>06 5 9 4.0<br />
5/10/<strong>20</strong>06 <strong>20</strong>06 5 10 3.1<br />
5/10/<strong>20</strong>06 <strong>20</strong>06 5 10 3.3<br />
5/23/<strong>20</strong>06 <strong>20</strong>06 5 23 1.8 1.1 2.0<br />
5/23/<strong>20</strong>06 <strong>20</strong>06 5 23 1.9 1.1 1.9<br />
6/6/<strong>20</strong>06 <strong>20</strong>06 6 6 3.2<br />
6/6/<strong>20</strong>06 <strong>20</strong>06 6 6 3.6<br />
6/7/<strong>20</strong>06 <strong>20</strong>06 6 7 2.6 3.2<br />
6/7/<strong>20</strong>06 <strong>20</strong>06 6 7 2.6 3.0<br />
6/<strong>20</strong>/<strong>20</strong>06 <strong>20</strong>06 6 <strong>20</strong> 2.3 0.9 1.6<br />
6/<strong>20</strong>/<strong>20</strong>06 <strong>20</strong>06 6 <strong>20</strong> 2.3 0.8 1.5<br />
7/4/<strong>20</strong>06 <strong>20</strong>06 7 4 0.0<br />
7/5/<strong>20</strong>06 <strong>20</strong>06 7 5 0.2 0.1<br />
7/5/<strong>20</strong>06 <strong>20</strong>06 7 5 0.1<br />
7/18/<strong>20</strong>06 <strong>20</strong>06 7 18 0.1 0.0<br />
7/18/<strong>20</strong>06 <strong>20</strong>06 7 18 0.1 0.0<br />
10/2/<strong>20</strong>06 <strong>20</strong>06 10 2 0.0 0.0<br />
10/2/<strong>20</strong>06 <strong>20</strong>06 10 2 0.0 0.0<br />
10/17/<strong>20</strong>06 <strong>20</strong>06 10 17 0.0<br />
5/14/<strong>20</strong>07 <strong>20</strong>07 5 14 42.1 36.6 37.4<br />
5/14/<strong>20</strong>07 <strong>20</strong>07 5 14 45.3 36.3 35.4<br />
5/14/<strong>20</strong>07 <strong>20</strong>07 5 14 35.2<br />
5/14/<strong>20</strong>07 <strong>20</strong>07 5 14 31.9<br />
5/31/<strong>20</strong>07 <strong>20</strong>07 5 31 10.2 8.4 10.0<br />
5/31/<strong>20</strong>07 <strong>20</strong>07 5 31 10.7 9.3 10.3<br />
6/14/<strong>20</strong>07 <strong>20</strong>07 6 14 7.1 8.3 8.3<br />
6/14/<strong>20</strong>07 <strong>20</strong>07 6 14 6.9 8.2 7.8<br />
6/25/<strong>20</strong>07 <strong>20</strong>07 6 25 3.2 3.3<br />
6/25/<strong>20</strong>07 <strong>20</strong>07 6 25 3.1 3.7<br />
6/26/<strong>20</strong>07 <strong>20</strong>07 6 26 3.14<br />
6/26/<strong>20</strong>07 <strong>20</strong>07 6 26 3.13<br />
11/15/<strong>20</strong>07 <strong>20</strong>07 11 15 0.54<br />
9/19/<strong>20</strong>08 <strong>20</strong>08 9 19 0.02<br />
M:\1\01\00266\09\A\Data\Hydrology\Ratings_<strong>20</strong>06 - <strong>20</strong>08\Measured Flow compare\<strong>20</strong>00s flows\[Gaugings Compare - <strong>20</strong>00s.xls]Tab 2 - Summary H17b H6B H4C<br />
Print Aug/18/09 14:51:51<br />
NOTE:<br />
1. DATASETS WITH CONCURRENT DISCHARGES AT TWO OR MORE SITES ARE INDICATED WITH SHADING.<br />
0 05AUG'09 ISSUED FOR LETTER VA09-01164 JGC CB JGC<br />
REV DATE DESCRIPTION PREP'D CHK'D APP'D
M:\1\01\00266\09\A\Data\Hydrology\Ratings_<strong>20</strong>06 - <strong>20</strong>08\Measured Flow compare\1990s flows\/Gaugings Compare - 1990_VM/Figure 2<br />
8/18/<strong>20</strong>09 2:56 PM<br />
18<br />
Flow Measurement - Unit Discharge (l/s/km 2 )<br />
16<br />
14<br />
12<br />
10<br />
8<br />
6<br />
4<br />
2<br />
0<br />
4/7/1992<br />
5/13/1994<br />
4/28/1993<br />
6/15/1992<br />
8/26/1993<br />
2/1/1993<br />
7/9/1996<br />
5/15/1994<br />
H2 H3 H6 H4b<br />
Gauging Station<br />
TASEKO MINES LTD.<br />
NOTES:<br />
1. COMPARATIVE PLOTS ARE PROVIDED FOR DISCHARGE VALUES MEASURED ON THE SAME DAY. MEASUREMENTS AT<br />
DIFFERENT LOCATIONS WERE NOT TAKEN AT IDENTICAL TIMES, SO SOME OF THE DIFFERENCES IN THE UNIT RUNOFF<br />
VALUES MAY BE ATTRIBUTED TO DAILY FLUCTUATIONS IN THE STREAMFLOW PATTERNS.<br />
H2 - Fish Creek at outlet of Fish Lake<br />
H3 - Fish Creek upstream of the orebody<br />
H6 - Fish Creek downstream of the orebody<br />
H4b - Fish Creek near the Taseko River<br />
PROSPERITY GOLD-COPPER PROJECT<br />
UNIT RUNOFF IN FISH CREEK<br />
MOVING DOWNSTREAM FROM H2 to H3 to H6 to H4b<br />
1992-1996 MEASUREMENTS<br />
0 01AUG'09 ISSUED FOR LETTER JGC CB JGC<br />
REV DATE DESCRIPTION PREP'D CHK'D APP'D<br />
P/A NO.<br />
VA101-266/9<br />
FIGURE 2<br />
REF NO.<br />
VA09-01164<br />
REV<br />
0
M:\1\01\00266\09\A\Data\Hydrology\Ratings_<strong>20</strong>06 - <strong>20</strong>08\Measured Flow compare\<strong>20</strong>00s flows\/Gaugings Compare - <strong>20</strong>00s/Figure 3<br />
8/18/<strong>20</strong>09 2:52 PM<br />
45<br />
5/14/<strong>20</strong>07<br />
40<br />
Flow Measurement - Unit Discharge (l/s/km 2 )<br />
35<br />
30<br />
25<br />
<strong>20</strong><br />
15<br />
10<br />
5/31/<strong>20</strong>07<br />
H17 - Fish Creek upstream of Fish Lake<br />
H6b - Fish Creek downstream of the orebody<br />
H4c - Fish Creek near the Taseko River<br />
5<br />
0<br />
6/25/<strong>20</strong>07<br />
6/7/<strong>20</strong>06<br />
6/<strong>20</strong>/<strong>20</strong>06<br />
5/23/<strong>20</strong>06<br />
6/14/<strong>20</strong>07<br />
H17b H6b H4c<br />
Gauging Station<br />
TASEKO MINES LTD.<br />
10/2/<strong>20</strong>06<br />
7/18/<strong>20</strong>06<br />
7/5/<strong>20</strong>06<br />
NOTES:<br />
1. COMPARATIVE PLOTS ARE PROVIDED FOR DISCHARGE VALUES MEASURED ON THE SAME DAY.<br />
MEASUREMENTS AT DIFFERENT LOCATIONS WERE NOT TAKEN AT IDENTICAL TIMES, SO SOME OF THE<br />
DIFFERENCES IN THE UNIT RUNOFF VALUES MAY BE ATTRIBUTED TO DAILY FLUCTUATIONS IN THE<br />
STREAMFLOW PATTERNS.<br />
PROSPERITY GOLD-COPPER PROJECT<br />
UNIT RUNOFF IN FISH CREEK<br />
MOVING DOWNSTREAM FROM H17b to H6b to H4c<br />
<strong>20</strong>06-<strong>20</strong>08 MEASUREMENTS<br />
P/A NO.<br />
VA101-266/9<br />
REF NO.<br />
VA09-01164<br />
0 01AUG'09 ISSUED FOR LETTER JGC CB JGC<br />
REV DATE DESCRIPTION PREP'D CHK'D APP'D<br />
FIGURE 3<br />
REV<br />
0
M:\1\01\00266\09\A\Data\Hydrology\Ratings_<strong>20</strong>06 - <strong>20</strong>08\Unit Runoff Comparison Chart\Unit Runoff Comparison Chart.xls<br />
Print 8/18/<strong>20</strong>09 2:53 PM<br />
80<br />
Station H17b<br />
70<br />
Station H6b<br />
Station H4c<br />
60<br />
Unit Runoff (l/s/km 2 )<br />
50<br />
40<br />
30<br />
<strong>20</strong><br />
10<br />
0<br />
03/09/07 04/28/07 06/17/07 08/06/07 09/25/07 11/14/07 01/03/08<br />
TASEKO MINES LTD.<br />
PROSPERITY PROJECT<br />
<strong>20</strong>07 UNIT RUNOFF HYDROGRAPH<br />
H17B, H6B & H4C<br />
0 AUG06'09 ISSUED FOR LETTER CMB JGC JGC<br />
REV DATE DESCRIPTION PREP'D CHK'D APP'D<br />
P/A NO.<br />
VA101-266/9<br />
FIGURE 4<br />
REF. NO.<br />
VA09-01164<br />
REV<br />
0
APPENDIX A<br />
FIGURE C9 – MEAN MONTHLY UNIT HYDROGRAPHS:<br />
FISH CREEK (H2, H3 & H4B) VS. BIG CREEK (08MB006)<br />
(1 Page)<br />
VA09-01164<br />
August 18, <strong>20</strong>09
M:\1\01\00266\01\A\Data\EA <strong>20</strong>07\Hydrology\KP <strong>20</strong>07 Hydromet Report\[App C plots (1).xls]Fig C9<br />
Print 8/18/<strong>20</strong>09 1:45 PM<br />
Rev'd April 19/07<br />
30<br />
H2<br />
25<br />
H3<br />
H4b<br />
08MB006<br />
<strong>20</strong><br />
Unit Flow (l/s/km2)<br />
15<br />
10<br />
5<br />
0<br />
January February March April May <strong>June</strong> July August September October November December<br />
Year - 1993<br />
TASEKO MINES LIMITED<br />
PROSPERITY GOLD-COPPER PROJECT<br />
MEAN MONTHLY UNIT HYDROGRAPHS<br />
FISH CREEK (H2, H3 & H4b) vs. BIG CREEK (08MB006)<br />
Rev A - Issued in <strong>Dr</strong>aft<br />
Knight Piésold<br />
C O N S U L T I N G<br />
PROJECT / ASSIGNMENT NO.<br />
VA101-266/1<br />
FIGURE C9<br />
REF NO.<br />
2<br />
REV.<br />
A