Indoor Air Quality in School Classrooms with Mechanical Ventilation ...
Indoor Air Quality in School Classrooms with Mechanical Ventilation ...
Indoor Air Quality in School Classrooms with Mechanical Ventilation ...

Create successful ePaper yourself
Turn your PDF publications into a flip-book with our unique Google optimized e-Paper software.
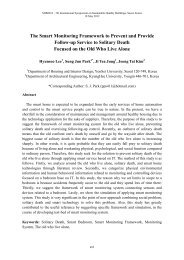
SHB2012 - 7th International Symposium on Susta<strong>in</strong>able Healthy Build<strong>in</strong>gs, Seoul, Korea<br />
18 May 2012<br />
<strong>Indoor</strong> <strong>Air</strong> <strong>Quality</strong> <strong>in</strong> <strong>School</strong> <strong>Classrooms</strong> <strong>with</strong> <strong>Mechanical</strong><br />
<strong>Ventilation</strong> Systems<br />
Jong Ryeul Sohn 1 , Hyeun Jun Moon 2* , Seung Ho Ryu 2 , Taeyon Hwang 3<br />
1 Department of Environmental Health, Korea University, Seoul 136-703, Korea<br />
2 Department of Architectural Eng<strong>in</strong>eer<strong>in</strong>g, Dankook University, Yong<strong>in</strong>, 448-701, Korea<br />
3 Technology Research Center, Samsung C&T Corporation, Seoul 137-857, Korea<br />
* Correspond<strong>in</strong>g author: H.J. Moon (hmoon@dankook.ac.kr)<br />
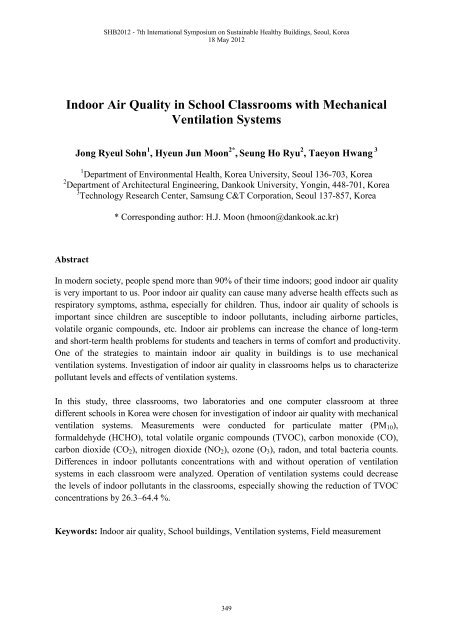
Abstract<br />
In modern society, people spend more than 90% of their time <strong>in</strong>doors; good <strong>in</strong>door air quality<br />
is very important to us. Poor <strong>in</strong>door air quality can cause many adverse health effects such as<br />
respiratory symptoms, asthma, especially for children. Thus, <strong>in</strong>door air quality of schools is<br />
important s<strong>in</strong>ce children are susceptible to <strong>in</strong>door pollutants, <strong>in</strong>clud<strong>in</strong>g airborne particles,<br />
volatile organic compounds, etc. <strong>Indoor</strong> air problems can <strong>in</strong>crease the chance of long-term<br />
and short-term health problems for students and teachers <strong>in</strong> terms of comfort and productivity.<br />
One of the strategies to ma<strong>in</strong>ta<strong>in</strong> <strong>in</strong>door air quality <strong>in</strong> build<strong>in</strong>gs is to use mechanical<br />
ventilation systems. Investigation of <strong>in</strong>door air quality <strong>in</strong> classrooms helps us to characterize<br />
pollutant levels and effects of ventilation systems.<br />
In this study, three classrooms, two laboratories and one computer classroom at three<br />
different schools <strong>in</strong> Korea were chosen for <strong>in</strong>vestigation of <strong>in</strong>door air quality <strong>with</strong> mechanical<br />
ventilation systems. Measurements were conducted for particulate matter (PM 10 ),<br />
formaldehyde (HCHO), total volatile organic compounds (TVOC), carbon monoxide (CO),<br />
carbon dioxide (CO 2 ), nitrogen dioxide (NO 2 ), ozone (O 3 ), radon, and total bacteria counts.<br />
Differences <strong>in</strong> <strong>in</strong>door pollutants concentrations <strong>with</strong> and <strong>with</strong>out operation of ventilation<br />
systems <strong>in</strong> each classroom were analyzed. Operation of ventilation systems could decrease<br />
the levels of <strong>in</strong>door pollutants <strong>in</strong> the classrooms, especially show<strong>in</strong>g the reduction of TVOC<br />
concentrations by 26.3–64.4 %.<br />
Keywords: <strong>Indoor</strong> air quality, <strong>School</strong> build<strong>in</strong>gs, <strong>Ventilation</strong> systems, Field measurement<br />
349
SHB2012 - 7th International Symposium on Susta<strong>in</strong>able Healthy Build<strong>in</strong>gs, Seoul, Korea<br />
18 May 2012<br />
1. Introduction<br />
In modern society, people spend more than 90% of their time <strong>in</strong>doors; good <strong>in</strong>door air quality<br />
is very important to us [1]. Poor <strong>in</strong>door air quality can cause many adverse health effects such<br />
as respiratory symptoms, asthma [2-4]. <strong>School</strong> children spend about 6–8h per weekday <strong>in</strong><br />
classrooms, which is the second most time-spent <strong>in</strong>door environment after homes [5].<br />
Moreover children are more susceptible to <strong>in</strong>door pollutants, <strong>in</strong>clud<strong>in</strong>g airborne particles,<br />
volatile organic compounds s<strong>in</strong>ce their organs are <strong>in</strong> develop<strong>in</strong>g stage and they breathe more<br />
air relative to their body size than adults [6, 7]. Thus, good <strong>in</strong>door air quality should be<br />
ma<strong>in</strong>ta<strong>in</strong>ed <strong>in</strong> schools for children’s health. Several studies have reported that the <strong>in</strong>door air<br />
problems can <strong>in</strong>crease the chance of long-term and short-term health problems for students<br />
and teachers <strong>in</strong> terms of comfort and productivity [8-10].<br />
Several studies have been conducted dur<strong>in</strong>g the past decades to <strong>in</strong>vestigate the <strong>in</strong>door air<br />
quality <strong>in</strong> school classrooms. Chitra and Nagendra [5] have <strong>in</strong>vestigated <strong>in</strong>door air quality<br />
parameters <strong>in</strong> a naturally ventilated school build<strong>in</strong>g located near an urban roadway <strong>in</strong> India.<br />
This study reported that the mean value of <strong>in</strong>door PM 10 , PM 2.5 , PM 1 and CO concentrations<br />
were found to be 149 ± 69, 61 ± 29, 43 ± 24, 0.10 ± 0.18 and 95 ± 61, 32 ± 16, 18 ± 9 µg/m 3 ,<br />
0.11 ± 0.14 ppm, respectively for w<strong>in</strong>ter and summer seasons. Norback et al. [11] have<br />
studied the relationship between VOCs, respirable dust, and personal factors to prevalence<br />
and <strong>in</strong>cidence of sick build<strong>in</strong>g syndrome <strong>in</strong> six primary schools. They reported that the<br />
average CO 2 concentrations <strong>in</strong> all sites were greater than 800 ppm and <strong>in</strong>dicated <strong>in</strong>adequate<br />
ventilation. Lee and Chang [12] <strong>in</strong>vestigated IAQ of five classrooms <strong>in</strong> Hong Kong. This<br />
study showed that the average respirable suspended particulate matter (RSPM) concentrations<br />
were higher than the Hong Kong air quality objective (annual average, 55 µg/m 3 ) and the<br />
maximum <strong>in</strong>door PM 10 level exceeded 1000 µg/m 3 . Yang et al. [13] characterized the<br />
concentrations of different <strong>in</strong>door air pollutants <strong>with</strong><strong>in</strong> Korean schools and to compare their<br />
<strong>in</strong>door levels <strong>with</strong><strong>in</strong> schools accord<strong>in</strong>g to the age of school build<strong>in</strong>gs. The I/O ratio for<br />
HCHO was 6.32 dur<strong>in</strong>g the autumn, and the <strong>in</strong>door HCHO concentrations (mean=0.16 ppm)<br />
<strong>in</strong> schools constructed <strong>with</strong><strong>in</strong> 1 year were significantly higher than the Korean <strong>Indoor</strong> <strong>Air</strong><br />
Standard, <strong>in</strong>dicat<strong>in</strong>g that schools have <strong>in</strong>door sources of HCHO. Fromme et al. [14] evaluated<br />
<strong>in</strong>door air quality <strong>in</strong> 64 schools <strong>in</strong> the city of Munich and a neighbor<strong>in</strong>g district outside the<br />
city boundary. They reported that the median <strong>in</strong>door CO 2 concentration <strong>in</strong> a classroom was<br />
1603 ppm <strong>in</strong> w<strong>in</strong>ter and 405 ppm <strong>in</strong> summer. A median PM 2.5 concentrations of 19.8 µg/m 3<br />
and PM 10 =91.5 µg/m 3 were observed dur<strong>in</strong>g w<strong>in</strong>ter period. In summer, a reduced PM<br />
concentrations were reported (median PM 2.5 =12.7 µg/m 3 , median PM 10 =64.9 µg/m 3 ).<br />
One of the strategies to ma<strong>in</strong>ta<strong>in</strong> good <strong>in</strong>door air quality <strong>in</strong> build<strong>in</strong>gs is to use mechanical<br />
ventilation systems. Adequate ventilation systems should not only provide thermal comfort<br />
but also distribute fresh air to occupants and remove pollutants. This study aims to <strong>in</strong>vestigate<br />
the <strong>in</strong>door pollutant levels <strong>in</strong> school classrooms accord<strong>in</strong>g to the operation of mechanical<br />
ventilation system. Differences <strong>in</strong> <strong>in</strong>door pollutants concentrations <strong>with</strong> and <strong>with</strong>out<br />
operation of mechanical ventilation systems <strong>in</strong> each classroom are analyzed. Investigation of<br />
<strong>in</strong>door air quality <strong>in</strong> classrooms helps us to characterize pollutant levels and effects of<br />
ventilation systems.<br />
350
SHB2012 - 7th International Symposium on Susta<strong>in</strong>able Healthy Build<strong>in</strong>gs, Seoul, Korea<br />
18 May 2012<br />
2. Methodology<br />
2.1 Description of the selected school build<strong>in</strong>gs<br />
A field study was conducted <strong>in</strong> three classrooms, two laboratories and one computer room<br />
<strong>with</strong> mechanical ventilation systems <strong>in</strong> three different schools located <strong>in</strong> Seoul, Korea. Two<br />
schools of selected build<strong>in</strong>gs were newly constructed and the other school was constructed<br />
seven years ago. Detailed description of the selected school build<strong>in</strong>gs is shown <strong>in</strong> Table 1.<br />
Encased energy recovery ventilation systems were <strong>in</strong>stalled <strong>in</strong> all selected classrooms, as<br />
shown Figure 1. The measurements were taken <strong>in</strong> two different ventilation operation modes<br />
(before and after operation of ventilation system), <strong>with</strong> the aim of <strong>in</strong>vest<strong>in</strong>g the effect of<br />
ventilation system on the <strong>in</strong>door air pollutants concentrations.<br />
Table 1. Description of the selected school build<strong>in</strong>gs and classrooms<br />
Target build<strong>in</strong>gs Construction years Selected classrooms<br />
<strong>School</strong> A 7 years Classroom (AC1), Laboratory (AL1)<br />
<strong>School</strong> B<br />
Under 2 years<br />
Classroom (BC1), Classroom (BC2),<br />
Laboratory (BL1)<br />
<strong>School</strong> C Under 2 years Computer room (CP1)<br />
Fig 1. <strong>Ventilation</strong> systems <strong>in</strong> selected classrooms<br />
2.2 Measurement of the <strong>in</strong>door air pollutants<br />
One-day <strong>in</strong>door air quality <strong>in</strong>vestigations at each school were performed. The <strong>in</strong>door<br />
pollutants were monitored for particle matter (PM 10 ), Carbon monoxide (CO), Carbon<br />
dioxide (CO 2 ), Nitrogen dioxide (NO 2 ), Ozone (O 3 ), Radon (Rn), total bacteria count,<br />
Formaldehyde (HCHO) and Volatile Organic Compounds (VOCs). <strong>Indoor</strong> air temperature<br />
and relative humidity were also monitored dur<strong>in</strong>g the field measurement. Sampl<strong>in</strong>g<br />
equipment was placed at 1.5 m above floor level. The measur<strong>in</strong>g equipment and<br />
experimentation are presented <strong>in</strong> Figure 2.<br />
351
SHB2012 - 7th International Symposium on Susta<strong>in</strong>able Healthy Build<strong>in</strong>gs, Seoul, Korea<br />
18 May 2012<br />
Fig 2. <strong>Indoor</strong> air pollutants measurement <strong>in</strong> the selected school<br />
Measurement methods for each <strong>in</strong>door pollutant were referred to the <strong>in</strong>door air quality<br />
control <strong>in</strong> public use facilities, an act provided by the M<strong>in</strong>istry of Environment, Korea [15],<br />
as shown <strong>in</strong> Table 2. PM 10 samples were collected on a pall flex membrane filter us<strong>in</strong>g M<strong>in</strong>i<br />
Volume air sampler. CO and CO 2 were measured by means of a non-dispersive <strong>in</strong>frared<br />
(NDIR) analyzer (CO Analyzer 300E and CD 98 Plus). NO 2 was measured by means of a<br />
chemilum<strong>in</strong>escence analyzer (NO 2 Analyzer 200E). O 3 was measured by means of an<br />
ultraviolet photometric analyzer (O 3 Analyzer 400E). Radon was measured based on<br />
cont<strong>in</strong>uous radon monitor<strong>in</strong>g method us<strong>in</strong>g the RAD7. The sampl<strong>in</strong>g method employed for<br />
the total bacteria count was a MAS impactor, which used the centrifugal impaction pr<strong>in</strong>ciple.<br />
HCHO was collected by pull<strong>in</strong>g air through a 2,4-DNPH cartridge (MP-∑100). The DNPH-<br />
HCHO derivative eluted <strong>with</strong> acetonitrile was determ<strong>in</strong>ed by a reverse-phase highperformance<br />
liquid chromatography (HPLC). TVOCs’ samples were collected us<strong>in</strong>g Tenax-<br />
TA tubes, which were analyzed by gas chromatography <strong>with</strong> flame ionization detection and a<br />
modified thermal desorption cold trap <strong>in</strong>jector.<br />
Table 2. Ma<strong>in</strong> measurement method for <strong>in</strong>door pollutants <strong>in</strong> Korea standard [15]<br />
Pollutants<br />
Particle matter<br />
Carbon monoxide<br />
Carbon dioxide<br />
Nitrogen dioxide<br />
Ozone<br />
Radon<br />
Total bacteria count<br />
Formaldehyde<br />
Volatile organic compounds<br />
Measurement method<br />
M<strong>in</strong>i volume air sampl<strong>in</strong>g method<br />
Non-dispersive <strong>in</strong>frared method<br />
Non-dispersive <strong>in</strong>frared method<br />
Chemilum<strong>in</strong>escence method<br />
Ultraviolet photometric method<br />
Cont<strong>in</strong>uous monitor<strong>in</strong>g method<br />
Centrifugal impaction method<br />
2,4-DNPH cartridge method<br />
Solid phase adsorption thermal desorption method<br />
352
SHB2012 - 7th International Symposium on Susta<strong>in</strong>able Healthy Build<strong>in</strong>gs, Seoul, Korea<br />
18 May 2012<br />
3. Results and discussions<br />
3.1 <strong>Indoor</strong> air quality <strong>in</strong> school A accord<strong>in</strong>g to ventilation mode<br />
A field study <strong>in</strong> school A was conducted <strong>in</strong> a class room (AC1) and a laboratory (AL1).<br />
<strong>Indoor</strong> air pollutants levels <strong>in</strong> AC1 were monitored while the classroom was unoccupied.<br />
<strong>Indoor</strong> air pollutants levels <strong>in</strong> AL1 were monitored while the 30 students were sitt<strong>in</strong>g <strong>in</strong> AL1.<br />
The measurements were conducted before and after the operation of ventilation system while<br />
an air-conditioner system was not operated. Table 3 shows the level of <strong>in</strong>door air pollutants<br />
measured at school A accord<strong>in</strong>g to operation of mechanical ventilation system.<br />
T<br />
(°C)<br />
RH<br />
(%)<br />
PM 10<br />
(µg/m 3 )<br />
CO<br />
(ppm)<br />
CO 2<br />
(ppm)<br />
NO 2<br />
(ppb)<br />
O 3<br />
Table 3. Concentrations of <strong>in</strong>door air pollutants measured <strong>in</strong> AC1 and AL1<br />
AC1 AL1<br />
Standard * Before the After the Before the After the<br />
operation of vent. operation of vent. operation of vent. operation of vent.<br />
– 23.2 22.5 25.0 24.6<br />
– 34.5 31.1 36.8 35.3<br />
100 33.3 16.7 88.0 41.7<br />
10 0.03 0.03 0.10 0.10<br />
1000 519 467 527 475<br />
50 26.5 23.7 26.9 24.0<br />
(ppb)<br />
60 N.D. ** N.D. N.D. N.D.<br />
Rn<br />
(pCi/l)<br />
4.0 0.5 0.3 0.1 0.2<br />
TBC<br />
(CFU/m 3 )<br />
800 150 40 200 170<br />
HCHO<br />
(µg/m 3 )<br />
100 52.8 19.9 80.2 30.2<br />
TVOC<br />
(µg/m 3 )<br />
400 189.4 101.4 831.7 295.7<br />
*<br />
Korean <strong>Indoor</strong> <strong>Air</strong> Standard (KIAS) [15]<br />
**<br />
Not detected<br />
3.2 <strong>Indoor</strong> air quality <strong>in</strong> school B accord<strong>in</strong>g to ventilation mode<br />
A field study <strong>in</strong> school B was conducted <strong>in</strong> two classrooms (BC1 and BC2) and a laboratory<br />
(BL1). <strong>Indoor</strong> air pollutants levels <strong>in</strong> BC1, BC2 and BL1 were monitored while the<br />
classroom was unoccupied. The measurements <strong>in</strong> BC1 and BC2 were conducted before and<br />
after the operation of ventilation system while air-conditioner system was turned on. The<br />
measurements <strong>in</strong> BL1 were conducted before and after the operation of ventilation system<br />
353
SHB2012 - 7th International Symposium on Susta<strong>in</strong>able Healthy Build<strong>in</strong>gs, Seoul, Korea<br />
18 May 2012<br />
while air-conditioner system did not operated. In case of the school B, measurement of the<br />
<strong>in</strong>door pollutants were focused on particle matter (PM 10 ), carbon dioxide (CO 2 ),<br />
formaldehyde (HCHO) and volatile organic compounds (VOCs) exclud<strong>in</strong>g other pollutants<br />
s<strong>in</strong>ce other pollutants were measured significantly lower from pre-test. Table 4–6 show the<br />
level of <strong>in</strong>door air pollutants measured at school B accord<strong>in</strong>g to operation of mechanical<br />
ventilation system.<br />
Table 4. Concentrations of <strong>in</strong>door air pollutants measured <strong>in</strong> BC1<br />
Standard<br />
BC1<br />
Before the operation of vent. After the operation of vent.<br />
T (°C) – 21.7 21.8<br />
RH (%) – 30.9 26.3<br />
PM 10 (µg/m 3 ) 100 75.7 65.2<br />
CO 2 (ppm) 1000 470 350<br />
HCHO (µg/m 3 ) 100 43.0 34.0<br />
TVOC (µg/m 3 ) 400 360.0 205.5<br />
Table 5. Concentrations of <strong>in</strong>door air pollutants measured <strong>in</strong> BC2<br />
Standard<br />
BC2<br />
Before the operation of vent. After the operation of vent.<br />
T (°C) – 23.2 22.3<br />
RH (%) – 24.1 15.7<br />
PM 10 (µg/m 3 ) 100 87.5 25.0<br />
CO 2 (ppm) 1000 510 360<br />
HCHO (µg/m 3 ) 100 32.7 27.7<br />
TVOC (µg/m 3 ) 400 259.4 191.3<br />
Table 6. Concentrations of <strong>in</strong>door air pollutants measured <strong>in</strong> BL1<br />
Standard<br />
BL1<br />
Before the operation of vent. After the operation of vent.<br />
T (°C) – 12.9 10.2<br />
RH (%) – 39.6 32.1<br />
PM 10 (µg/m 3 ) 100 90.1 59.7<br />
CO 2 (ppm) 1000 600 410<br />
HCHO (µg/m 3 ) 100 60.4 42.1<br />
TVOC (µg/m 3 ) 400 320.0 203.9<br />
3.3 <strong>Indoor</strong> air quality <strong>in</strong> school C accord<strong>in</strong>g to ventilation mode<br />
A field study <strong>in</strong> school C was conducted <strong>in</strong> a computer room (CP1). <strong>Indoor</strong> air pollutants<br />
levels <strong>in</strong> CP1 were calculated us<strong>in</strong>g data obta<strong>in</strong>ed while the 20 students were sitt<strong>in</strong>g <strong>in</strong> the<br />
CP1. The measurements were conducted before and after the operation of ventilation system<br />
while air-conditioner system was turned on. In case of the CP1, measurement of the <strong>in</strong>door<br />
pollutants were focused on particle matter (PM 10 ), carbon dioxide (CO 2 ), formaldehyde<br />
354
SHB2012 - 7th International Symposium on Susta<strong>in</strong>able Healthy Build<strong>in</strong>gs, Seoul, Korea<br />
18 May 2012<br />
(HCHO) and volatile organic compounds (VOCs). Table 7 shows the level of <strong>in</strong>door air<br />
pollutants measured at school C accord<strong>in</strong>g to operation of mechanical ventilation system.<br />
Table 7. Concentrations of <strong>in</strong>door air pollutants measured <strong>in</strong> CP1<br />
Standard<br />
CP1<br />
Before the operation of vent. After the operation of vent.<br />
T (°C) – 23.6 23.4<br />
RH (%) – 23.9 20.7<br />
PM 10 (µg/m 3 ) 100 85.9 59.2<br />
CO 2 (ppm) 1000 660 450<br />
HCHO (µg/m 3 ) 100 48.3 40.7<br />
TVOC (µg/m 3 ) 400 123.5 56.0<br />
3.4 <strong>Indoor</strong> air pollutants levels by operation of the mechanical ventilation system<br />
Our results clearly showed that <strong>in</strong>door air pollutants’ level after operation of the ventilation<br />
system were lower than before operation of the ventilation system, as shown <strong>in</strong> Figure 3. These<br />
results could be expla<strong>in</strong>ed by the adequate ventilation by means of a mechanical ventilation<br />
system. The mean of decreas<strong>in</strong>g rates of <strong>in</strong>door PM 10 concentrations were 51.2 %, 39.7 % and<br />
31.1 % <strong>in</strong> the school A, school B and school C, respectively.<br />
Fig 3. PM 10 , CO 2 , HCHO and TVOC concentrations <strong>in</strong> classrooms accord<strong>in</strong>g to operation of<br />
the mechanical ventilation system<br />
The mean of decreas<strong>in</strong>g rates of <strong>in</strong>door CO 2 concentrations were 9.9 %, 28.9 % and 31.8 % <strong>in</strong><br />
the school A, school B and school C, respectively. The mean of decreas<strong>in</strong>g rates of <strong>in</strong>door<br />
HCHO concentrations were 62.3 %, 22.2 % and 15.7 % <strong>in</strong> the school A, school B and school C,<br />
355
SHB2012 - 7th International Symposium on Susta<strong>in</strong>able Healthy Build<strong>in</strong>gs, Seoul, Korea<br />
18 May 2012<br />
respectively. The mean of decreas<strong>in</strong>g rates of <strong>in</strong>door TVOC concentrations were 55.5 %, 35.2 %<br />
and 54.7 % <strong>in</strong> the school A, school B and school C, respectively. There were slight differences<br />
between the decreas<strong>in</strong>g rates of each school build<strong>in</strong>gs. An explanation might be the difference of<br />
mechanical system <strong>in</strong> each school build<strong>in</strong>gs, number of occupants, operation of air-conditioners<br />
and location of diffusers. The efficiencies of the ventilation systems <strong>in</strong> the classrooms are<br />
discussed a separate paper.<br />
The <strong>in</strong>door air concentrations of all measured pollutants after operation of ventilation system<br />
<strong>in</strong> the selected school build<strong>in</strong>gs complied <strong>with</strong> the Korean <strong>Indoor</strong> <strong>Air</strong> Standard, although<br />
measurements were conducted for one-day only. The mean of the PM 10 were 51.2, 39.7 and<br />
31.1 µg/m 3 <strong>in</strong> the school A, B and C, respectively. The mean of the CO 2 were 417, 373 and<br />
450 ppm <strong>in</strong> the school A, B and C, respectively. The mean of the HCHO were 25.1, 34.6 and<br />
40.7 µg/m 3 <strong>in</strong> the school A, B and C, respectively. The mean of the TVOC were 198.6, 200.2<br />
and 56.0 µg/m 3 <strong>in</strong> the school A, B and C, respectively.<br />
4. Conclusions<br />
The <strong>in</strong>door air quality parameters (PM 10 , CO, CO 2 , NO 2 , O 3 , Rn, TBC, HCHO and TVOC)<br />
were measured <strong>in</strong> three different schools <strong>with</strong> mechanical ventilation system. The results had<br />
shown remarkable difference <strong>in</strong> <strong>in</strong>door air pollutants’ level accord<strong>in</strong>g to the operation of<br />
mechanical ventilation system. Operation of ventilation systems could decrease the levels of<br />
<strong>in</strong>door pollutants <strong>in</strong> the all selected classrooms. The mean of concentrations and decreas<strong>in</strong>g<br />
rates of <strong>in</strong>door PM 10 were 44.6 µg/m 3 and 41.2 % <strong>in</strong> the selected schools, respectively. The<br />
mean of concentrations and decreas<strong>in</strong>g rates of <strong>in</strong>door CO 2 were 418.7 ppm and 23.1 % <strong>in</strong> the<br />
selected schools, respectively. The mean of concentrations and decreas<strong>in</strong>g rates of <strong>in</strong>door<br />
HCHO were 32.4 µg/m 3 and 34.5 % <strong>in</strong> selected schools, respectively. The mean of<br />
concentrations and decreas<strong>in</strong>g rates of <strong>in</strong>door TVOC was 175.6 µg/m 3 and 45.2 % <strong>in</strong> the<br />
selected schools, respectively. Therefore, <strong>in</strong>creas<strong>in</strong>g the ventilation rate by means of a<br />
mechanical ventilation system can play key roles <strong>in</strong> improv<strong>in</strong>g the <strong>in</strong>door air quality <strong>with</strong><strong>in</strong><br />
schools.<br />
Acknowledgements<br />
This work was supported by the National Research Foundation of Korea (NRF) grant funded<br />
by the Korea government (MEST) (No. 2012-0000609).<br />
This research was supported by the Converg<strong>in</strong>g Research Center Program funded by the<br />
M<strong>in</strong>istry of Education, Science and Technology (2011K000761).<br />
References<br />
[1] Klepeis NE, Nelson WC, Ott WR, Rob<strong>in</strong>son JP, Tsang AM, Switzer P, Behar JV, Hern<br />
SC, Engelmann WH: The national human activity pattern survey (NHAPS): a resource for<br />
assess<strong>in</strong>g exposure to environmental pollutants: Journal of Exposure Analysis and<br />
Environmental Epidemiology 2001;11:231–252.<br />
356
SHB2012 - 7th International Symposium on Susta<strong>in</strong>able Healthy Build<strong>in</strong>gs, Seoul, Korea<br />
18 May 2012<br />
[2] Mi Y-H, Norback D, Tao J, Mi Y-L, Ferm M: Current asthma and respiratory symptoms<br />
among pupils <strong>in</strong> Shanghai, Ch<strong>in</strong>a: <strong>in</strong>fluence of build<strong>in</strong>g ventilation, nitrogen dioxide, ozone,<br />
and formaldehyde <strong>in</strong> classrooms: <strong>Indoor</strong> <strong>Air</strong> 2006;16:454–464.<br />
[3] Flannigan B, McCabe E, McGarry F: Allergic and toxigenic microorganisms <strong>in</strong> houses: J<br />
Appl Bacteriol 1991;70:61–73.<br />
[4] Johann<strong>in</strong>g E, Landsbergis P, Gereis M, Yang CS, Olmsted E: Cl<strong>in</strong>ical experience and<br />
results of a sent<strong>in</strong>el health <strong>in</strong>vestigation related to <strong>in</strong>door fungal exposure: Environ Health<br />
Persp 1999;107:489–494.<br />
[5] Chithra VS, Nagendra S: <strong>Indoor</strong> air quality <strong>in</strong>vestigations <strong>in</strong> a naturally ventilated school<br />
build<strong>in</strong>g located close to an urban roadway <strong>in</strong> Chennai, India: Build<strong>in</strong>g and Environment<br />
2012;54:159–167.<br />
[6] Faustman EM, Silbernagel SM, Fenske RA, Burbacher TM, Ponce RA: Mechanisms<br />
underly<strong>in</strong>g children’s susceptibility to environmental toxicants: Environ Health Perspect<br />
2000;108(S1):13–21.<br />
[7] Mendell JM, Health GA: Do <strong>in</strong>door pollutants and thermal conditions <strong>in</strong> schools <strong>in</strong>fluence<br />
student performance? A critical review of the literature: <strong>Indoor</strong> <strong>Air</strong> 2005;15:27–52.<br />
[8] Dijken FV, Bronswijk JV, Sundell J: <strong>Indoor</strong> environment <strong>in</strong> Dutch primary schools and<br />
health of the pupils: <strong>in</strong> Proceed<strong>in</strong>gs of <strong>in</strong>door air 2005, Beij<strong>in</strong>g, Ch<strong>in</strong>a, 2005;1:623–627.<br />
[9] Myhrvold AN, Olsen E, Lauridsen O: <strong>Indoor</strong> environment <strong>in</strong> schools-pupils health and<br />
performance <strong>in</strong> regard to CO2 concentrations: <strong>in</strong> Proceed<strong>in</strong>gs of seventh <strong>in</strong>ternational<br />
conference on <strong>in</strong>door air quality and climate, Nagoya, Japan, July 1996;4:369–374.<br />
[10] Wargocki P, Wyon DP, Matysiak B, Irgens S: The effects of classroom air temperature<br />
and outdoor air supply rate on the performance of school work by children: <strong>in</strong> Proceed<strong>in</strong>gs of<br />
<strong>in</strong>door air 2005, Beij<strong>in</strong>g, 2005;1:368–372.<br />
[11] Norback D, Torgen M, Edl<strong>in</strong>g C: Volatile organic compounds, respirable dust and<br />
personal factors related to prevalence and <strong>in</strong>cidence of sick build<strong>in</strong>g syndrome <strong>in</strong> primary<br />
schools: Br J Ind Med 1990;47:733–741.<br />
[12] Lee SC, Chang M: <strong>Indoor</strong> and outdoor air quality <strong>in</strong>vestigation at schools <strong>in</strong> Hong Kong:<br />
Chemosphere 2000;41:109–113.<br />
[13] Yang WH, Shon JR, Kim JH, Son BS, Park JC: <strong>Indoor</strong> air quality <strong>in</strong>vestigat<strong>in</strong> accord<strong>in</strong>g<br />
to age of the school build<strong>in</strong>gs <strong>in</strong> Korea: J Environmental Management 2009:90;348–354.<br />
[14] Fromme H, Twardella D, Dietrich S, Heitmann D, Schierl R, Liebl B: Particulate matter<br />
<strong>in</strong> the <strong>in</strong>door air of classrooms-exploratory results from Munich and surround<strong>in</strong>g area: Atmos<br />
Environ 2007;41:854–886.<br />
[15] Korea m<strong>in</strong>istry of Environment: <strong>Indoor</strong> air quality control <strong>in</strong> public use facilities, etc.<br />
Act; Amended by Act No. 10789; 2011.<br />
357