Data Analysis & Measurement: Having a Solar Blast pdf - ER - NASA
Data Analysis & Measurement: Having a Solar Blast pdf - ER - NASA
Data Analysis & Measurement: Having a Solar Blast pdf - ER - NASA

You also want an ePaper? Increase the reach of your titles
YUMPU automatically turns print PDFs into web optimized ePapers that Google loves.
2001-2002 <strong>NASA</strong> CONNECT Series<br />
9<br />
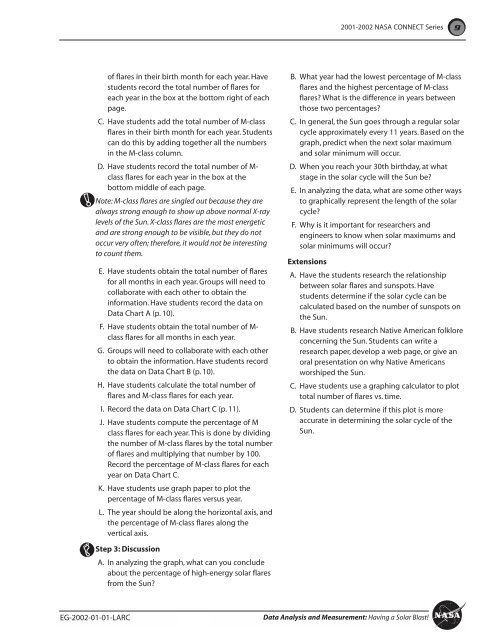
of flares in their birth month for each year. Have<br />
students record the total number of flares for<br />
each year in the box at the bottom right of each<br />
page.<br />
C. Have students add the total number of M-class<br />
flares in their birth month for each year. Students<br />
can do this by adding together all the numbers<br />
in the M-class column.<br />
D. Have students record the total number of M-<br />
class flares for each year in the box at the<br />
bottom middle of each page.<br />
Note: M-class flares are singled out because they are<br />
always strong enough to show up above normal X-ray<br />
levels of the Sun. X-class flares are the most energetic<br />
and are strong enough to be visible, but they do not<br />
occur very often; therefore, it would not be interesting<br />
to count them.<br />
E. Have students obtain the total number of flares<br />
for all months in each year. Groups will need to<br />
collaborate with each other to obtain the<br />
information. Have students record the data on<br />
<strong>Data</strong> Chart A (p. 10).<br />
F. Have students obtain the total number of M-<br />
class flares for all months in each year.<br />
G. Groups will need to collaborate with each other<br />
to obtain the information. Have students record<br />
the data on <strong>Data</strong> Chart B (p. 10).<br />
H. Have students calculate the total number of<br />
flares and M-class flares for each year.<br />
I. Record the data on <strong>Data</strong> Chart C (p. 11).<br />
J. Have students compute the percentage of M<br />
class flares for each year. This is done by dividing<br />
the number of M-class flares by the total number<br />
of flares and multiplying that number by 100.<br />
Record the percentage of M-class flares for each<br />
year on <strong>Data</strong> Chart C.<br />
K. Have students use graph paper to plot the<br />
percentage of M-class flares versus year.<br />
L. The year should be along the horizontal axis, and<br />
the percentage of M-class flares along the<br />
vertical axis.<br />
B. What year had the lowest percentage of M-class<br />
flares and the highest percentage of M-class<br />
flares? What is the difference in years between<br />
those two percentages?<br />
C. In general, the Sun goes through a regular solar<br />
cycle approximately every 11 years. Based on the<br />
graph, predict when the next solar maximum<br />
and solar minimum will occur.<br />
D. When you reach your 30th birthday, at what<br />
stage in the solar cycle will the Sun be?<br />
E. In analyzing the data, what are some other ways<br />
to graphically represent the length of the solar<br />
cycle?<br />
F. Why is it important for researchers and<br />
engineers to know when solar maximums and<br />
solar minimums will occur?<br />
Extensions<br />
A. Have the students research the relationship<br />
between solar flares and sunspots. Have<br />
students determine if the solar cycle can be<br />
calculated based on the number of sunspots on<br />
the Sun.<br />
B. Have students research Native American folklore<br />
concerning the Sun. Students can write a<br />
research paper, develop a web page, or give an<br />
oral presentation on why Native Americans<br />
worshiped the Sun.<br />
C. Have students use a graphing calculator to plot<br />
total number of flares vs. time.<br />
D. Students can determine if this plot is more<br />
accurate in determining the solar cycle of the<br />
Sun.<br />
Step 3: Discussion<br />
A. In analyzing the graph, what can you conclude<br />
about the percentage of high-energy solar flares<br />
from the Sun?<br />
EG-2002-01-01-LARC<br />
<strong>Data</strong> <strong>Analysis</strong> and <strong>Measurement</strong>: <strong>Having</strong> a <strong>Solar</strong> <strong>Blast</strong>!