Assessment of the electric and magnetic field levels in the vicinity of ...
Assessment of the electric and magnetic field levels in the vicinity of ...
Assessment of the electric and magnetic field levels in the vicinity of ...

Create successful ePaper yourself
Turn your PDF publications into a flip-book with our unique Google optimized e-Paper software.
21, rue d'Artois, F-75008 Paris<br />
http://www.cigre.org<br />
C3-202<br />
Session 2004<br />
© CIGRÉ<br />
ASSESSMENT OF THE ELECTRIC AND MAGNETIC FIELD LEVELS<br />
IN THE VICINITY OF THE HV OVERHEAD POWER LINES IN BELGIUM<br />
J. Hoeffelman* G. Decat J-L. Lilien A. Delaigle, B. Govaerts<br />
Elia Vito University <strong>of</strong> Liège Catholic University <strong>of</strong> Louva<strong>in</strong><br />
(Belgium)<br />
1. INTRODUCTION<br />
Nowadays <strong>the</strong>re is a grow<strong>in</strong>g concern about <strong>the</strong> health effects on people liv<strong>in</strong>g <strong>in</strong> <strong>the</strong> vic<strong>in</strong>ity <strong>of</strong> HV<br />
power l<strong>in</strong>es. This concern is ma<strong>in</strong>ly based on a presumption that <strong>the</strong> exposure to ELF (extreme low<br />
frequency) power frequency <strong>field</strong>s <strong>and</strong> more particularly <strong>the</strong> 50 Hz <strong>magnetic</strong> <strong>field</strong> <strong>of</strong> HV overhead<br />
l<strong>in</strong>es (<strong>and</strong> perhaps underground cables which aren’t discussed <strong>in</strong> <strong>the</strong> present paper) might cause<br />
adverse health effects.<br />
Therefore, on <strong>the</strong> one h<strong>and</strong>, <strong>in</strong>ternational bodies like ICNIRP (International Commission on Nonioniz<strong>in</strong>g<br />
Radiation Protection) <strong>and</strong> <strong>the</strong> European Council have proposed exposure reference <strong>levels</strong> not<br />
to be exceeded <strong>in</strong> order to protect <strong>the</strong> general public <strong>and</strong> occupational people aga<strong>in</strong>st ELF <strong>electric</strong> (E)<br />
<strong>and</strong> <strong>magnetic</strong> (H) <strong>field</strong>s.<br />
On <strong>the</strong> o<strong>the</strong>r h<strong>and</strong>, epidemiological studies deal<strong>in</strong>g ma<strong>in</strong>ly with <strong>the</strong> possible <strong>in</strong>duction <strong>of</strong> childhood<br />
leukaemia make reference to cut <strong>of</strong>f po<strong>in</strong>ts (i.e. long term mean exposure values) between “exposed”<br />
<strong>and</strong> “unexposed”1 people which are much lower than <strong>the</strong> reference <strong>levels</strong>. Whatever <strong>the</strong> recommended<br />
<strong>levels</strong> not to be exceeded might be, it is important to know <strong>the</strong> actual exposure <strong>levels</strong> due to HV power<br />
l<strong>in</strong>es.<br />
Maximum exposure <strong>levels</strong> <strong>in</strong> <strong>the</strong> vic<strong>in</strong>ity <strong>of</strong> HV power l<strong>in</strong>es are easy to compute on basis <strong>of</strong> <strong>the</strong> design<br />
parameters. However <strong>the</strong> very large number <strong>of</strong> exist<strong>in</strong>g layouts <strong>and</strong> load flow diagrams makes it very<br />
difficult to analyse <strong>the</strong> behaviour <strong>of</strong> a whole network only by use <strong>of</strong> models. Therefore very few data<br />
are presently available concern<strong>in</strong>g <strong>the</strong> actual exposure <strong>levels</strong>, <strong>and</strong> more particularly <strong>the</strong> long-term<br />
average exposure <strong>levels</strong>.<br />
In order to quantitatively assess <strong>the</strong>se <strong>levels</strong> <strong>in</strong> Belgium a measurement campaign has been performed<br />
<strong>in</strong> <strong>the</strong> whole country dur<strong>in</strong>g <strong>the</strong> w<strong>in</strong>ter <strong>of</strong> 2000 - 2001.<br />
For this measurement campaign all <strong>the</strong> overhead transmission l<strong>in</strong>es under <strong>the</strong> responsibility <strong>of</strong> ELIA,<br />
<strong>the</strong> Belgian Transmission System Operator, have been taken <strong>in</strong>to consideration. This concerns <strong>the</strong> subnetworks<br />
with rated voltages 70, 150, 220 <strong>and</strong> 400 kV.<br />
Although <strong>the</strong> ma<strong>in</strong> concern was <strong>the</strong> H-<strong>field</strong>, measurements <strong>of</strong> <strong>the</strong> maximum E-<strong>field</strong> have also been<br />
performed.<br />
1 “Unexposed” means exposed at <strong>levels</strong> less than <strong>the</strong> concerned cut-<strong>of</strong>f po<strong>in</strong>t <strong>and</strong> for which no association with<br />
an <strong>in</strong>creased relative risk has been found.<br />
(*) jean.hoeffelman@elia.be
2. EXPERIMENTAL DESIGN<br />
2.1. Description <strong>of</strong> <strong>the</strong> network sample<br />
The total length <strong>of</strong> <strong>the</strong> Belgian overhead network is given <strong>in</strong> column B <strong>of</strong> Table 1.<br />
The survey was based on a representative sampl<strong>in</strong>g <strong>of</strong> several “l<strong>in</strong>es” <strong>in</strong> each sub-network.<br />
A B C D E F<br />
Rated<br />
voltage<br />
(kV)<br />
Total length<br />
(km)<br />
Number <strong>of</strong><br />
sampled l<strong>in</strong>es<br />
Total length <strong>of</strong><br />
sampled l<strong>in</strong>es<br />
(km)<br />
Ratio D/B*100<br />
(%)<br />
Ratio nr spans with<br />
measurements / total<br />
nr <strong>of</strong> spans (%)<br />
380 883 7 212 24 1<br />
220 267 2 35 13 0.8<br />
150 2005 10 126 8 0.8<br />
70 2455 8 93 4 0.2<br />
Table 1: Characteristics <strong>of</strong> <strong>the</strong> Belgian overhead network <strong>and</strong> sampl<strong>in</strong>g data<br />
A l<strong>in</strong>e is a portion <strong>of</strong> <strong>the</strong> network between two nodes where <strong>the</strong> characteristics are homogenous (same<br />
layout, same number <strong>of</strong> conductors <strong>and</strong> same cross section…). It ranges from a few hundred <strong>of</strong> meters<br />
up to several tens <strong>of</strong> kilometres.<br />
A l<strong>in</strong>e can be s<strong>in</strong>gle as well as double. In that latter case it usually has two different circuits <strong>in</strong> which<br />
<strong>the</strong> currents are normally <strong>in</strong>dependent, though <strong>in</strong> most cases <strong>the</strong>y are correlated. For some l<strong>in</strong>es,<br />
however, (mostly <strong>in</strong> <strong>the</strong> 70 kV network) <strong>the</strong> bus-bars are <strong>the</strong> same at both extremities <strong>and</strong>, hence, also<br />
<strong>the</strong> currents <strong>in</strong> both circuits. These l<strong>in</strong>es can be called “split l<strong>in</strong>es”.<br />
Though <strong>the</strong> sampl<strong>in</strong>g was performed at r<strong>and</strong>om, four restrictive conditions have been taken <strong>in</strong>to<br />
account:<br />
1) Open space sampl<strong>in</strong>g, i.e. a free access to <strong>the</strong> vic<strong>in</strong>ity <strong>of</strong> <strong>the</strong> l<strong>in</strong>es was required: no houses, trees or<br />
o<strong>the</strong>r obstacles were present <strong>in</strong> order to avoid <strong>the</strong> shadow effect for <strong>the</strong> E-<strong>field</strong> measurement.<br />
2) Only l<strong>in</strong>es for which meter<strong>in</strong>g data (count<strong>in</strong>g) were available have been kept. The reason for<br />
mak<strong>in</strong>g this choice was <strong>the</strong> necessity to assess <strong>the</strong> long-term <strong>field</strong> behaviour <strong>and</strong>, hence, to know<br />
<strong>the</strong> evolution <strong>of</strong> <strong>the</strong> current flow<strong>in</strong>g <strong>in</strong> <strong>the</strong> l<strong>in</strong>es for a period <strong>of</strong> several years2.<br />
3) By lack <strong>of</strong> representativeness, too short l<strong>in</strong>es have been excluded for <strong>the</strong> statistical analysis.<br />
4) Double l<strong>in</strong>es with totally uncorrelated currents <strong>in</strong> both circuits were also excluded because it would<br />
have been too difficult to make afterwards a correlation between <strong>field</strong>s <strong>and</strong> currents.<br />
As shown <strong>in</strong> column E <strong>of</strong> Table 1, a higher weight has been given <strong>in</strong> <strong>the</strong> sampl<strong>in</strong>g <strong>of</strong> <strong>the</strong> l<strong>in</strong>es with <strong>the</strong><br />
highest rated voltages, because <strong>the</strong>y are also responsible for <strong>the</strong> highest <strong>field</strong> level.<br />
2.2. Electric <strong>and</strong> <strong>magnetic</strong> <strong>field</strong> measurements<br />
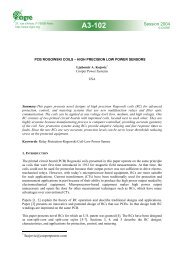
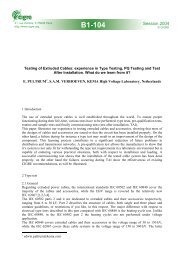
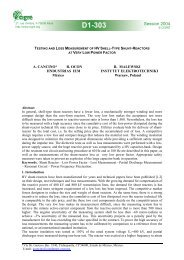
For each chosen l<strong>in</strong>e, measurements <strong>of</strong> <strong>the</strong> E-<strong>field</strong>3 <strong>and</strong> H-<strong>field</strong> have been performed on three different<br />
spans4 <strong>and</strong>, for each span, on 8 different positions, i.e (see Figure 1 <strong>and</strong> Table 2):<br />
1 <strong>and</strong> 5: under <strong>the</strong> lowest conductor5 near <strong>the</strong> tower<br />
2 <strong>and</strong> 6: under <strong>the</strong> lowest conductor where <strong>the</strong> <strong>field</strong> is <strong>the</strong> highest (near mid span)<br />
3 <strong>and</strong> 7: at a distance <strong>of</strong> “a” meters at both sides <strong>of</strong> <strong>the</strong> axis <strong>of</strong> <strong>the</strong> l<strong>in</strong>e <strong>and</strong> at mid span<br />
4 <strong>and</strong> 8: at a distance <strong>of</strong> “2a” meters at both sides <strong>of</strong> <strong>the</strong> axis <strong>of</strong> <strong>the</strong> l<strong>in</strong>e <strong>and</strong> at mid span<br />
In some cases, however, when <strong>the</strong> l<strong>in</strong>e was completely symmetrical or when <strong>the</strong> accessibility to one<br />
2 It can be assumed, by ignor<strong>in</strong>g <strong>the</strong> change <strong>in</strong> <strong>the</strong> conductor height with <strong>the</strong> load, that <strong>the</strong> <strong>magnetic</strong> <strong>field</strong> at a<br />
given location is proportional tot <strong>the</strong> current flow<strong>in</strong>g <strong>in</strong> <strong>the</strong> l<strong>in</strong>e<br />
3 The <strong>electric</strong> <strong>field</strong> has only been measured under <strong>the</strong> l<strong>in</strong>e at po<strong>in</strong>ts 2 <strong>and</strong> 6 <strong>of</strong> Figure 1<br />
4 Contrary to <strong>the</strong> l<strong>in</strong>es <strong>the</strong> three different spans cannot be said to have been chosen at r<strong>and</strong>om because<br />
accessibility was <strong>the</strong> ma<strong>in</strong> concern.<br />
5 If <strong>the</strong>re are more than one lowest conductors, <strong>the</strong> most external is chosen
side <strong>of</strong> <strong>the</strong> l<strong>in</strong>e was too difficult measurements have only been performed at po<strong>in</strong>t 1 to 4.<br />
Po<br />
8<br />
7<br />
5 6<br />
1 2<br />
3<br />
a<br />
a<br />
2a<br />
2a<br />
Pe<br />
All <strong>the</strong> measurements have been made at 1.5<br />
m above ground. However, near <strong>the</strong> tower<br />
<strong>and</strong> under <strong>the</strong> l<strong>in</strong>e (po<strong>in</strong>ts 1,2,5,6), <strong>magnetic</strong><br />
<strong>field</strong> measurements have also been carried<br />
out at a height <strong>of</strong> 3.5 m <strong>in</strong> order to assess <strong>the</strong><br />
<strong>in</strong>crease <strong>in</strong> <strong>field</strong> <strong>levels</strong> at <strong>the</strong> first stage <strong>of</strong> an<br />
hypo<strong>the</strong>tical house built under <strong>the</strong> l<strong>in</strong>e. It has<br />
to be highlighted, <strong>in</strong>deed, that <strong>in</strong> many<br />
European countries, <strong>and</strong> <strong>in</strong> Belgium <strong>in</strong><br />
particular, <strong>the</strong>re are no right <strong>of</strong> way <strong>and</strong><br />
anybody may build a house (or any o<strong>the</strong>r<br />
build<strong>in</strong>g) right under a l<strong>in</strong>e provided <strong>the</strong><br />
clearance distances are respected !<br />
Figure 1: Measurement po<strong>in</strong>ts on a span<br />
between tower Po <strong>and</strong> Pe<br />
4<br />
kV a (m)<br />
380 40<br />
220 30<br />
150 25<br />
70 15<br />
Table 2: Lateral measurement distances<br />
3. RESULTS<br />
3.1. Electric <strong>field</strong><br />
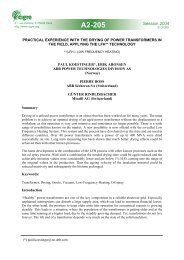
Figure 2 shows <strong>the</strong> arithmetic mean <strong>and</strong> <strong>the</strong> maximum <strong>of</strong> all <strong>the</strong> <strong>electric</strong> <strong>field</strong> values recorded under<br />
<strong>the</strong> l<strong>in</strong>es dur<strong>in</strong>g <strong>the</strong> measurement campaign.<br />
It must be po<strong>in</strong>ted out that, s<strong>in</strong>ce <strong>the</strong> maximum values showed on <strong>the</strong> graph are those recorded dur<strong>in</strong>g<br />
<strong>the</strong> measur<strong>in</strong>g campaign, <strong>the</strong>y are not necessary <strong>the</strong> maximum maximorum <strong>of</strong> <strong>the</strong> network.<br />
Typical <strong>electric</strong>al <strong>field</strong>s under HV l<strong>in</strong>es <strong>in</strong><br />
Belgium<br />
10<br />
8<br />
However <strong>the</strong>y take <strong>in</strong>to account <strong>the</strong><br />
<strong>in</strong>creased sag due to high load conditions.<br />
On <strong>the</strong> o<strong>the</strong>r h<strong>and</strong>, as all <strong>the</strong> measurements<br />
have been recorded <strong>in</strong> open spaces, <strong>the</strong>y are<br />
representative for only that part <strong>of</strong> <strong>the</strong><br />
network <strong>and</strong> give average values <strong>in</strong> excess.<br />
kV/m<br />
6<br />
4<br />
2<br />
0<br />
380 kV 150 kV 70 kV<br />
Electric <strong>field</strong> limits<br />
Location Field value<br />
<strong>in</strong>habited areas 5 kV/m<br />
road cross<strong>in</strong>gs 7 kV/m<br />
maximum<br />
average<br />
elsewhere<br />
10 kV/m<br />
Figure 2: Maximum <strong>and</strong> average <strong>electric</strong> <strong>field</strong><br />
<strong>in</strong> <strong>the</strong> Belgian three ma<strong>in</strong> HV sub-networks<br />
Table 3: Belgian regulation on <strong>the</strong><br />
<strong>electric</strong> <strong>field</strong><br />
The reason for that is <strong>the</strong> existence <strong>in</strong> Belgium <strong>of</strong> a regulation specify<strong>in</strong>g he maximum values <strong>of</strong> <strong>the</strong>
<strong>electric</strong> <strong>field</strong> under overhead l<strong>in</strong>es. These values, given <strong>in</strong> Table 3, were published <strong>in</strong> 1987 well before<br />
<strong>the</strong> ICNIRP (1998) <strong>and</strong> European (1999) recommendations. Although slightly different from those<br />
<strong>in</strong>ternational reference <strong>levels</strong>, <strong>the</strong>y are <strong>in</strong> good agreement with <strong>the</strong>m.<br />
Tak<strong>in</strong>g <strong>in</strong>to account this regulation, <strong>the</strong> design parameters <strong>of</strong> <strong>the</strong> l<strong>in</strong>es (clearance) depend on <strong>the</strong><br />
presence or not <strong>of</strong> roads or houses, <strong>and</strong> hence, <strong>the</strong> <strong>field</strong> values vary accord<strong>in</strong>gly. The recorded E-<strong>field</strong>s<br />
are conform to <strong>the</strong> Belgian regulation <strong>and</strong> <strong>the</strong> ICNIRP guidel<strong>in</strong>es respectively.<br />
It is important to note that E-<strong>field</strong> measurements are very difficult to perform because many objects<br />
(operator, tripod …) <strong>and</strong> climatic parameters are liable to perturb <strong>the</strong> <strong>field</strong>. By compar<strong>in</strong>g <strong>the</strong> results<br />
obta<strong>in</strong>ed by different teams us<strong>in</strong>g calibrated equipment <strong>and</strong> <strong>the</strong> same protocol, we discover systematic<br />
differences as high as 40 % <strong>and</strong> were obliged to discard some <strong>of</strong> <strong>the</strong> measurements. Therefore, <strong>the</strong><br />
results presented <strong>in</strong> Figure 2 are <strong>in</strong> fact only representative <strong>of</strong> <strong>the</strong> north part <strong>of</strong> <strong>the</strong> country. This is also<br />
<strong>the</strong> reason why <strong>the</strong> results for <strong>the</strong> 220 kV network, located <strong>in</strong> <strong>the</strong> south part <strong>of</strong> <strong>the</strong> country are not<br />
shown on Figure 2.<br />
3.2. Magnetic <strong>field</strong><br />
As already stated <strong>in</strong> <strong>the</strong> <strong>in</strong>troduction, one <strong>of</strong> <strong>the</strong> ma<strong>in</strong> objectives <strong>of</strong> <strong>the</strong> measurement campaign was to<br />
get statistical data representative for assess<strong>in</strong>g <strong>the</strong> B-<strong>field</strong> exposure <strong>levels</strong> <strong>of</strong> whole <strong>the</strong> Belgian<br />
network. Therefore a statistical methodology has been developed. The ma<strong>in</strong> idea beh<strong>in</strong>d this<br />
methodology was to develop a statistical representative distribution for estimat<strong>in</strong>g <strong>the</strong> space <strong>and</strong> time<br />
depended variation <strong>of</strong> <strong>the</strong> H-<strong>field</strong> at a given position with respect to <strong>the</strong> typical span pr<strong>of</strong>ile <strong>of</strong> each<br />
sub-network (380-220-150-70 kV).<br />
This statistical distribution has <strong>the</strong>n been used for deriv<strong>in</strong>g <strong>the</strong> ma<strong>in</strong> statistics <strong>of</strong> <strong>in</strong>terest (mean,<br />
percentiles, confidence limits…).<br />
This distribution is based on two distributions considered as <strong>in</strong>dependent :<br />
<strong>the</strong> aggregated distribution <strong>of</strong> <strong>the</strong> current load I <strong>in</strong> <strong>the</strong> different l<strong>in</strong>es <strong>and</strong> <strong>the</strong> statistical distribution<br />
<strong>of</strong> <strong>the</strong> st<strong>and</strong>ardised <strong>magnetic</strong> <strong>field</strong> H st = H/I<br />
The statistical analysis <strong>of</strong> <strong>the</strong> time dependency <strong>of</strong> <strong>the</strong> H-<strong>field</strong> for a given l<strong>in</strong>e can <strong>in</strong>deed be assumed to<br />
be completely known when that <strong>of</strong> <strong>the</strong> current is known.<br />
3.2.1. Correlation between <strong>the</strong> H-<strong>field</strong> <strong>and</strong> <strong>the</strong> current load<br />
In order to correlate <strong>the</strong> H-<strong>field</strong> strength with <strong>the</strong> current load, this latter was recorded each time a<br />
selected l<strong>in</strong>e was sampled. Moreover, <strong>the</strong> power flow <strong>of</strong> each sampled l<strong>in</strong>e has been recorded dur<strong>in</strong>g<br />
one year at a sampl<strong>in</strong>g rate <strong>of</strong> 15 m<strong>in</strong>utes. In this way it was possible to calculate <strong>the</strong> <strong>field</strong> <strong>levels</strong> for<br />
different load conditions <strong>and</strong>, <strong>in</strong> particular, to assess <strong>the</strong> long-term average exposure <strong>levels</strong>.<br />
Irrespectively <strong>of</strong> <strong>the</strong> clearance distances that change with <strong>the</strong> load conditions6, it can be assumed that<br />
<strong>the</strong> <strong>field</strong> <strong>levels</strong> are proportional to <strong>the</strong> current load <strong>of</strong> <strong>the</strong> l<strong>in</strong>e. This is true for a s<strong>in</strong>gle as well as for a<br />
split l<strong>in</strong>e, however it isn’t true for a double l<strong>in</strong>e where each circuit contributes <strong>in</strong>dividually to <strong>the</strong><br />
resultant <strong>of</strong> <strong>the</strong> H-<strong>field</strong> at a given po<strong>in</strong>t.<br />
However, for perform<strong>in</strong>g general calculations on <strong>the</strong> long-term behaviour <strong>of</strong> <strong>the</strong> <strong>field</strong>s it has also been<br />
assumed that each circuit <strong>of</strong> a double l<strong>in</strong>e <strong>in</strong>fluences only <strong>the</strong> <strong>field</strong> <strong>levels</strong> on <strong>the</strong> correspond<strong>in</strong>g side <strong>of</strong><br />
<strong>the</strong> l<strong>in</strong>e. This assumption, although physically not correct, leads to acceptable statistical results when<br />
<strong>the</strong> currents <strong>in</strong> both circuits are sufficiently correlated.<br />
Tak<strong>in</strong>g this assumption <strong>in</strong>to account it was possible, for each H-<strong>field</strong> (µT)7 measurement to calculate<br />
<strong>the</strong> “st<strong>and</strong>ardised <strong>field</strong>” H st (µT/kA) which is equal to <strong>the</strong> quotient <strong>of</strong> H by <strong>the</strong> l<strong>in</strong>e current I (kA)<br />
measured at <strong>the</strong> same time. This st<strong>and</strong>ardised <strong>field</strong> is <strong>in</strong>dependent <strong>of</strong> <strong>the</strong> time: it depends only, for a<br />
given l<strong>in</strong>e, on <strong>the</strong> variations <strong>in</strong> <strong>the</strong> space from one span to <strong>the</strong> o<strong>the</strong>r <strong>and</strong>, for a given sub-network, from<br />
one l<strong>in</strong>e to <strong>the</strong> o<strong>the</strong>r. It depends, <strong>of</strong> course also on <strong>the</strong> measurement uncerta<strong>in</strong>ty.<br />
6 This variation <strong>of</strong> <strong>the</strong> clearance has been taken <strong>in</strong>to account <strong>in</strong> <strong>the</strong> calculations<br />
7 The <strong>magnetic</strong> <strong>field</strong>, represented by <strong>the</strong> letter H, is expressed <strong>in</strong> A/m; however, as usually, we give <strong>the</strong> results <strong>in</strong><br />
terms <strong>of</strong> <strong>the</strong> <strong>in</strong>duction <strong>field</strong> (B-<strong>field</strong>) magnitude <strong>in</strong> µT, with <strong>the</strong> equivalence <strong>in</strong> air <strong>of</strong> 1 µT for 0.8 A/m
3.2.2. Application <strong>of</strong> <strong>the</strong> statistical methodology<br />
The current load <strong>of</strong> a specific l<strong>in</strong>e fluctuates with daily, weekly <strong>and</strong> yearly periodicities that are highly<br />
different from one l<strong>in</strong>e to <strong>the</strong> o<strong>the</strong>r. It has been observed, however, that <strong>the</strong> general evolution <strong>of</strong> <strong>the</strong><br />
load flow distribution <strong>of</strong> a given l<strong>in</strong>e from one year to <strong>the</strong> o<strong>the</strong>r was relatively stationary <strong>and</strong> could be<br />
neglected.<br />
Due to <strong>the</strong> very high dispersion that exists between <strong>the</strong> load factors <strong>of</strong> <strong>the</strong> different l<strong>in</strong>es <strong>and</strong>, <strong>in</strong> order<br />
to enhance <strong>the</strong> aggregate distribution <strong>of</strong> <strong>the</strong> currents over <strong>the</strong> entire sub-networks, data recorded on<br />
additional circuits have been pooled to those referr<strong>in</strong>g to <strong>the</strong> measurement campaign.<br />
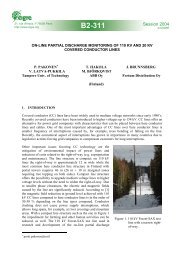
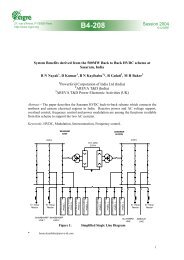
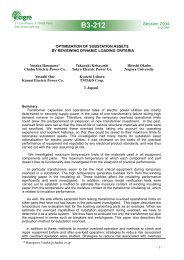
Figure 3 shows an example <strong>of</strong> <strong>the</strong> load<br />
distributions <strong>of</strong> <strong>the</strong> 16 l<strong>in</strong>es that have been<br />
used for assess<strong>in</strong>g <strong>the</strong> current distribution<br />
<strong>of</strong> <strong>the</strong> 380 kV network.<br />
This graph shows a very high variability <strong>in</strong><br />
<strong>the</strong> magnitude <strong>of</strong> <strong>the</strong> maximum currents<br />
<strong>and</strong> <strong>in</strong> <strong>the</strong> load factors.<br />
The aggregate distribution F I (i) has been<br />
derived from <strong>the</strong> <strong>in</strong>dividual distributions<br />
F Ij (i) by apply<strong>in</strong>g <strong>the</strong> follow<strong>in</strong>g formula:<br />
F ( i)<br />
=<br />
I<br />
L<br />
∑<br />
j=<br />
1<br />
F<br />
I j<br />
( i).<br />
P(<br />
L )<br />
where P(L j ) is <strong>the</strong> probability associated to<br />
l<strong>in</strong>e j. <strong>and</strong> L is equal to 16. This probability<br />
is proportional to <strong>the</strong> length <strong>of</strong> <strong>the</strong> l<strong>in</strong>e.<br />
However for double l<strong>in</strong>es, due to <strong>the</strong> high<br />
correlation that exist between both circuits,<br />
this length has been divided by 2.<br />
In <strong>the</strong> statistical analysis, <strong>the</strong> current<br />
distribution is supposed to be perfectly<br />
known as its uncerta<strong>in</strong>ty is considered<br />
to be small with respect to that <strong>of</strong> <strong>the</strong><br />
<strong>magnetic</strong> <strong>field</strong>.<br />
j<br />
Cumulative distribution FI function FIj<br />
0.0 0.2 0.4 0.6 0.8 1.0<br />
FI35V<br />
FI36V<br />
FI31<br />
FI32<br />
FI1<br />
FI2<br />
FI11<br />
FI23<br />
FI35M<br />
FI36M<br />
FI35B<br />
FI36B<br />
FI73<br />
FI79<br />
FI47<br />
FI46<br />
0 500 1000 1500 2000<br />
Current courant I I(A)<br />
Figure 3: Load distribution <strong>of</strong> <strong>the</strong> 16 l<strong>in</strong>es used<br />
for calculat<strong>in</strong>g <strong>the</strong> current distribution <strong>of</strong> <strong>the</strong><br />
380 kV network<br />
Two methods were proposed to derive a spatial distribution for <strong>the</strong> st<strong>and</strong>ardised <strong>magnetic</strong> <strong>in</strong>duction<br />
<strong>field</strong> H st from <strong>the</strong> available data. The first method assumes a normal probability distribution for H st ,<br />
which looks to be a quite realistic approximation tak<strong>in</strong>g <strong>in</strong>to account <strong>the</strong> observed data. The second<br />
approach is based on a distribution free assumption on <strong>the</strong> statistical distribution <strong>of</strong> H st but estimates it<br />
non parametrically from <strong>the</strong> data. This second solution is more difficult to implement <strong>and</strong> must be<br />
seen as a way to assess <strong>the</strong> validity <strong>of</strong> <strong>the</strong> first, <strong>and</strong> easier, approach. The quality <strong>of</strong> <strong>the</strong> H st distribution<br />
depends on <strong>the</strong> representativeness <strong>and</strong> <strong>the</strong> size <strong>of</strong> <strong>the</strong> available data sample.<br />
As already stated before, <strong>the</strong> space-time distribution <strong>of</strong> <strong>the</strong> H-<strong>field</strong> has been developed under <strong>the</strong> quite<br />
realistic <strong>and</strong> convenient hypo<strong>the</strong>sis that <strong>the</strong> statistical distribution <strong>of</strong> <strong>the</strong> st<strong>and</strong>ardised <strong>field</strong>s was<br />
<strong>in</strong>dependent <strong>of</strong> <strong>the</strong> currents. This hypo<strong>the</strong>sis has been validated for <strong>the</strong> 380 kV network <strong>and</strong>, to a lesser<br />
extend, for <strong>the</strong> 150 kV <strong>and</strong> <strong>the</strong> 70 kV networks for which l<strong>in</strong>es with high mean currents show usually<br />
smaller st<strong>and</strong>ardised <strong>field</strong> than l<strong>in</strong>es with smaller loads. However <strong>the</strong> assumption <strong>of</strong> <strong>in</strong>dependency has<br />
been kept because it leads to calculated <strong>field</strong>s values slightly <strong>in</strong> excess <strong>and</strong> thus more conservative.<br />
The space-time distribution <strong>of</strong> <strong>the</strong> H-<strong>field</strong> has <strong>the</strong>n been calculated from <strong>the</strong> current distribution I <strong>and</strong><br />
<strong>the</strong> st<strong>and</strong>ardised <strong>magnetic</strong> <strong>field</strong> distribution H st by straightforward numerical <strong>in</strong>tegration formula.<br />
From this distribution it was possible to derive several parameters <strong>of</strong> <strong>in</strong>terest: such as <strong>the</strong> overall mean<br />
H-<strong>field</strong> <strong>of</strong> a sub-network <strong>and</strong>/or <strong>the</strong> 95th percentile H-<strong>field</strong> value giv<strong>in</strong>g <strong>the</strong> level <strong>of</strong> <strong>magnetic</strong> <strong>field</strong><br />
that is not expected to be exceeded over <strong>the</strong> whole sub-network with a probability <strong>of</strong> 95 %, whatever<br />
<strong>the</strong> load might be.<br />
Ma<strong>in</strong>ly because <strong>of</strong> <strong>the</strong> limited knowledge on <strong>the</strong> st<strong>and</strong>ardised H-<strong>field</strong> (H st ) distribution, <strong>the</strong> statistics
derived from <strong>the</strong> global H-<strong>field</strong> distribution are not exact estimators <strong>of</strong> <strong>the</strong> population parameters,<br />
which have to be estimated with<strong>in</strong> some confidence limits. These limits were derived us<strong>in</strong>g a<br />
simulation method called bootstrap which draws r<strong>and</strong>omly new data samples from <strong>the</strong> orig<strong>in</strong>al<br />
observed one <strong>and</strong> evaluates <strong>the</strong> impact <strong>of</strong> this “resampl<strong>in</strong>g” on <strong>the</strong> variability <strong>of</strong> <strong>the</strong> parameters <strong>of</strong><br />
<strong>in</strong>terest.<br />
3.2.3. Statistical results<br />
Table 4 shows <strong>the</strong> mean, <strong>the</strong> st<strong>and</strong>ard deviation, <strong>the</strong> 95 percentile value (<strong>in</strong>clud<strong>in</strong>g 0.95 confidence<br />
limits8) at different positions (cf Figure 1) <strong>of</strong> <strong>the</strong> 380 kV network.<br />
Position<br />
H1<br />
H2<br />
H3<br />
H4<br />
H-<strong>field</strong> (µT) [confidence limits]<br />
Mean<br />
[1.4 - 2.1]<br />
[2.1 - 3.2]<br />
[0.8 - 1.3]<br />
[0.3 - 0.7]<br />
St<strong>and</strong>ard<br />
deviation<br />
[1.3 - 1.9]<br />
[1.9 - 2.7]<br />
[0.8 - 1.2]<br />
[0.3 - 0.7]<br />
95 percentile<br />
[4.2 - 6.0]<br />
[6.2 - 9.0]<br />
[2.4 - 3.7]<br />
[1.0 - 2.2]<br />
Table 4: Mean, St<strong>and</strong>ard deviation <strong>and</strong> 95 percentile <strong>in</strong> <strong>the</strong> Belgian 380 kV network<br />
(Hx for position x as detailed <strong>in</strong> Figure 1)<br />
The st<strong>and</strong>ard deviation (SD) is not to be<br />
confused with <strong>the</strong> confidence limits: <strong>the</strong><br />
first gives an idea <strong>of</strong> <strong>the</strong> <strong>field</strong> dispersion <strong>in</strong><br />
<strong>the</strong> time <strong>and</strong> <strong>in</strong> <strong>the</strong> space (which is very<br />
important), whereas <strong>the</strong> confidence limits<br />
depend on <strong>the</strong> data sampl<strong>in</strong>g <strong>and</strong> could be<br />
reduced by perform<strong>in</strong>g more measurements.<br />
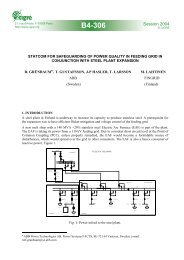
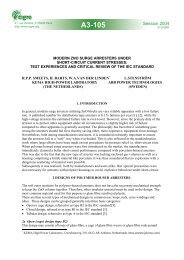
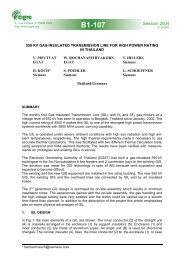
Figure 4Figure 4 gives a plot <strong>of</strong> <strong>the</strong><br />
correspond<strong>in</strong>g <strong>field</strong> pr<strong>of</strong>iles for <strong>the</strong> po<strong>in</strong>ts<br />
H2, H3 <strong>and</strong> H4 (<strong>and</strong> <strong>the</strong>ir symmetrical H6,<br />
H7, H8), without <strong>the</strong> SD <strong>and</strong> <strong>the</strong> confidence<br />
limits but with two additional curves: one<br />
curve (max) gives <strong>the</strong> maximum possible<br />
<strong>magnetic</strong> <strong>field</strong>, not derived from <strong>the</strong><br />
measurement campaign but calculated<br />
tak<strong>in</strong>g <strong>in</strong>to account <strong>the</strong> m<strong>in</strong>imum allowed<br />
clearance <strong>and</strong> <strong>the</strong> maximum rated current <strong>of</strong><br />
2.2 kA; <strong>the</strong> o<strong>the</strong>r curve (rated) is simply <strong>the</strong><br />
product <strong>of</strong> <strong>the</strong> mean value <strong>of</strong> <strong>the</strong><br />
st<strong>and</strong>ardised <strong>field</strong> H st by <strong>the</strong> rated current.<br />
In o<strong>the</strong>r word it shows <strong>the</strong> pr<strong>of</strong>ile <strong>of</strong> <strong>the</strong><br />
space-averaged <strong>field</strong> for <strong>the</strong> maximum rated<br />
current.<br />
µT<br />
40<br />
35<br />
30<br />
25<br />
20<br />
15<br />
10<br />
5<br />
Magnetic <strong>field</strong>s <strong>in</strong> <strong>the</strong> 380 kV netw ork<br />
0<br />
-80 -60 -40 -20 0 20 40 60 80<br />
Distance to <strong>the</strong> axis <strong>of</strong> <strong>the</strong> l<strong>in</strong>e (m)<br />
yearly mean 95%<br />
rated (2.2 kA) max (calculated)<br />
Figure 4: Statistical <strong>and</strong> maximum values <strong>of</strong><br />
<strong>the</strong> <strong>magnetic</strong> <strong>field</strong> <strong>in</strong> <strong>the</strong> 380 kV network<br />
(dots are measured positions)<br />
Figure 5 <strong>and</strong> Figure 6 show <strong>the</strong> same data for respectively <strong>the</strong> 150 kV <strong>and</strong> <strong>the</strong> 70 kV sub-networks but<br />
without <strong>the</strong> calculated maximum <strong>field</strong>. The rated current used on <strong>the</strong>se plots has been chosen arbitrary<br />
<strong>and</strong> correspond only to <strong>the</strong> l<strong>in</strong>es with <strong>the</strong> highest ampacity. It is not representative for <strong>the</strong> majority <strong>of</strong><br />
8 Conservative estimations
<strong>the</strong> l<strong>in</strong>es, ma<strong>in</strong>ly for <strong>the</strong> 70 kV network which is <strong>the</strong> oldest one.<br />
Data for <strong>the</strong> 220 kV are not shown because <strong>the</strong>y are not considered as sufficiently representative.<br />
Magnetic <strong>field</strong>s <strong>in</strong> <strong>the</strong> 150 kV network<br />
Magnetic <strong>field</strong>s <strong>in</strong> <strong>the</strong> 70 kV network<br />
µT<br />
12<br />
10<br />
8<br />
6<br />
4<br />
2<br />
0<br />
-50 -25 0 25 50<br />
Distance to <strong>the</strong> axis <strong>of</strong> <strong>the</strong> l<strong>in</strong>e (m)<br />
µT<br />
8<br />
7<br />
6<br />
5<br />
4<br />
3<br />
2<br />
1<br />
0<br />
-30 -20 -10 0 10 20 30<br />
Distance to <strong>the</strong> axis <strong>of</strong> <strong>the</strong> l<strong>in</strong>e (m)<br />
yearly mean 95% rated (1.1 kA)<br />
yearly mean 95% rated (0.9 kA)<br />
Figure 5: statistical values <strong>of</strong> <strong>the</strong> <strong>magnetic</strong> <strong>field</strong><br />
<strong>in</strong> <strong>the</strong> Belgian 150 kV network<br />
Figure 6: statistical values <strong>of</strong> <strong>the</strong> <strong>magnetic</strong><br />
<strong>field</strong> <strong>in</strong> <strong>the</strong> Belgian 70 kV network<br />
Note: for all <strong>the</strong> curves presented <strong>in</strong> Figure 4Figure 4 to Figure 6, <strong>the</strong> measurement po<strong>in</strong>ts shown at 0<br />
m are <strong>in</strong> fact not on <strong>the</strong> axis <strong>of</strong> <strong>the</strong> l<strong>in</strong>e but on an abscissa located under <strong>the</strong> lowest conductor (merge<br />
<strong>of</strong> po<strong>in</strong>t 2 <strong>and</strong> 6 <strong>in</strong> Figure 1)<br />
The important difference that exists between mean values <strong>and</strong> maximum values (ma<strong>in</strong>ly <strong>in</strong> <strong>the</strong> 380 kV<br />
network) is due to two parameters: firstly, <strong>the</strong> load factor <strong>of</strong> <strong>the</strong> l<strong>in</strong>es <strong>and</strong> secondly <strong>the</strong> average<br />
clearance distance under <strong>the</strong> l<strong>in</strong>es. The load factor, def<strong>in</strong>ed as <strong>the</strong> ratio obta<strong>in</strong>ed by divid<strong>in</strong>g <strong>the</strong><br />
annual load current by <strong>the</strong> annual maximum current; has to take <strong>in</strong>to account <strong>the</strong> N-1 law, i.e. <strong>the</strong><br />
possibility <strong>of</strong> <strong>the</strong> network to cont<strong>in</strong>ue work<strong>in</strong>g correctly <strong>in</strong> <strong>the</strong> absence <strong>of</strong> one <strong>of</strong> its elements. This<br />
expla<strong>in</strong>s why <strong>the</strong> annual maximum currents are usually much lower than <strong>the</strong> rated currents. On <strong>the</strong><br />
o<strong>the</strong>r h<strong>and</strong>, a detailed analysis <strong>of</strong> <strong>the</strong> distribution <strong>of</strong> <strong>the</strong> m<strong>in</strong>imum clearance distance <strong>in</strong> <strong>the</strong> 380 kV<br />
network has shown that <strong>the</strong> average distance was about twice <strong>the</strong> m<strong>in</strong>imum allowed value <strong>of</strong> 9.5 m<br />
used for calculat<strong>in</strong>g <strong>the</strong> maximum <strong>field</strong>.<br />
It has to be po<strong>in</strong>ted out also that <strong>the</strong> results showed on <strong>the</strong> different curves are ra<strong>the</strong>r conservative<br />
because, as already expla<strong>in</strong>ed, all <strong>the</strong> measurements have been performed <strong>in</strong> areas where <strong>the</strong>re were<br />
few or no houses <strong>and</strong> hence where <strong>the</strong> clearance distances were <strong>the</strong> smallest. On <strong>the</strong> o<strong>the</strong>r h<strong>and</strong>s, <strong>the</strong><br />
plots are made for measurements near mid span where, at least under <strong>the</strong> l<strong>in</strong>e (H2) <strong>the</strong> <strong>field</strong> <strong>levels</strong> are<br />
<strong>the</strong> highest.<br />
3.2.4. Miscellaneous results<br />
1) The comparison <strong>of</strong> <strong>the</strong> measurements performed under <strong>the</strong> l<strong>in</strong>e at <strong>the</strong> two different heights above<br />
ground shows that measurements at 3.5 m result <strong>in</strong> a mean <strong>field</strong> <strong>in</strong>crease <strong>of</strong> about 20 % for all <strong>the</strong><br />
networks except for <strong>the</strong> 380 kV network where <strong>the</strong> <strong>in</strong>crease is only about 11 %.<br />
2) The mean ratio H2/H1 between <strong>field</strong> measurements recorded under <strong>the</strong> l<strong>in</strong>e near mid-span <strong>and</strong> near<br />
<strong>the</strong> tower is close to 2 for <strong>the</strong> 70 <strong>and</strong> <strong>the</strong> 150 kV networks <strong>and</strong> is worth about 1.65 for <strong>the</strong> 380 kV<br />
network.<br />
3.2.5. Exposure assessment<br />
On basis <strong>of</strong> <strong>the</strong>se statistical results it is possible to calculate for each sub-network an average width <strong>of</strong><br />
<strong>the</strong> corridors <strong>in</strong> which a given value <strong>of</strong> <strong>the</strong> <strong>magnetic</strong> <strong>field</strong> is exceeded. For <strong>in</strong>stance, <strong>in</strong> <strong>the</strong> 380 kV
network <strong>the</strong> average width <strong>of</strong> <strong>the</strong> corridor <strong>in</strong> which <strong>the</strong> long term mean value <strong>of</strong> 0.4 µT is exceeded is<br />
about 170 m, whereas <strong>the</strong> average width <strong>of</strong> <strong>the</strong> corridor <strong>in</strong> which <strong>the</strong> value <strong>of</strong> 0.4 µT is only exceeded<br />
<strong>in</strong> 5 % <strong>of</strong> <strong>the</strong> cases is about 280 m9.<br />
No detailed calculations have been performed yet for assess<strong>in</strong>g <strong>the</strong> exposure level <strong>of</strong> <strong>the</strong> population <strong>in</strong><br />
Belgium. However, on basis <strong>of</strong> <strong>the</strong> corridor widths <strong>and</strong> on GIS data, <strong>the</strong> Belgian population liv<strong>in</strong>g near<br />
HV l<strong>in</strong>es <strong>in</strong> corridors where <strong>the</strong> annual mean level is higher than <strong>the</strong> cut <strong>of</strong>f po<strong>in</strong>t <strong>of</strong> 0.4 µT used <strong>in</strong><br />
epidemiological studies has been evaluated to be <strong>of</strong> about 1 % <strong>of</strong> <strong>the</strong> total population (which amounts<br />
10 millions <strong>in</strong>habitants spread on a territory <strong>of</strong> about 30.000 km 2 ).<br />
4. CONCLUSIONS<br />
The present measurement campaign makes it possible to perform H-<strong>field</strong> exposure assessments <strong>in</strong> <strong>the</strong><br />
vic<strong>in</strong>ity <strong>of</strong> <strong>the</strong> HV overhead network <strong>in</strong> Belgium. However, larger samples sizes would still enhance<br />
<strong>the</strong> estimation confidence.<br />
In contrast to numerous o<strong>the</strong>r studies <strong>the</strong> H-<strong>field</strong> estimation is based on <strong>the</strong> actual current loads <strong>in</strong> <strong>the</strong><br />
network. It highlights, among o<strong>the</strong>r th<strong>in</strong>gs, <strong>the</strong> importance <strong>of</strong> specify<strong>in</strong>g some k<strong>in</strong>d <strong>of</strong> measurement<br />
protocol, describ<strong>in</strong>g how <strong>field</strong> measurements have to be performed <strong>and</strong> how exposure limits have to be<br />
def<strong>in</strong>ed.<br />
It is absolutely not equivalent to speak about a maximum <strong>field</strong> level, an average <strong>field</strong> level or a level<br />
not to be exceeded dur<strong>in</strong>g a given time. In this respect, <strong>the</strong> example <strong>of</strong> <strong>the</strong> 380 kV network where<br />
<strong>the</strong>re is more than a factor 10 between maximum values <strong>and</strong> mean values is particularly relevant.<br />
Know<strong>in</strong>g that epidemiological studies are based on long term exposure, if reference <strong>levels</strong> lower than<br />
<strong>the</strong> ICNIRP (1998) values were proposed by <strong>in</strong>ternational bodies, <strong>the</strong>y should also be given <strong>in</strong> terms<br />
<strong>of</strong> long term average values such as <strong>the</strong> yearly average or <strong>the</strong> yearly based 95 percentiles described <strong>in</strong><br />
<strong>the</strong> present report.<br />
REFERENCES<br />
Evaluation <strong>of</strong> possible impacts <strong>of</strong> <strong>the</strong> new limits for human exposure to <strong>magnetic</strong> <strong>field</strong>s under<br />
consideration <strong>in</strong> Italy<br />
R. Conti, A. Pig<strong>in</strong>i, A. Giorgy, R. Rend<strong>in</strong>a, L. Sartore, E.A. Sena, C. Sabelli<br />
Cigré - Paris 2002 session – paper 36-106<br />
Dwell<strong>in</strong>gs near overhead power l<strong>in</strong>es <strong>in</strong> <strong>the</strong> Ne<strong>the</strong>rl<strong>and</strong>s<br />
G Kelfkens, RMJ Pennders, MJM Pruppers<br />
RIVM report 610150001/2002 - 40 p <strong>in</strong> Dutch, 2002-<br />
http://www.rivm.nl/biblio<strong>the</strong>ek/rapporten/610150001.html<br />
Magnetic <strong>field</strong>s due to overhead power l<strong>in</strong>es <strong>and</strong> leukaemia <strong>in</strong> children<br />
Plas M van der ; Houthuijs DJM ; Dusseldorp A ; Pennders RMJ ; Pruppers MJM<br />
RIVM report 610050007/2001 - 33 p <strong>in</strong> Dutch, 2001<br />
http://www.rivm.nl/biblio<strong>the</strong>ek/rapporten/610050007.html<br />
Tijdreeks en GIS-model om de blootstell<strong>in</strong>g van de bevolk<strong>in</strong>g aan het 50 Hz magnetisch veld<br />
gegenereerd door bovengrondse hoogspann<strong>in</strong>glijnen <strong>in</strong> Vla<strong>and</strong>eren <strong>in</strong> kaart te brengen<br />
G. Decat, E. Peeters, R. Smolders, M. Bossuyt<br />
MIRA-Milieu-en natuurrapport Vla<strong>and</strong>eren – MIRA/2003/05 – 49 p – <strong>in</strong> Dutch, 2003<br />
http://www2.vmm.be/servlet/be.coi.gw.servlet.Ma<strong>in</strong>Servlet/st<strong>and</strong>ard?toDo=open&id=3102&&<br />
Etude des champs magnétiques sous les lignes à haute tension de Belgique – Développement<br />
d’une méthodologie pour deriver une distribution et des parameters nationaux et application<br />
aux réseaux 70, 150 et 380 kV<br />
A. Delaigle, B. Govaerts, J. Hoeffelman<br />
Université Catholique de Louva<strong>in</strong> – Institut de Statistique - Consult<strong>in</strong>g report 03-05 – 42p – <strong>in</strong> French,<br />
2003<br />
http://www.stat.ucl.ac.be/ISpub/cr/2003/CR0305.pdf<br />
9 ± confidence limits