An international vision for wheat improvement - Wheat Initiative
An international vision for wheat improvement - Wheat Initiative
An international vision for wheat improvement - Wheat Initiative

Create successful ePaper yourself
Turn your PDF publications into a flip-book with our unique Google optimized e-Paper software.
Bread <strong>wheat</strong> represents more than 90% of total <strong>wheat</strong> production, although durum <strong>wheat</strong> is prevalent in specific regions. Over<br />
the millennia, human selection of <strong>wheat</strong> plants with superior yield and quality traits has led to significant <strong>improvement</strong>s in<br />
cultivated varieties compared to their wild relatives. For example, early selection by the world’s first farmers led to the development<br />
of varieties that produced grains of larger size that were retained in the ear <strong>for</strong> longer periods of time. During the 20th century,<br />
the introduction of traits <strong>for</strong> accelerated crop development, semi-dwarf habit, photoperiod insensitivity and enhanced disease<br />
resistance, contributed to further dramatic yield <strong>improvement</strong>s (Table 2).<br />
Table 2. Evolution of <strong>wheat</strong> yield over 10-year periods since 1960 (source FAOSTAT) and projected needs <strong>for</strong> 2050<br />
Period<br />
Mean area<br />
harvested/yr (Mha)<br />
Mean production/yr<br />
(Mt)<br />
Mean production<br />
increase/yr<br />
Mean Yield (t/ha)<br />
Mean Yield<br />
increase/yr<br />
1961-1970 213 278 1.3<br />
1971-1980 225 388 3.9% 1.7 3.2%<br />
1981-1990 229 509 3.1% 2.2 2.9%<br />
1991-2000 220 571 1.2% 2.6 1.7%<br />
2001-2010 216 622 0.9% 2.9 1.1%<br />
2050 (target) 220 1045 1.7% 4.75 1.6%<br />
<strong>An</strong> urgent need to increase global <strong>wheat</strong> sustainable production<br />
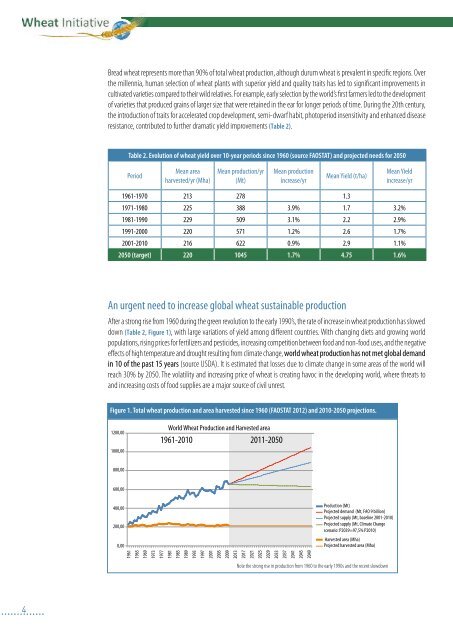
After a strong rise from 1960 during the green revolution to the early 1990’s, the rate of increase in <strong>wheat</strong> production has slowed<br />
down (Table 2, Figure 1), with large variations of yield among different countries. With changing diets and growing world<br />
populations, rising prices <strong>for</strong> fertilizers and pesticides, increasing competition between food and non-food uses, and the negative<br />
effects of high temperature and drought resulting from climate change, world <strong>wheat</strong> production has not met global demand<br />
in 10 of the past 15 years (source USDA). It is estimated that losses due to climate change in some areas of the world will<br />
reach 30% by 2050. The volatility and increasing price of <strong>wheat</strong> is creating havoc in the developing world, where threats to<br />
and increasing costs of food supplies are a major source of civil unrest.<br />
Figure 1. Total <strong>wheat</strong> production and area harvested since 1960 (FAOSTAT 2012) and 2010-2050 projections.<br />
1200,00<br />
1000,00<br />
World <strong>Wheat</strong> Production and Harvested area<br />
1961-2010 2011-2050<br />
800,00<br />
600,00<br />
400,00<br />
200,00<br />
0,00<br />
Production (Mt)<br />
Projected demand (Mt, FAO 9 billion)<br />
Projected supply (Mt, baseline 2001-2010)<br />
Projected supply (Mt, Climate Change<br />
scenario: P2039=97,5% P2010)<br />
Harvested area (Mha)<br />
Projected harvested area (Mha)<br />
1961<br />
1965<br />
1969<br />
1973<br />
1977<br />
1981<br />
1985<br />
1989<br />
1993<br />
1997<br />
2001<br />
2005<br />
2009<br />
2013<br />
2017<br />
2021<br />
2025<br />
2029<br />
2033<br />
2037<br />
2041<br />
2045<br />
2049<br />
Note the strong rise in production from 1960 to the early 1990s and the recent slowdown<br />
4