Social Determinants of Health: Ideological, Economic ... - Tamarack
Social Determinants of Health: Ideological, Economic ... - Tamarack
Social Determinants of Health: Ideological, Economic ... - Tamarack

Create successful ePaper yourself
Turn your PDF publications into a flip-book with our unique Google optimized e-Paper software.
<strong>Social</strong> <strong>Determinants</strong> <strong>of</strong> <strong>Health</strong>:<br />
<strong>Ideological</strong>, <strong>Economic</strong>, and Political<br />
Barriers to <strong>Health</strong><br />
Dennis Raphael, PhD<br />
School <strong>of</strong> <strong>Health</strong> Policy and Management<br />
York University<br />
Presentation to the University <strong>of</strong> Waterloo <strong>Health</strong> Studies<br />
and Gerontology Department Seminar, October 30, 2007
Overview <strong>of</strong> Presentation I<br />
• What do we know about the<br />
determinants <strong>of</strong> health?<br />
• How do we know it?<br />
• What should we be doing?<br />
• Why isn't this happening?<br />
• What can be done about it?
Overview <strong>of</strong> Presentation II<br />
• How does the epistemology (nature <strong>of</strong><br />
knowledge) shape our understandings and<br />
actions on the determinants <strong>of</strong> heath?<br />
• How do the ideologies <strong>of</strong> epidemiology and<br />
individualism shape our understandings and<br />
actions on the determinants <strong>of</strong> heath?<br />
• How does the political economy <strong>of</strong> a society<br />
shape our understandings and actions on<br />
the determinants <strong>of</strong> heath?
What do we know about the<br />
determinants <strong>of</strong> health?
We know what makes us ill.<br />
When we are ill we are told<br />
That it’s you who will heal us.<br />
When we come to you<br />
Our rags are torn <strong>of</strong>f us<br />
And you listen all over our<br />
naked body.<br />
As to the cause <strong>of</strong> our illness<br />
One glance at our rags would<br />
Tell you more.<br />
It is the same cause that<br />
wears out our bodies and our<br />
clothes.<br />
Bertolt Brecht, 1898-1956. Worker’s Speech to a Doctor
What are SDOH?<br />
• <strong>Social</strong> determinants <strong>of</strong> health are the<br />
economic and social conditions that<br />
influence the health <strong>of</strong> individuals,<br />
communities, and jurisdictions as a<br />
whole.<br />
• <strong>Social</strong> determinants <strong>of</strong> health are about<br />
the quantity and quality <strong>of</strong> a variety <strong>of</strong><br />
resources that a society makes available<br />
to its members.
Ottawa Charter’s Prerequisites <strong>of</strong> <strong>Health</strong><br />
• peace<br />
• shelter<br />
• education<br />
• food<br />
• income<br />
• a stable eco-system<br />
• sustainable resources<br />
• social justice<br />
• equity<br />
Source: World <strong>Health</strong> Organization, 1986
The Focus <strong>of</strong> the Canadian SDOH<br />
Conference<br />
• early life<br />
• education<br />
• employment and<br />
working conditions<br />
• food security<br />
• health services<br />
• housing<br />
• income and<br />
income distribution<br />
• social exclusion<br />
• social safety net<br />
• unemployment<br />
Source: Raphael, D. (2004). <strong>Social</strong> <strong>Determinants</strong> <strong>of</strong> <strong>Health</strong>:<br />
Canadian Perspectives. Toronto: Canadian Scholars Press.
All policies which have<br />
a direct bearing on<br />
health need to be<br />
coordinated. The list is<br />
long and includes,<br />
among others,<br />
income security,<br />
employment, education,<br />
housing, business,<br />
agriculture,<br />
transportation, justice<br />
and technology.<br />
-- Jake Epp, Achieving <strong>Health</strong> For All: A Framework for <strong>Health</strong><br />
Promotion, Ottawa: <strong>Health</strong> and Welfare Canada, 1986.
Alberta Government<br />
• The health <strong>of</strong> all Albertans should be promoted and<br />
improved by taking a global view <strong>of</strong> all <strong>of</strong> the<br />
factors that determine and affect people’s health.<br />
This includes basic public health measures,<br />
economic well-being, early childhood development,<br />
education, housing, nutrition, employment status,<br />
quality <strong>of</strong> the environment, lifestyle choices and<br />
healthy behaviours.<br />
• A Framework for Reform: Report <strong>of</strong> the Premier’s<br />
Advisory Council on <strong>Health</strong>, Dec. 2001, p. 41.
Mechanisms and<br />
Pathways
Materialist Approach<br />
• <strong>Health</strong> inequalities result from the<br />
differential accumulation <strong>of</strong> exposures<br />
and experiences that have their<br />
sources in the material world.<br />
• Lynch JW, et al. Income inequality and mortality:<br />
importance to health <strong>of</strong> individual income,<br />
psychosocial environment, or material conditions.<br />
BMJ 2000;320:1220-1224.
Neo-Materialist Approach<br />
• The effect <strong>of</strong> income inequality on health<br />
reflects a combination <strong>of</strong> negative exposures<br />
and lack <strong>of</strong> resources held by individuals,<br />
along with systematic underinvestment<br />
across a wide range <strong>of</strong> human, physical,<br />
health, and social infrastructure.<br />
• Lynch JW, et al Income inequality and mortality: importance to<br />
health <strong>of</strong> individual income, psychosocial environment, or material<br />
conditions. BMJ 2000;320:1220-1224.
Source: Lynch, J. (2000). Income inequality and health: Expanding the<br />
debate. <strong>Social</strong> Science and Medicine, 51, 1001-1005, Figure 1, p. 1003.
Poverty as the<br />
Clustering <strong>of</strong><br />
Disadvantage
All conceivable evils are heaped<br />
upon the poor…They are given damp<br />
dwellings, cellar dens that are not<br />
waterpro<strong>of</strong> from below or garrets that<br />
leak from above… They are supplied<br />
bad, tattered, or rotten clothing,<br />
adulterated and indigestible food.<br />
They are exposed to the most<br />
exciting changes <strong>of</strong> mental condition,<br />
the most violent vibrations between<br />
hope and fear... They are deprived <strong>of</strong><br />
all enjoyments except sexual<br />
indulgence and drunkenness and are<br />
worked every day to the point <strong>of</strong><br />
complete exhaustion <strong>of</strong> their mental<br />
and physical energies…<br />
Frederich Engels, 1820-1895. The Condition <strong>of</strong> the Working Class in England
Disadvantage and <strong>Health</strong>:<br />
Academic Perspectives<br />
It is one <strong>of</strong> the greatest <strong>of</strong> contemporary<br />
social injustices that people who live in the<br />
most disadvantaged circumstances have<br />
more illnesses, more disability and shorter<br />
lives than those who are more affluent.<br />
-- Benzeval, Judge, & Whitehead, 1995, p.xxi, Tackling<br />
Inequalities in <strong>Health</strong>: An Agenda for Action.
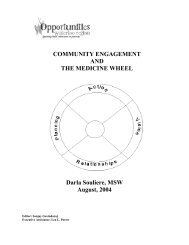
Percentage <strong>of</strong> Canadians, Children, and Individuals in Female<br />
Lone-Parent Families Living in Poverty by Province, 2004<br />
70<br />
BC Now Poverty<br />
Leader<br />
Percentage Living in Poverty<br />
60<br />
50<br />
40<br />
30<br />
20<br />
10<br />
18.4<br />
23.1<br />
62.7<br />
57.7<br />
16.5<br />
13.9<br />
14.4<br />
50.2<br />
18.1<br />
32.9<br />
11.7 10.8<br />
39.9<br />
15.8 15.6<br />
54.6<br />
17.4<br />
14.7<br />
15.8<br />
19.2<br />
47.6<br />
16<br />
57.3<br />
20.1<br />
54.2<br />
13.2<br />
14.5<br />
19.2<br />
23.5<br />
62.8<br />
0<br />
NFL NB NS PEI PQ ON MB SK AL BC<br />
All Children Female Lone-Parent Families<br />
Source: Statistics Canada (2006). Persons in Low Income Before Tax, CANSIM Tables.
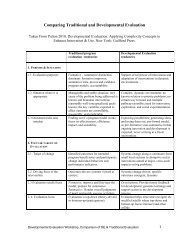
Low Income Gap for All Families and Unattached Individuals<br />
by Province, 2004<br />
10000<br />
Poor in Alberta and<br />
BC are Really Poor!<br />
Poverty Gap in Dollars<br />
9000<br />
8000<br />
7000<br />
6000<br />
5000<br />
4000<br />
3000<br />
6900<br />
6600 6500<br />
6100<br />
76007600<br />
5700 5500<br />
7400 7200<br />
8400<br />
7600<br />
8000<br />
7300 7200<br />
6600<br />
9200<br />
8700<br />
8900<br />
8000<br />
2000<br />
1000<br />
0<br />
NFL NB NS PEI PQ ON MB SK AB BC<br />
All Families<br />
Unattached Individuals<br />
Source: Statistics Canada (2006). Low Income Gap Before Tax in Dollars, CANSIM Tables.
SDOH (Living Conditions) and <strong>Health</strong><br />
<strong>Social</strong> determinants can affect health in a<br />
number <strong>of</strong> ways:<br />
• SDOH provides the prerequisites for health, such<br />
as shelter, food, warmth, and the ability to<br />
participate in society;<br />
• SDOH can cause stress and anxiety which can<br />
damage people’s health;<br />
• SDOH limit peoples’ choices and militates<br />
against desirable changes in behaviour.<br />
- Benzeval, Judge, & Whitehead, 1995, p.xxi, Tackling<br />
Inequalities in <strong>Health</strong>: An Agenda for Action.
Brunner, E. and Marmot, M. G. (2006), <strong>Social</strong> organization, stress, and health in<br />
Marmot, M. G. and Wilkinson, R. G. (Eds.), <strong>Social</strong> <strong>Determinants</strong> <strong>of</strong> <strong>Health</strong>, Oxford<br />
University Press, Oxford..
How do we know it?
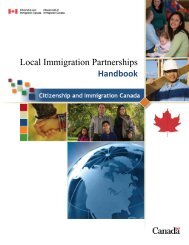
Infant Mortality, Canada 1996<br />
Q1-Richest<br />
Q2<br />
Q3<br />
Q4<br />
Q5-Poorest<br />
per 1,000<br />
0 1 2 3 4 5 6 7 8<br />
Source: Wilkins et al., 2002, <strong>Health</strong> Reports
Life Expectancy, Males,<br />
Canada 1996<br />
72 73 74 75 76 77 78 79<br />
Yrs<br />
Q1-Richest<br />
Q2<br />
Q3<br />
Q4<br />
Q5-Poorest<br />
Source: Wilkins et al., 2002, <strong>Health</strong> Reports
Life Expectancy, Females,<br />
Canada, 1996<br />
80 80.5 81 81.5 82 82.5 83<br />
Yrs<br />
Q1-Richest<br />
Q2<br />
Q3<br />
Q4<br />
Q5-Poorest<br />
Source: Wilkins et al., 2002, <strong>Health</strong> Reports
Increased Risk <strong>of</strong> Diabetes in Ontario Among<br />
Low Income Residents, 1997/97<br />
Males<br />
Females<br />
Diabetes Prevalence Ratio<br />
5<br />
4<br />
3<br />
2<br />
1<br />
0<br />
1.4<br />
3.8<br />
1.5<br />
2.3<br />
Low Low-Middle Upper-<br />
Middle<br />
Income Level<br />
2<br />
1.2 1<br />
1<br />
High<br />
Source: Hux J, Booth G, Laupacis A. The ICES Practice Atlas: Diabetes in Ontario.<br />
Institute for Clinical Evaluative Sciences and the Canadian Diabetes Association; 2002.
Diabetes Mortality, Urban Canada,<br />
ASMR x 100,000<br />
Males, 1996<br />
22<br />
20<br />
18<br />
16<br />
14<br />
12<br />
10<br />
8<br />
6<br />
4<br />
2<br />
0<br />
1971 1976 1981 1986 1991 1996<br />
Source: Wilkins et al., 2002, <strong>Health</strong> Reports<br />
Q1 - Richest<br />
Neighbourhoods<br />
Q2<br />
Q3<br />
Q4<br />
Q5 - Poorest<br />
Neighbourhoods
Diabetes, males<br />
ASMR x 100,000<br />
26<br />
24<br />
22<br />
20<br />
18<br />
16<br />
14<br />
12<br />
10<br />
8<br />
6<br />
4<br />
2<br />
0<br />
1971 1976 1981 1986 1991 1996 2001<br />
Q1 - Richest<br />
Q2<br />
Q3<br />
Q4<br />
Q5 - Poorest
Diabetes Mortality, Urban Canada,<br />
ASMR x 100,000<br />
Females, 1996<br />
22<br />
20<br />
18<br />
16<br />
14<br />
12<br />
10<br />
8<br />
6<br />
4<br />
2<br />
0<br />
1971 1976 1981 1986 1991 1996<br />
Q1 - Richest<br />
Neighbourhoods<br />
Q2<br />
Q3<br />
Q4<br />
Q5 - Poorest<br />
Source: Wilkins et al., 2002, <strong>Health</strong> Reports<br />
Q5 - Poorest<br />
Neighbourhoods
Diabetes, females<br />
ASMR x 100,000<br />
26<br />
24<br />
22<br />
20<br />
18<br />
16<br />
14<br />
12<br />
10<br />
8<br />
6<br />
4<br />
2<br />
0<br />
1971 1976 1981 1986 1991 1996 2001<br />
Q1 - Richest<br />
Q2<br />
Q3<br />
Q4<br />
Q5 - Poorest
Functional <strong>Health</strong>:<br />
The results <strong>of</strong> testing on children<br />
for eight basic attributes: vision,<br />
hearing, speech, mobility,<br />
dexterity, cognition, emotion, and<br />
pain and discomfort.
14<br />
Annual Family Income and Percentage <strong>of</strong><br />
Children with “Lower Functional <strong>Health</strong>”<br />
13.4<br />
12<br />
10<br />
8<br />
8.6<br />
8.1 8.3<br />
6<br />
5.1<br />
4<br />
2<br />
0<br />
80,000<br />
Source: Prepared by the Canadian Council on <strong>Social</strong> Development using the National Longitudinal<br />
Survey <strong>of</strong> Children and Youth, 1994-1995
Heart Attack Admission Rates by Area<br />
Income, Ontario, 1994 - 1997<br />
14000<br />
12000<br />
11837<br />
13935<br />
13115<br />
10000<br />
8000<br />
8090<br />
6000<br />
4000<br />
4614<br />
2000<br />
0<br />
Highest Income<br />
Quintile<br />
2nd Quintle Middle Quintile 4th Quintile Lowest Income<br />
Quintile<br />
Source: Alter, D. A. et al. (1999). Effects <strong>of</strong> socioeconomic status o access to invasive cardiac<br />
procedures and on mortality after acute myocardial infarction. NEJM, 341, 1360-1367.
Report <strong>of</strong> Fair or Poor Self-Rated <strong>Health</strong>:<br />
Odds Ratios for Individual and Area Factors, Ontario, 1996<br />
0 1 2 3 4 5<br />
Age 40-64<br />
Age 65+<br />
Female<br />
Individual low income<br />
Individual medium income<br />
No regular exercise<br />
1.07<br />
1.62<br />
2.19<br />
2.33<br />
3.44<br />
3.89<br />
Smoker<br />
Less than secondary education<br />
Medium area inequality<br />
High area inequality<br />
Low area median income<br />
Medium area median income<br />
1.38<br />
1.43<br />
1.11<br />
1.18<br />
1.07<br />
1.18<br />
Source: Xi et al. (2005). “Income inequality and health in Ontario”, CJPH, 96, 206-211
Poor Scores (
The Story Behind the Story I<br />
How does the epistemology (the nature<br />
<strong>of</strong> knowledge) shape our understandings<br />
and actions on the determinants <strong>of</strong><br />
heath?
Three Forms <strong>of</strong> Knowledge (Park, 1993)<br />
• Instrumental (or positivist) knowledge is developed<br />
through traditional scientific approaches. It is<br />
concerned with controlling physical and social<br />
environments.<br />
• Interactive (or lived) knowledge is derived from<br />
sharing lived experiences. It is concerned with<br />
understanding and the connections among human<br />
beings.<br />
• Critical knowledge is derived from reflection and action<br />
on what is right and just. It is concerned with raising<br />
consciousness about the causes <strong>of</strong> problems and<br />
means <strong>of</strong> alleviating them.
Scientific (positivistic) Knowledge is<br />
Privileged above others<br />
• Quantitative (a problem)<br />
• Individualized (a larger problem)<br />
• Non-normative (an even larger problem)<br />
• De-politicized (a pr<strong>of</strong>ound problem)<br />
• See Raphael, D., & Bryant, T. (2002). The<br />
limitations <strong>of</strong> population health as a model for a<br />
new public health. <strong>Health</strong> Promotion<br />
International, 17, 189-199.
What does de-politicized mean when talking<br />
about health promotion or population health?<br />
• Assuming that individuals’ behaviours,<br />
health, and well-being exist independently<br />
<strong>of</strong> the society in which they live<br />
• Neglect <strong>of</strong> political and economic forces<br />
shaping the distribution <strong>of</strong> resources<br />
• Emphasis on knowledge dissemination,<br />
translation, or exchange rather than<br />
building social and political movements in<br />
the service <strong>of</strong> health
The philosophers<br />
have only<br />
interpreted the<br />
world in various<br />
ways; the point,<br />
however, is to<br />
change it.<br />
Karl Marx, 1818–1883
What should we be doing?
Carrying out the action areas <strong>of</strong> the Ottawa<br />
Charter would be a good beginning ☺…<br />
• build healthy public policy<br />
• create supportive environments for<br />
health<br />
• Strengthen community action for health<br />
• develop personal skills<br />
• and re-orient health services
Federal
All policies which have<br />
a direct bearing on<br />
health need to be<br />
coordinated. The list is<br />
long and includes,<br />
among others,<br />
income security,<br />
employment, education,<br />
housing, business,<br />
agriculture,<br />
transportation, justice<br />
and technology.<br />
-- Jake Epp, Achieving <strong>Health</strong> For All: A Framework for <strong>Health</strong><br />
Promotion, Ottawa: <strong>Health</strong> and Welfare Canada, 1986.
1998
2003
2004
2004
2005
2007
Provincial
Local<br />
(NGOs)
Why isn't this happening?<br />
(to the extent that most<br />
provinces have not identified<br />
improving living conditions as<br />
a significant public health<br />
priority)
Alberta’s Plan:<br />
Take Action on <strong>Health</strong> Now<br />
A wellness program will set targets for better<br />
health. Albertans will be encouraged to follow<br />
healthier lifestyles, such as increasing their level <strong>of</strong><br />
physical activity and reducing their use <strong>of</strong> tobacco.<br />
The program will aim for better health in the<br />
general population, including lower rates <strong>of</strong><br />
diabetes, heart disease and injury. A public<br />
information and health promotion campaign will be<br />
launched in the fall <strong>of</strong> 2002.<br />
Source: Building a better public health care system, the Alberta<br />
government’s response to the Premier’s Advisory Council on <strong>Health</strong><br />
Report, January 2002
Ontario Forms a Ministry <strong>of</strong> <strong>Health</strong> Promotion<br />
The Ministry will help Ontarians lead healthier<br />
lives by delivering programs that promote<br />
healthy choices and healthy lifestyles. To do this<br />
the Ministry will work closely with partners,<br />
stakeholders and all levels <strong>of</strong> government.
The Story Behind the Story II<br />
How do the ideologies <strong>of</strong> epidemiology<br />
and individualism shape our<br />
understandings and actions on the<br />
determinants <strong>of</strong> heath?
Individualism in <strong>Health</strong><br />
• With exceptions, few decision makers examine the<br />
relationship <strong>of</strong> inequalities in health status to racism or<br />
social, political, and economic inequality. None suggest<br />
the need for major political and economic<br />
transformations to eliminate health inequities.<br />
• Many analysts and policymakers instead focus on<br />
symptoms and treatments, microanalysis <strong>of</strong> individual<br />
risk factors, and changing people’s behavior and<br />
lifestyles, not conditions or places.<br />
• They present options primarily through a biomedical<br />
model and remedial solutions, mostly associated with<br />
health care, rarely stressing social transformation<br />
(H<strong>of</strong>richter, 2003, p. 25).
Individualism…<br />
• Individualism, a powerful philosophy and practice in North<br />
American, limits the public space for social movement<br />
activism.<br />
• By transforming public issues into private matters <strong>of</strong> lifestyle,<br />
self-empowerment, and assertiveness, individualism<br />
precludes organized efforts to spur social change. It fits<br />
perfectly with a declining welfare state and also influences<br />
responses to health inequities.<br />
• From this perspective, each person is self interested and<br />
possessed <strong>of</strong> a fixed, competitive human nature. Everyone<br />
has choice and the potential for upward mobility through<br />
hard work—ignoring how we develop through the process <strong>of</strong><br />
living in society (Tesh, 1988).<br />
• Individualism presumes that individuals exist in parallel with<br />
society instead <strong>of</strong> being formed by society (H<strong>of</strong>richter, 2003,<br />
p. 28).
Mass Media<br />
• The mass media almost always cover health as a<br />
personal issue, with emphasis on individual<br />
behavior, choice, and habits.<br />
• Risks become personal risks, and health issues<br />
become medical issues. News coverage rarely<br />
presents stories about community health.<br />
Options, mainly posed in relation to fragmented<br />
policy, shun institutional critique (Lindbladh and<br />
others, 1998).<br />
• Stories on health, as Lawrence Wallack suggests<br />
in Chapter 27 “communicate personal<br />
responsibility rather than social accountability” (p.<br />
29).
Public Understandings
Barriers to Action:<br />
Public Officials
The Political Economy <strong>of</strong><br />
<strong>Determinants</strong> <strong>of</strong> <strong>Health</strong><br />
Concepts and Action
Public <strong>Health</strong> and Public Policy:<br />
Making it Happen I<br />
Eleven public health objectives are as follows:<br />
1. Participation and influence in society<br />
2. <strong>Economic</strong> and social security<br />
3. Secure and favourable conditions during childhood<br />
and adolescence<br />
4. <strong>Health</strong>ier working life<br />
5. <strong>Health</strong>y and safe environments and products<br />
6. <strong>Health</strong> and medical care that more actively<br />
promotes good health
Public <strong>Health</strong> and Public Policy:<br />
Making it Happen II<br />
7. Effective protection against communicable<br />
diseases<br />
8. Safe sexuality and good reproductive health<br />
9. Increased physical activity<br />
10. Good eating habits and safe food<br />
11. Reduced use <strong>of</strong> tobacco and alcohol, a<br />
society free from illicit drugs and doping and<br />
a reduction in the harmful effects <strong>of</strong><br />
excessive gambling
Ross, N. et al. (2005). Metropolitan income inequality and working-age mortality: A cross-sectional<br />
analysis using comparable data from five countries Journal <strong>of</strong> Urban <strong>Health</strong>, 82, 101-110.
Figure 13.4: Union Density, Collective Agreement Coverage<br />
and Child Poverty, Early 00's (coverage rates) and Late 90's<br />
(poverty rates)<br />
Union and Bargaining<br />
Coverage<br />
100<br />
90<br />
80<br />
70<br />
60<br />
50<br />
40<br />
30<br />
20<br />
10<br />
0<br />
Denmark<br />
Finland<br />
Norway<br />
Sweden<br />
92.5<br />
81<br />
4.2<br />
Switzerland<br />
Belgium<br />
Luxembourg<br />
Netherlands<br />
Germany<br />
Austria<br />
Spain<br />
Portugal<br />
Italy<br />
14.9<br />
28<br />
32<br />
Australia<br />
Canada<br />
United Kingdom<br />
New Zealand<br />
USA<br />
13 14<br />
Union Density Collective Bargaining Coverage Child Poverty Rate<br />
21.9<br />
25<br />
20<br />
15<br />
10<br />
5<br />
0<br />
Child Poverty Rate<br />
Source: Organization for <strong>Economic</strong> Cooperation and Development (2006). Trade Union Members and Union<br />
Density. Available at http://www.oecd.org/dataoecd/8/24/31781139.xls and Innocenti Research Centre. A League<br />
Table <strong>of</strong> Child Poverty in Rich Nations (Florence: Innocenti Research Centre, 1999), Figure 1, p.4.
And back in Canada…
Source: Innocenti<br />
Research Centre.<br />
(2005). Child poverty<br />
in rich countries, 2005,<br />
Innocenti report card<br />
No.6. Florence:<br />
Innocenti Research<br />
Centre.<br />
Most data are from the<br />
years 1998-2000.
Figure 3.5: Average Income by Income Quintile, All Family<br />
Units, Canada, 1995-2004<br />
160,000<br />
140,000<br />
120,000<br />
100,000<br />
80,000<br />
60,000<br />
40,000<br />
20,000<br />
0<br />
142,700<br />
119,700<br />
43,600 47,500<br />
12,400 12,900<br />
1995 1996 1997 1998 1999 2000 2001 2002 2003 2004<br />
Lowest Quintile Second Quintile Middle Quintile<br />
Fourth Quintile<br />
Highest Quintile
United Nations Report, 1998<br />
UN lashes out at Canada<br />
for failure to end poverty<br />
Helen Branswell<br />
Times–Colonist Newspaper,<br />
Victoria, B.C., December 5,<br />
1998. pg. E.10
United Nations Report, 2006<br />
Canada failing to care for<br />
poor, disadvantaged: UN<br />
report<br />
CBC News, May 22, 2006<br />
http://www.cbc.ca/story/world/national/2006/05/22/unreportcanada.html
What can be done?
Figure 13.3: Policy Priorities <strong>of</strong> Canadian Food Banks<br />
Increase <strong>Social</strong> Assistance Benefits<br />
Raise the Minimum Wage<br />
Facilitate Affordable Rental Housing<br />
Improve Rates and Access to EI<br />
Increase Disability Supports<br />
Improve Income Supports for Seniors<br />
Expand Job Training Opportunities<br />
Provide Affordable Childcare<br />
Increase National Child Benefit<br />
Lower Tuition, Increase Student Grants<br />
Other Policies<br />
Expand Settlement Services<br />
0 10 20 30 40 50 60 70 80<br />
Percentage <strong>of</strong> Food Banks Recommending Action
Table 1. Federal Party Positions on Issues Identified by Campaign 2000 as Essential to Eliminating<br />
Child Poverty<br />
“Yes” indicates party position meets Campaign 2000 policy recommendation<br />
“Partial” indicates party position partially meets Campaign 2000 policy recommendation<br />
“No” indicates party makes no commitment that meets Campaign 2000 policy recommendation<br />
ISSUE CPC LIB NDP BLOC<br />
Increase Canada Child Tax Benefit to $4,900/child<br />
by 2007 & end clawback from families on social assistance No No Yes No*<br />
Commit to key principles (quality, universal, accessible<br />
& developmental programming) for child care system No Yes Yes No*<br />
Introduce legislation to secure early learning & child care<br />
as permanent social program No No Yes No*<br />
Increase federal funding for a national public system <strong>of</strong><br />
Early Learning & Child Care No Yes Yes Yes<br />
Commit to increase social housing & increase funding<br />
by $2 B/year No Partial Yes Yes<br />
Raise the federal minimum wage to $10/hour No No Yes No*<br />
Restore eligibility for Employment Insurance No No Yes Yes<br />
Increase funding for post-secondary education No Partial Partial Yes
Figure 13.4: Union Density, Collective Agreement Coverage<br />
and Child Poverty, Early 00's (coverage rates) and Late 90's<br />
(poverty rates)<br />
Union and Bargaining<br />
Coverage<br />
100<br />
90<br />
80<br />
70<br />
60<br />
50<br />
40<br />
30<br />
20<br />
10<br />
0<br />
Denmark<br />
Finland<br />
Norway<br />
Sweden<br />
92.5<br />
81<br />
4.2<br />
Switzerland<br />
Belgium<br />
Luxembourg<br />
Netherlands<br />
Germany<br />
Austria<br />
Spain<br />
Portugal<br />
Italy<br />
14.9<br />
28<br />
32<br />
Australia<br />
Canada<br />
United Kingdom<br />
New Zealand<br />
USA<br />
13 14<br />
Union Density Collective Bargaining Coverage Child Poverty Rate<br />
21.9<br />
25<br />
20<br />
15<br />
10<br />
5<br />
0<br />
Child Poverty Rate<br />
Source: Organization for <strong>Economic</strong> Cooperation and Development (2006). Trade Union Members and Union<br />
Density. Available at http://www.oecd.org/dataoecd/8/24/31781139.xls and Innocenti Research Centre. A League<br />
Table <strong>of</strong> Child Poverty in Rich Nations (Florence: Innocenti Research Centre, 1999), Figure 1, p.4.
Reducing <strong>Health</strong> Inequalities<br />
We consider that without a shift <strong>of</strong><br />
resources to the less well <strong>of</strong>f, both in<br />
and out <strong>of</strong> work, little will be<br />
accomplished in terms <strong>of</strong> a reduction <strong>of</strong><br />
health inequalities by interventions<br />
addressing particular downstream’<br />
influences.<br />
-- Report <strong>of</strong> the Acheson Independent Inquiry<br />
into Inequalities in <strong>Health</strong> 1998 p 33
The Story Behind the Story III<br />
How does the political economy <strong>of</strong> a<br />
society shape our understandings and<br />
actions on the determinants <strong>of</strong> heath?
What is the Central Institution in<br />
Canadian Society?<br />
• The state?<br />
•The market?<br />
• The family?
Source: Saint-Arnaud, S., & Bernard, P. (2003). Convergence or resilience? A<br />
hierarchial cluster analysis <strong>of</strong> the welfare regimes in advanced countries. Current<br />
Sociology, 51(5), 499-527.
Esping-Andersen Typology <strong>of</strong><br />
Welfare States I<br />
• <strong>Social</strong> Democratic (e.g., Sweden, Norway, Denmark,<br />
Finland), Liberal (UK, USA, Canada, Australia), and<br />
Conservative (Germany, France, Italy, Portugal)<br />
welfare states form a continuum <strong>of</strong> government<br />
support to citizens.<br />
• These supports range from high government<br />
intervention welfare systems in the <strong>Social</strong> Democratic<br />
countries to residual welfare systems as seen in<br />
Liberal political economies.<br />
• Conservative nations (e.g., Germany, France, Italy fall<br />
midway in their provisions.<br />
• Source: Esping-Andersen, G. (1999). <strong>Social</strong> Foundations <strong>of</strong><br />
Post-Industrial Economies. New York: Oxford University Press.
Esping-Andersen Typology <strong>of</strong><br />
Welfare States II<br />
• The Liberal welfare state sees means-tested<br />
assistance, modest universal transfers, and modest<br />
social-insurance plans.<br />
• Means-testing refers to benefits in the Liberal welfare<br />
state being primarily geared to low-income groups.<br />
• <strong>Social</strong> assistance is limited by traditional, liberal workethic<br />
attitudes that stigmatize the needy and attribute<br />
failure to individual, rather than, societal failures.<br />
• Liberal nations limit welfare benefits since it is<br />
believed generous benefits lead to a preference for<br />
welfare dependency rather than gainful employment.<br />
• Source: Esping-Andersen, G. (1999). <strong>Social</strong> Foundations <strong>of</strong> Post-<br />
Industrial Economies. New York: Oxford University Press.
Anglo-Saxon Liberal Regimes<br />
• Anglo-Saxon liberal political economies had the<br />
lowest health care expenditures and the lowest<br />
coverage by public medical care.<br />
• Had greater incidence <strong>of</strong> low wage earnings,<br />
higher income inequalities, and the highest poverty<br />
rates.<br />
• These economies derived the greatest proportion<br />
<strong>of</strong> income from capital investment rather than<br />
wages.<br />
• These economies had the lowest improvement<br />
rates in infant mortality rates from 1960 to1996.<br />
• Source: Navarro, V., & Shi, L. (2002). The Political Context <strong>of</strong> <strong>Social</strong> Inequalities and<br />
<strong>Health</strong>. In V. Navarro (Ed.), The Political Economy <strong>of</strong> <strong>Social</strong> Inequalities: Consequences<br />
for <strong>Health</strong> and Quality <strong>of</strong> Life. Amityville, NY: Baywood
Figure 12.4: Public Expenditure on Old Age as % <strong>of</strong> GDP, 2001<br />
0 5 10 15<br />
Greece<br />
Switzerland<br />
Germany<br />
Italy<br />
Austria<br />
France<br />
Sweden<br />
Belgium<br />
Poland<br />
Denmark<br />
Spain<br />
UK<br />
Hungary<br />
Finland<br />
Portugal<br />
Luxembourg<br />
Mexico<br />
Japan<br />
Norway<br />
Slovak<br />
Czech Republic<br />
Netherlands<br />
Iceland<br />
USA<br />
Turkey<br />
Canada<br />
New Zealand<br />
Australia<br />
Ireland<br />
Korea<br />
1.2<br />
2.7<br />
5.5<br />
5.3<br />
5.1<br />
4.8<br />
4.7<br />
4.7<br />
9.2<br />
8.7<br />
8.5<br />
8.3<br />
8.3<br />
8.1<br />
8.0<br />
7.9<br />
7.9<br />
7.5<br />
7.4<br />
7.3<br />
6.8<br />
6.7<br />
6.7<br />
6.4<br />
12.7<br />
11.8<br />
11.7<br />
11.3<br />
10.7<br />
10.6
Figure 12.5: Public Expenditure on Incapacity-Related Benefits<br />
as % <strong>of</strong> GDP, 2001<br />
0 1 2 3 4 5 6<br />
Poland<br />
Sweden<br />
Norway<br />
Netherlands<br />
Denmark<br />
Finland<br />
Switzerland<br />
Luxembourg<br />
Belgium<br />
Czech<br />
New Zealand<br />
Iceland<br />
Hungary<br />
Austria<br />
UK<br />
Portugal<br />
Spain<br />
Slovak<br />
Germany<br />
Australia<br />
France<br />
Italy<br />
Greece<br />
Ireland<br />
USA<br />
Canada<br />
Japan<br />
Korea<br />
Turkey<br />
0.8<br />
0.7<br />
0.5<br />
0.4<br />
1.4<br />
1.1<br />
1.8<br />
3.3<br />
3.0<br />
2.8<br />
2.8<br />
2.7<br />
2.5<br />
2.5<br />
2.5<br />
2.4<br />
2.3<br />
2.3<br />
2.3<br />
2.1<br />
2.1<br />
4.1<br />
3.9<br />
3.9<br />
3.8<br />
3.6<br />
4.8<br />
5.2<br />
5.5
Figure 12.6: Public Expenditure on Family as % <strong>of</strong> GDP, 2001<br />
0 1 2 3 4<br />
Denmark<br />
Luxembourg<br />
Norway<br />
Finland<br />
Austria<br />
Sweden<br />
Australia<br />
France<br />
Iceland<br />
Hungary<br />
Belgium<br />
UK<br />
New Zealand<br />
Germany<br />
Greece<br />
Ireland<br />
Czech Republic<br />
Slovak<br />
Switzerland<br />
Portugal<br />
Netherlands<br />
Turkey<br />
Italy<br />
Poland<br />
Canada<br />
Japan<br />
Spain<br />
USA<br />
Mexico<br />
0.6<br />
0.5<br />
0.4<br />
0.3<br />
1.2<br />
1.2<br />
1.1<br />
1.1<br />
1.0<br />
0.9<br />
0.9<br />
1.9<br />
1.8<br />
1.6<br />
1.6<br />
1.5<br />
2.6<br />
2.5<br />
2.3<br />
2.2<br />
2.2<br />
3.2<br />
3.0<br />
2.9<br />
2.9<br />
2.8<br />
2.8<br />
3.4<br />
3.8
Educate
Disease is not something<br />
personal and special, but<br />
only a manifestation <strong>of</strong> life<br />
under modified<br />
(pathological) conditions.<br />
If medicine is to fulfil her<br />
great task, then she must<br />
enter the political and<br />
social life. Do we not<br />
always find the diseases<br />
<strong>of</strong> the populace traceable<br />
to defects in society?<br />
Rudolph Virchow, 1821-1902
Motivate
Activate
Figure 13.3: Policy Priorities <strong>of</strong> Canadian Food Banks<br />
Increase <strong>Social</strong> Assistance Benefits<br />
Raise the Minimum Wage<br />
Facilitate Affordable Rental Housing<br />
Improve Rates and Access to EI<br />
Increase Disability Supports<br />
Improve Income Supports for Seniors<br />
Expand Job Training Opportunities<br />
Provide Affordable Childcare<br />
Increase National Child Benefit<br />
Lower Tuition, Increase Student Grants<br />
Other Policies<br />
Expand Settlement Services<br />
0 10 20 30 40 50 60 70 80<br />
Percentage <strong>of</strong> Food Banks Recommending Action
Figure 13.4: Union Density, Collective Agreement Coverage<br />
and Child Poverty, Early 00's (coverage rates) and Late 90's<br />
(poverty rates)<br />
Union and Bargaining<br />
Coverage<br />
100<br />
90<br />
80<br />
70<br />
60<br />
50<br />
40<br />
30<br />
20<br />
10<br />
0<br />
Denmark<br />
Finland<br />
Norway<br />
Sweden<br />
Switzerland<br />
Belgium<br />
Luxembourg<br />
Netherlands<br />
Germany<br />
Austria<br />
Spain<br />
Portugal<br />
Italy<br />
Australia<br />
Canada<br />
United Kingdom<br />
New Zealand<br />
USA<br />
Union Density Collective Bargaining Coverage Child Poverty Rate<br />
13 14<br />
21.9<br />
25<br />
20<br />
15<br />
10<br />
5<br />
0<br />
Child Poverty Rate<br />
Source: Organization for <strong>Economic</strong> Cooperation and Development (2006). Trade Union Members and Union<br />
Density. Available at http://www.oecd.org/dataoecd/8/24/31781139.xls and Innocenti Research Centre. A League<br />
Table <strong>of</strong> Child Poverty in Rich Nations (Florence: Innocenti Research Centre, 1999), Figure 1, p.4.
Resources<br />
• Canadian Centre for Policy Alternatives<br />
• Centre for <strong>Social</strong> Justice<br />
• Canadian Council on <strong>Social</strong> Development<br />
• Campaign 2000<br />
• National Council <strong>of</strong> Welfare<br />
• Canadian Labour Congress<br />
• National Anti-Poverty Coalition<br />
• Caledon Institute<br />
• Canadian Policy Research Networks<br />
• Public <strong>Health</strong> Agency – <strong>Health</strong> Canada
A Canada with Scandinavian-Style<br />
Equality is Achievable<br />
• It’s not as if we need to obliterate capitalism. Properly<br />
regulated, taxed, and forced to operate in the public<br />
interest, business firms can fit constructively into a just<br />
society. The wealth that their workers produce can be<br />
more fairly distributed.<br />
• This is evident in several parts <strong>of</strong> Europe, notably in the<br />
Scandinavian nations, where capitalism still thrives.<br />
Norway, Sweden, Denmark, and Finland may not have<br />
developed idyllic societies -- but their economies are far<br />
more equitable than Canada’s and far less blighted by<br />
poverty, hunger, and homelessness.<br />
• Business firms operate freely and pr<strong>of</strong>itably in these<br />
countries, but under constraints that make them good<br />
corporate citizens…<br />
• Source: Ed Finn, CCPA Monitor, March 1, 2006.
% <strong>of</strong> GDP in<br />
Transfers<br />
Degree <strong>of</strong> Proportional Representation<br />
Source: Alesina, A. & Glaeser, E. L. (2004). Fighting Poverty in the US and Europe: A World<br />
<strong>of</strong> Difference. Toronto: Oxford University Press
Table 1. Federal Party Positions on Issues Identified by Campaign 2000 as Essential to Eliminating<br />
Child Poverty<br />
“Yes” indicates party position meets Campaign 2000 policy recommendation<br />
“Partial” indicates party position partially meets Campaign 2000 policy recommendation<br />
“No” indicates party makes no commitment that meets Campaign 2000 policy recommendation<br />
ISSUE CPC LIB NDP BLOC<br />
Increase Canada Child Tax Benefit to $4,900/child<br />
by 2007 & end clawback from families on social assistance No No Yes No*<br />
Commit to key principles (quality, universal, accessible<br />
& developmental programming) for child care system No Yes Yes No*<br />
Introduce legislation to secure early learning & child care<br />
as permanent social program No No Yes No*<br />
Increase federal funding for a national public system <strong>of</strong><br />
Early Learning & Child Care No Yes Yes Yes<br />
Commit to increase social housing & increase funding<br />
by $2 B/year No Partial Yes Yes<br />
Raise the federal minimum wage to $10/hour No No Yes No*<br />
Restore eligibility for Employment Insurance No No Yes Yes<br />
Increase funding for post-secondary education No Partial Partial Yes
The Best Hope<br />
• The best means therefore <strong>of</strong> promoting health and<br />
improving population health involves Canadians – and<br />
others -- being informed about the political and<br />
economic forces that shape the health <strong>of</strong> a society.<br />
Once so empowered, they can consider political and<br />
other means <strong>of</strong> influencing these forces.<br />
• <strong>Health</strong> promoters and population health researchers<br />
need to “get political” and recognize the importance <strong>of</strong><br />
political and social action in support <strong>of</strong> health.<br />
• This seems a rather daunting task, but one that hold<br />
the best hope <strong>of</strong> promoting the health <strong>of</strong> citizens in<br />
Canada and elsewhere (Bryant, Raphael, & Rioux,<br />
2006).
And, finally…
And I always thought: the<br />
very simplest words<br />
Must be enough. When I<br />
say what things are like<br />
Everyone's heart must be<br />
torn to shreds.<br />
That you'll go down if you<br />
don't stand up for yourself<br />
Surely you see that.<br />
Bertolt Brecht, 1898-1956. And I Always Thought.
Dennis Raphael<br />
draphael@yorku.ca<br />
This presentation and other presentations<br />
and related papers are available at:<br />
http://www.atkinson.yorku.ca/draphael