STATE OF WOMEN IN CITIES 2012-2013 - UN-Habitat
STATE OF WOMEN IN CITIES 2012-2013 - UN-Habitat
STATE OF WOMEN IN CITIES 2012-2013 - UN-Habitat
You also want an ePaper? Increase the reach of your titles
YUMPU automatically turns print PDFs into web optimized ePapers that Google loves.
GENDER AND THE PROSPERITY <strong>OF</strong> <strong>CITIES</strong><br />
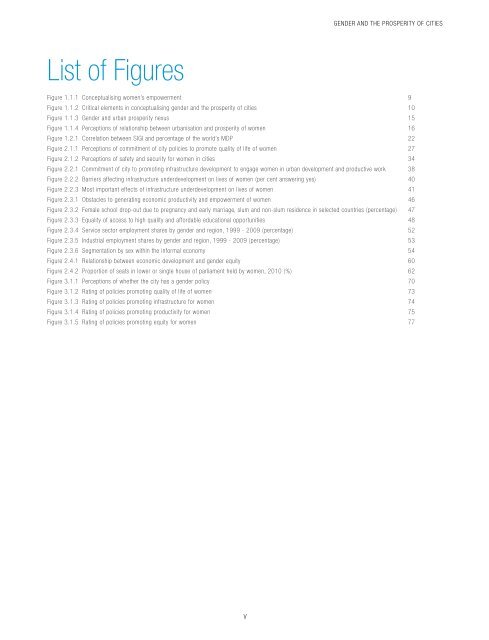
List of Figures<br />
Figure 1.1.1 Conceptualising women’s empowerment 9<br />
Figure 1.1.2 Critical elements in conceptualising gender and the prosperity of cities 10<br />
Figure 1.1.3 Gender and urban prosperity nexus 15<br />
Figure 1.1.4 Perceptions of relationship between urbanisation and prosperity of women 16<br />
Figure 1.2.1 Correlation between SIGI and percentage of the world’s MDP 22<br />
Figure 2.1.1 Perceptions of commitment of city policies to promote quality of life of women 27<br />
Figure 2.1.2 Perceptions of safety and security for women in cities 34<br />
Figure 2.2.1 Commitment of city to promoting infrastructure development to engage women in urban development and productive work 38<br />
Figure 2.2.2 Barriers affecting infrastructure underdevelopment on lives of women (per cent answering yes) 40<br />
Figure 2.2.3 Most important effects of infrastructure underdevelopment on lives of women 41<br />
Figure 2.3.1 Obstacles to generating economic productivity and empowerment of women 46<br />
Figure 2.3.2 Female school drop-out due to pregnancy and early marriage, slum and non-slum residence in selected countries (percentage) 47<br />
Figure 2.3.3 Equality of access to high quality and affordable educational opportunities 48<br />
Figure 2.3.4 Service sector employment shares by gender and region, 1999 - 2009 (percentage) 52<br />
Figure 2.3.5 Industrial employment shares by gender and region, 1999 - 2009 (percentage) 53<br />
Figure 2.3.6 Segmentation by sex within the informal economy 54<br />
Figure 2.4.1 Relationship between economic development and gender equity 60<br />
Figure 2.4.2 Proportion of seats in lower or single house of parliament held by women, 2010 (%) 62<br />
Figure 3.1.1 Perceptions of whether the city has a gender policy 70<br />
Figure 3.1.2 Rating of policies promoting quality of life of women 73<br />
Figure 3.1.3 Rating of policies promoting infrastructure for women 74<br />
Figure 3.1.4 Rating of policies promoting productivity for women 75<br />
Figure 3.1.5 Rating of policies promoting equity for women 77<br />
v


