Download Full Volume - United States Renal Data System
Download Full Volume - United States Renal Data System
Download Full Volume - United States Renal Data System

Create successful ePaper yourself
Turn your PDF publications into a flip-book with our unique Google optimized e-Paper software.
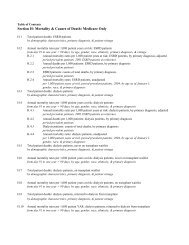
BPREVALENCE OF REPORTED ESRD<br />
Reference section B<br />
Table B.5 B.5<br />
Point prevalent rates of of reported ESRD, 2001-2003<br />
patients<br />
patients<br />
alive<br />
alive<br />
on<br />
on<br />
December<br />
December<br />
31<br />
31<br />
of<br />
of<br />
each<br />
each<br />
year,<br />
year,<br />
per<br />
per<br />
million<br />
million<br />
population,<br />
population,<br />
by<br />
by<br />
age,<br />
age,<br />
gender,<br />
gender,<br />
& race<br />
race<br />
ON OUR WEBSITE & CD<br />
Point prevalent rates of reported ESRD, 1998-2000 (B.5.1).<br />
Point prevalent rates of reported ESRD: by primary diagnosis (B.5.2).<br />
330<br />
Unadjusted rates<br />
Rates adjusted for:<br />
Male Female Gender Race Gender &<br />
White Black N Am Asian White Black N Am Asian White Black N Am Asian Male Female race<br />
0-4 32 32 * 15 16 13 * 12 24 22 25 14 31 16 23<br />
5-9 55 62 38 33 39 32 * 19 47 47 24 26 55 37 46<br />
10-14 95 123 114 55 69 94 84 51 82 108 99 53 97 72 84<br />
15-19 168 277 169 139 128 228 137 147 148 252 153 143 181 142 161<br />
20-29 353 1,020 381 371 286 819 472 344 322 943 439 352 449 365 406<br />
30-39 811 3,215 964 763 611 2,149 1,190 645 707 2,668 1,078 710 1,123 818 966<br />
40-49 1,388 6,006 2,421 1,487 930 3,696 1,828 1,311 1,159 4,885 2,147 1,410 2,024 1,326 1,665<br />
50-59 2,211 11,274 5,694 3,044 1,520 7,229 5,012 2,299 1,879 9,410 5,510 2,729 3,524 2,381 2,936<br />
60-64 3,075 15,119 8,496 5,109 2,219 11,912 9,867 3,665 2,637 13,482 9,203 4,370 4,797 3,634 4,201<br />
65-69 3,738 16,260 9,404 5,936 2,758 14,562 12,053 4,614 3,239 15,394 10,749 5,264 5,536 4,486 5,001<br />
70-79 4,429 15,785 7,610 7,512 2,808 14,299 10,118 6,061 3,616 14,945 8,751 6,841 6,099 4,526 5,299<br />
80+ 4,280 11,456 4,707 8,001 1,787 8,547 4,203 5,599 2,944 9,713 4,241 6,623 5,208 2,850 4,009<br />
0-19 89 123 92 61 64 91 66 57 75 107 75 59 91 67 79<br />
20-44 729 2,644 892 696 543 1,822 963 620 617 2,238 949 662 970 704 833<br />
45-64 2,158 10,437 5,167 2,933 1,495 7,005 4,759 2,248 1,922 9,526 5,702 2,866 3,546 2,473 2,995<br />
65-74 3,962 16,238 8,923 6,408 2,814 14,760 11,488 5,134 3,388 15,491 10,128 5,825 5,747 4,582 5,154<br />
75+ 4,472 13,290 5,692 8,078 2,162 10,617 6,420 6,010 3,194 11,242 5,492 6,847 5,552 3,359 4,437<br />
Diabetes 444 1,189 1,066 476 363 1,367 1,350 424 384 1,708 1,759 599 916 783 849<br />
Hypertension 252 1,599 172 342 162 1,069 129 274 194 1,712 220 412 848 486 662<br />
Glomerulonephritis 250 600 286 371 150 392 277 317 194 561 332 370 367 209 286<br />
Other cause 340 575 231 223 273 514 214 248 59 127 57 53 102 70 86<br />
All 1,286 3,963 1,756 1,413 947 3,342 1,970 1,263 1,115 3,638 1,863 1,336 1,637 1,295 1,463<br />
All (age adjusted) 1,309 5,344 2,510 1,872 871 3,954 2,656 1,468 1,068 4,618 2,594 1,647 1,760 1,218 1,463<br />
U.S. only; patients of unknown age or gender, or of other or unknown race, are excluded.<br />
The prevalent cohorts are determined at the time of ESRD initiation without applying the 60-day stable modality rule.<br />
Age is calculated as of December 31.<br />
*Values for cells with 10 or fewer patients are suppressed.