4. Patient Characteristics from CMS Medical Evidence Form
4. Patient Characteristics from CMS Medical Evidence Form
4. Patient Characteristics from CMS Medical Evidence Form

Create successful ePaper yourself
Turn your PDF publications into a flip-book with our unique Google optimized e-Paper software.
USRDS 1999 Annual Data Report<br />
<strong>Patient</strong> <strong>Characteristics</strong> <strong>from</strong> HCFA <strong>Medical</strong> <strong>Evidence</strong> <strong>Form</strong><br />
Chapter IV<br />
<strong>Patient</strong> <strong>Characteristics</strong> at the Start of<br />
ESRD: Data <strong>from</strong> the HCFA <strong>Medical</strong><br />
<strong>Evidence</strong> <strong>Form</strong><br />
Key Words:<br />
<strong>Medical</strong> <strong>Evidence</strong> Report <strong>Form</strong><br />
End-Stage Renal Disease<br />
Comorbidity<br />
Validity<br />
Cardiovascular Disease<br />
Creatinine Clearance<br />
Pre-ESRD Erythropoeitin Use<br />
Employment<br />
O<br />
ne of the many goals of the United States Renal<br />
Data System (USRDS) is to characterize the<br />
end-stage renal disease (ESRD) population. The<br />
demographic characteristics and treatment modalities<br />
for the ESRD population have been described for all<br />
Medicare patients in each Annual Data Report (ADR)<br />
since the inception of the USRDS. Several USRDS<br />
Special Studies have collected data for representative<br />
samples of ESRD patients. In addition to meeting<br />
specific research goals, these studies also provided<br />
detailed descriptions of the comorbid conditions and<br />
other characteristics of the ESRD population based<br />
on medical record abstraction (USRDS 1992;<br />
USRDS 1996; USRDS 1997). These samples<br />
provided unique comprehensive snapshots of the<br />
ESRD population but, due to their limited<br />
longitudinal design, did not provide an ongoing<br />
surveillance of the ESRD population. Due to the<br />
implementation effort and cost required to carry out<br />
these Special Studies, this type of comprehensive<br />
data collection has only been performed for a sample<br />
of patients on an intermittent, rather than on an<br />
annual basis.<br />
Before 1995, the USRDS data included few<br />
patient characteristics beyond age, race, sex, and<br />
diabetes measured for the census of ESRD patients.<br />
Additionally, prior to 1995, the USRDS data were<br />
limited primarily to Medicare patients. Members of<br />
the renal community have recognized the importance<br />
of many other patient characteristics. For example,<br />
more detailed information on comorbid conditions,<br />
laboratory values, and nutritional status is important<br />
for characterizing the ESRD patient population and<br />
for understanding patient outcomes.<br />
This need was one of the motivations for the<br />
Health Care Financing Administration (HCFA), in<br />
conjunction with input <strong>from</strong> the USRDS and others,<br />
to revise the <strong>Medical</strong> <strong>Evidence</strong> Report <strong>Form</strong>. The<br />
revision, made in April 1995, included the collection<br />
of data on specific comorbid conditions, employment<br />
status, and laboratory values at the start of ESRD.<br />
The comorbid conditions and laboratory values were<br />
chosen in part because they had been shown to be<br />
important predictors of outcomes in the ESRD<br />
population (USRDS 1992). In addition to expanding<br />
the data items recorded, the revised form was<br />
extended to be filled out for all patients, including<br />
non-Medicare patients.<br />
This chapter describes the data collected <strong>from</strong> the<br />
revised <strong>Medical</strong> <strong>Evidence</strong> Report <strong>Form</strong>, first<br />
introduced as a necessary requirement to be<br />
completed by all new ESRD patients in the United<br />
States, in 1995. This chapter will focus on the<br />
57
<strong>Patient</strong> <strong>Characteristics</strong> <strong>from</strong> HCFA <strong>Medical</strong> <strong>Evidence</strong> <strong>Form</strong><br />
USRDS 1999 Annual Data Report<br />
100<br />
80<br />
Primary ESRD Modality in New ESRD <strong>Patient</strong>s,<br />
1995-97*<br />
New <strong>Patient</strong>s (%)<br />
8<strong>4.</strong>3<br />
60<br />
40<br />
20<br />
0<br />
8.7<br />
3.1<br />
0.2<br />
3.7<br />
Hemo CAPD CCPD IPD Transplant<br />
IV -1<br />
*Reported on HCFA <strong>Medical</strong> <strong>Evidence</strong> <strong>Form</strong> USRDS 1999<br />
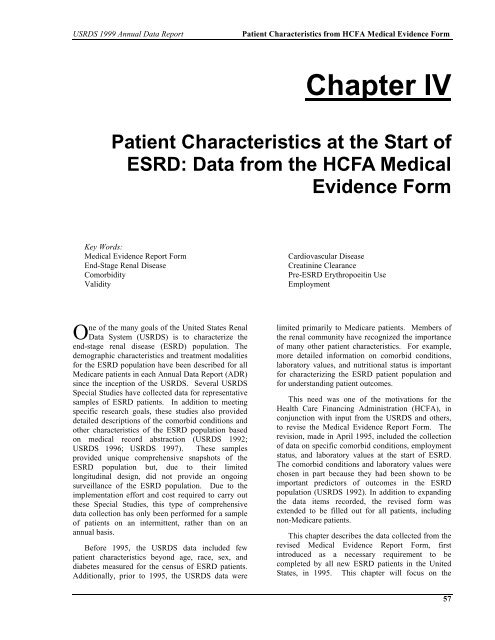
Figure IV-1<br />
Primary ESRD treatment modality in new ESRD patients as reported on the HCFA <strong>Medical</strong> <strong>Evidence</strong> <strong>Form</strong>,<br />
1995-97. Source: Special Analysis.<br />
distribution of characteristics of new ESRD patients<br />
during the time period 1995-1997. Moreover, the<br />
chapter will provide ‘snapshots’ of the health status<br />
of these incident patients by year of incidence, permit<br />
observation of trends in patients characteristics over<br />
these years, and help identify conditions that require<br />
increased attention and more effective treatment.<br />
HCFA’s New <strong>Medical</strong> <strong>Evidence</strong><br />
Report <strong>Form</strong><br />
What is the <strong>Medical</strong> <strong>Evidence</strong> Report<br />
<strong>Form</strong><br />
The <strong>Medical</strong> <strong>Evidence</strong> Report <strong>Form</strong> of the Health<br />
80<br />
Demographic <strong>Characteristics</strong> of New ESRD<br />
<strong>Patient</strong>s, 1997*<br />
New <strong>Patient</strong>s (Age or %)<br />
60<br />
61.1<br />
53.1<br />
40<br />
4<strong>4.</strong>4<br />
20<br />
0<br />
Average Age % Male % Diabetes**<br />
58<br />
*Reported on HCFA <strong>Medical</strong> <strong>Evidence</strong> <strong>Form</strong><br />
IV -2<br />
**Primary/contributing cause of ESRD USRDS 1999<br />
Figure IV-2<br />
Demographic characteristics of new ESRD patients as reported on the HCFA <strong>Medical</strong> <strong>Evidence</strong> <strong>Form</strong>, 1997.<br />
Percent diabetes refers to diabetes as a primary cause of ESRD. Source: Special Analysis and Reference<br />
Tables L.5 and L.11.
USRDS 1999 Annual Data Report<br />
<strong>Patient</strong> <strong>Characteristics</strong> <strong>from</strong> HCFA <strong>Medical</strong> <strong>Evidence</strong> <strong>Form</strong><br />
Reported Race and Hispanic Ethnicity<br />
among New ESRD <strong>Patient</strong>s, 1997*<br />
80<br />
New <strong>Patient</strong>s (%)<br />
3000<br />
Number of People<br />
60<br />
63.5<br />
Hispanic = 10.9%<br />
overall<br />
2000<br />
Counts of races included in<br />
"Other" category<br />
2189<br />
40<br />
20<br />
28.7<br />
1000<br />
0<br />
182<br />
Middle East<br />
515<br />
Indian<br />
Subcontinent<br />
Other/Multiracial<br />
0<br />
2.9<br />
White Black Asian / Native American / Other<br />
Pacific Islander Alaskan Native<br />
*Reported on HCFA <strong>Medical</strong> <strong>Evidence</strong> <strong>Form</strong><br />
Unknown race is not included in percentages.<br />
Approximately 0.6% of patients reported race as “Unknown”.<br />
Figure IV-3<br />
1.1<br />
3.8<br />
IV -3<br />
USRDS 1999<br />
Distribution of race among new ESRD patients as reported on the HCFA <strong>Medical</strong> <strong>Evidence</strong> <strong>Form</strong>, 1997.<br />
Unknown race is not included in percentages (approximately 0.6 percent of patients). Counts of races<br />
included in “Other” are also shown. Source: Reference Tables L.5 and L.8.<br />
Care Financing Administration is a document that is<br />
completed for ESRD patients, in the United States,<br />
beginning renal replacement therapy. The form fills<br />
the dual purpose of documenting Medicare<br />
entitlement and serving as patient registration. This<br />
form is used to collect data are collected on<br />
demographics, causes of ESRD, the utilization of<br />
treatment modalities, comorbid medical conditions,<br />
employment status, laboratory values, and indices of<br />
nutrition. The form was devised to serve both<br />
practical and epidemiological purposes. The primary<br />
objectives are:<br />
1) To ensure all patients initiating dialysis are<br />
accounted for in the United States.<br />
2) To capture data on the characteristics of new<br />
ESRD patients in the United States.<br />
3) To utilize this collected data for epidemiological<br />
purposes.<br />
4) To improve the outcomes for all ESRD patients.<br />
Utilization of the <strong>Medical</strong> <strong>Evidence</strong><br />
Report <strong>Form</strong><br />
There are over 221,000 patients (of the over<br />
300,000 ESRD patients) in dialysis programs<br />
throughout the United States (See Chapters II and<br />
III). This large prevalent population, in part, is<br />
maintained by a growing incidence rate, which is in<br />
excess of 79,000 patients per year. The <strong>Medical</strong><br />
<strong>Evidence</strong> Report <strong>Form</strong> is completed for patients<br />
starting or returning to dialysis or for those who,<br />
instead of dialysis, receive a kidney transplant as<br />
their initial treatment of ESRD. A necessary<br />
component of the care provided by health workers is<br />
the ongoing monitoring of the health status of this<br />
high-risk population, which has a high morbidity and<br />
mortality rate. The <strong>Medical</strong> <strong>Evidence</strong> Report <strong>Form</strong><br />
offers a unique opportunity to capture medical<br />
information on the health status of this entire ESRD<br />
population. The entire <strong>Medical</strong> <strong>Evidence</strong> Report<br />
<strong>Form</strong> is reproduced in the introduction to Section L<br />
of the Reference Tables.<br />
The <strong>Medical</strong> <strong>Evidence</strong> Report <strong>Form</strong> is typically<br />
completed within 45 days of when a patient is<br />
diagnosed as having ESRD. It is the primary<br />
responsibility of the physician caring for each patient<br />
to ensure that the data recorded are complete and<br />
accurate. The attending physician and/or another<br />
designated individual may complete the form. To<br />
date, there is little standardization in the method by<br />
which the form is completed. Therefore, data quality<br />
is likely to be highly variable, particularly for data<br />
items that are not readily available in the dialysis<br />
facility. For the purpose of this chapter, analyses are<br />
limited to new ESRD patients only. Figures IV-1 to<br />
IV-5 and IV-11 to IV-18 relate to all new ESRD<br />
59
<strong>Patient</strong> <strong>Characteristics</strong> <strong>from</strong> HCFA <strong>Medical</strong> <strong>Evidence</strong> <strong>Form</strong><br />
USRDS 1999 Annual Data Report<br />
Primary Detailed Disease Groups Reported among<br />
New ESRD <strong>Patient</strong>s, 1997*<br />
60<br />
New <strong>Patient</strong>s (%)<br />
4<strong>4.</strong>4<br />
40<br />
20<br />
0<br />
26.6<br />
9.9<br />
2.3<br />
Figure IV-4<br />
3.9 3.3 2.0<br />
Diabetes Hyper- Glomerulo- Secondary Interstitial Cystic/ Neoplasms / Misceltension<br />
nephritis GN/ Vascu- Nephritis Hereditary/ Tumors laneous<br />
*Reported on HCFA <strong>Medical</strong> <strong>Evidence</strong> <strong>Form</strong><br />
litis Pyelo - Congenital<br />
Nephritis<br />
7.6<br />
IV - 4<br />
USRDS 1999<br />
Distribution of primary detailed disease groups as reported on the HCFA <strong>Medical</strong> <strong>Evidence</strong> <strong>Form</strong> for new<br />
ESRD patients, 1997. Percentages sum to 100. Miscellaneous includes patients whose disease etiology is<br />
uncertain. Source: Reference Table L.11.<br />
patients, whereas Figures IV-6 to IV-10 exclude<br />
transplant patients and relate to new dialysis patients<br />
only.<br />
Modality Distribution of New ESRD<br />
<strong>Patient</strong>s 1995-1997<br />
Only a small fraction of the incident ESRD<br />
population in the United States is afforded renal<br />
transplantation as initial therapy. For the majority of<br />
new ESRD patients, dialysis remains the standard<br />
modality of treatment. Figure IV-1 describes the<br />
distribution of initial ESRD modality use among<br />
incident ESRD patients in the United States as<br />
reported on the <strong>Medical</strong> <strong>Evidence</strong> Report <strong>Form</strong>, for<br />
the period 1995-1997. Pre-emptive transplantation<br />
was available for 3.7 percent of incident patients.<br />
Hemodialysis was the recorded mode of renal<br />
replacement therapy for 8<strong>4.</strong>3 percent of patients,<br />
while peritoneal dialysis was the recorded mode for<br />
12 percent. These patterns of utilization of renal<br />
50<br />
40<br />
Primary Disease Reported among New ESRD<br />
<strong>Patient</strong>s by Year, 1995-97*<br />
New <strong>Patient</strong>s (%)<br />
42.3<br />
43.3<br />
4<strong>4.</strong>4<br />
1995 1996 1997<br />
30<br />
25.8<br />
26.0 26.6<br />
20<br />
17.9<br />
17.3 16.8<br />
10<br />
11.3<br />
10.8<br />
9.9<br />
2.7 2.5 2.4<br />
0<br />
Diabetes Hypertension Glomerulo- Cystic Other Causes<br />
nephritis Kidney<br />
Disease<br />
IV -5<br />
*Reported on HCFA <strong>Medical</strong> <strong>Evidence</strong> <strong>Form</strong><br />
USRDS 1999<br />
Figure IV-5<br />
60<br />
Distribution of primary disease among new patients by year as reported on the HCFA <strong>Medical</strong> <strong>Evidence</strong><br />
<strong>Form</strong>, 1995-97. Percentages within each year sum to 100. Unknown causes of ESRD included in other<br />
causes; patients whose cause of ESRD is missing are excluded. Source: Reference Table L.20.
USRDS 1999 Annual Data Report<br />
<strong>Patient</strong> <strong>Characteristics</strong> <strong>from</strong> HCFA <strong>Medical</strong> <strong>Evidence</strong> <strong>Form</strong><br />
Cardiovascular <strong>Patient</strong> <strong>Characteristics</strong> among<br />
New Dialysis <strong>Patient</strong>s, 1997*<br />
40<br />
30<br />
New <strong>Patient</strong>s (%)<br />
3<strong>4.</strong>7<br />
25.1<br />
20<br />
15.6<br />
10<br />
9.4<br />
9.7<br />
0.9<br />
0<br />
Congestive CAD MI Cardiac CVD / Peripheral<br />
Heart Arrest CVA/ Vascular<br />
Failure TIA Disease<br />
IV -6<br />
*Reported on HCFA <strong>Medical</strong> <strong>Evidence</strong> <strong>Form</strong><br />
USRDS 1999<br />
Figure IV-6<br />
Cardiovascular patient characteristics among new dialysis patients as reported on the HCFA <strong>Medical</strong><br />
<strong>Evidence</strong> <strong>Form</strong>, 1997. Source: Reference Table L.15.<br />
replacement therapies are similar to those described<br />
in prior USRDS ADRs (USRDS 1998).<br />
Demographic <strong>Characteristics</strong> of<br />
New ESRD <strong>Patient</strong>s, 1995-1997<br />
During the period 1995-1997, over 167,000 new<br />
patients started on renal replacement therapy in the<br />
United States. The demographic characteristics of<br />
these patients for 1997 are shown in Figures IV-2 and<br />
IV-3. Among this incident population, 53.1 percent<br />
were male, 4<strong>4.</strong>4 percent were diabetic and the mean<br />
age was 61 years (Figure IV-2). These data are in<br />
agreement with other published USRDS ADRs.<br />
Figure IV-3 illustrates differences among incident<br />
patients with respect to race. By far the largest group<br />
is White, accounting for 63.5 percent of all incident<br />
patients. Black race also constitutes a large<br />
proportion (28.7 percent) of all incident patients, with<br />
Asian/Pacific Islander and Alaskan Native/Native<br />
American races comprising a smaller fraction (2.9<br />
percent and 1.1 percent respectively) of the total.<br />
The racial group ‘other’ has been used to describe<br />
those patients who are not of the aforementioned<br />
groups and are of different racial origin or are<br />
multiracial. The collection of more detailed<br />
information on this category by the <strong>Medical</strong> <strong>Evidence</strong><br />
Report <strong>Form</strong> allows further characterization of this<br />
heterogeneous group. The inset box in Figure IV-3<br />
describes these groups as counts. It can be seen that<br />
the ‘other/multiracial’ group constitutes the largest<br />
fraction within this group. <strong>Patient</strong>s with origins <strong>from</strong><br />
the Middle East and the Indian subcontinent are<br />
reported to contribute much smaller numbers.<br />
Cause of ESRD Among New<br />
Dialysis <strong>Patient</strong>s, 1997<br />
The <strong>Medical</strong> <strong>Evidence</strong> Report <strong>Form</strong> lists 8<br />
primary disease categories (diabetes, glomerulonephritis<br />
(GN), secondary glomerulonephritis/vasculitis,<br />
interstitial nephritis/pyelonephritis, hypertension/large<br />
vessel disease, cystic/hereditary/congenital<br />
diseases, neoplasms/tumor, miscellaneous<br />
conditions) and offers codes for 72 specific causes of<br />
ESRD. Figure IV-4 describes the prevalence of<br />
ESRD by primary disease as reported <strong>from</strong> the<br />
<strong>Medical</strong> <strong>Evidence</strong> Report <strong>Form</strong>. It should be noted<br />
that hypertension, as a cause of ESRD, is not a<br />
distinct entity but rather a composite category that<br />
includes several conditions including renal disease<br />
due to hypertension, renal artery stenosis/occlusion<br />
and atheroembolic disease. Figure IV-5 shows<br />
primary disease by year of incidence. Causes of<br />
ESRD other than diabetes, hypertension (defined<br />
above), primary glomerulonephritis and cystic kidney<br />
diseases are categorized as “other causes”. Diabetes<br />
is the leading cause of ESRD among incident patients<br />
in the United States accounting for 4<strong>4.</strong>4 percent of all<br />
ESRD in 1997. Hypertension, primary glomerulonephritis,<br />
cystic kidney disease, and “other causes”<br />
account for 26.6 percent, 9.9 percent, 2.4 percent, and<br />
61
<strong>Patient</strong> <strong>Characteristics</strong> <strong>from</strong> HCFA <strong>Medical</strong> <strong>Evidence</strong> <strong>Form</strong><br />
USRDS 1999 Annual Data Report<br />
40<br />
30<br />
20<br />
Ischemic Heart Disease (CAD) and Myocardial<br />
Infarction (MI) by Gender and Diabetes in New<br />
Dialysis <strong>Patient</strong>s, 1997*<br />
New <strong>Patient</strong>s (%)<br />
27.0<br />
22.9<br />
29.5<br />
CAD<br />
21.5<br />
M I<br />
10<br />
10.6<br />
8.1<br />
10.7<br />
8.4<br />
0<br />
Male Female Yes No<br />
Gender Diabetes<br />
IV -7<br />
*Reported on HCFA <strong>Medical</strong> <strong>Evidence</strong> <strong>Form</strong> USRDS 1999<br />
Figure IV-7<br />
Ischemic heart disease (CAD) and Myocardial Infarction (MI) by gender and diabetes for new dialysis<br />
patients as reported on the HCFA <strong>Medical</strong> <strong>Evidence</strong> <strong>Form</strong>, 1997. Source: Reference Tables L.17 and L.19.<br />
16.8 percent, respectively, in 1997. From 1995-1997,<br />
there has been an increase in the proportion of<br />
patients reported to have ESRD due to diabetes and<br />
hypertension, with a corresponding decrease in the<br />
proportion due to GN, cystic kidney diseases, and<br />
other causes.<br />
Comorbid Conditions Among New<br />
Dialysis <strong>Patient</strong>s, 1997<br />
Distribution of Comorbidities among<br />
New ESRD <strong>Patient</strong>s<br />
<strong>Patient</strong>s with ESRD have a high prevalence of<br />
comorbid medical conditions, which contribute to<br />
their shortened survival span (USRDS 1992). The<br />
<strong>Medical</strong> <strong>Evidence</strong> Report <strong>Form</strong> requests information<br />
on the presence of 20 comorbid medical conditions in<br />
new dialysis patients. Figures IV-6 through IV-13<br />
illustrate the distribution of cardiovascular and noncardiovascular<br />
comorbid medical conditions reported<br />
among incident dialysis patients in 1997. The high<br />
percentage of cardiovascular diseases is striking, as<br />
Ischemic Heart Disease (CAD) and Myocardial<br />
Infarction (MI) by Age for New Dialysis <strong>Patient</strong>s, 1997*<br />
40<br />
30<br />
New <strong>Patient</strong>s (%)<br />
CAD<br />
MI<br />
32.8<br />
35.6<br />
20<br />
20.6<br />
62<br />
10<br />
0<br />
<strong>4.</strong>6<br />
2.0<br />
*Reported on HCFA <strong>Medical</strong> <strong>Evidence</strong> <strong>Form</strong><br />
8.1<br />
Figure IV-8<br />
Ischemic heart disease (CAD) and Myocardial Infarction (MI) by age for new dialysis patients as reported on<br />
the HCFA <strong>Medical</strong> <strong>Evidence</strong> <strong>Form</strong>, 1997. Source: Reference Table L.16.<br />
12.2<br />
20-44 45-64 65-74 75+<br />
Age<br />
12.8<br />
IV -8<br />
USRDS 1999
USRDS 1999 Annual Data Report<br />
<strong>Patient</strong> <strong>Characteristics</strong> <strong>from</strong> HCFA <strong>Medical</strong> <strong>Evidence</strong> <strong>Form</strong><br />
are the percentages of the underlying medical<br />
conditions that constitute this disease group. Less<br />
common but no less important are non-cardiovascular<br />
comorbid conditions, which are also reported. These<br />
conditions include chronic obstructive pulmonary<br />
disease (COPD) and cancer.<br />
Cardiovascular Conditions Among<br />
New Dialysis <strong>Patient</strong>s<br />
Several studies have described the excess burden<br />
of cardiovascular disease that is present among new<br />
ESRD patients (USRDS 1992; Bloembergen; Stack<br />
1998a). The high prevalence of coronary artery<br />
disease and its attendant sequelae in this patient<br />
population has prompted the establishment of a<br />
National Task Force on Cardiac Disease (NKF Task<br />
Force 1998). Their primary aim was to address the<br />
high prevalence of cardiac disease among patients<br />
with renal insufficiency, and offer guidelines for<br />
proposed methods of screening and intervention. The<br />
<strong>Medical</strong> <strong>Evidence</strong> Report <strong>Form</strong> has a useful role to<br />
play in surveillance of cardiovascular disease among<br />
incident dialysis patients as data collected may be<br />
used to follow trends in the prevalence of these<br />
conditions. Figure IV-6 describes the distribution of<br />
cardiovascular conditions reported for new ESRD<br />
patients in 1997. Congestive heart failure was<br />
reported to be present in almost 3<strong>4.</strong>7 percent of<br />
patients (a total count of 75,200 patients). Coronary<br />
artery disease (CAD) was reported in 25.1 percent of<br />
new ESRD patients, and 9.4 percent had prior<br />
myocardial infarction (MI). Furthermore,<br />
cerebrovascular disease (CVD) and peripheral<br />
vascular disease, associated atherosclerotic conditions<br />
were reported to be present in 9.7 percent and<br />
15.6 percent of new ESRD patients respectively.<br />
Cardiac arrest was present in less than 1 percent.<br />
The prevalence of cardiovascular disease among<br />
this incident dialysis population is far greater than in<br />
the general population (NKF Task Force 1998). The<br />
cause of this excess burden is unclear, but uremic<br />
toxins and novel atherogenic mediators may play a<br />
major role (Lindner; Witzum; Chauveau).<br />
Although highly prevalent, as shown in Table IV-<br />
1, the presence of cardiac comorbid conditions is<br />
reportedly less frequent on the HCFA <strong>Medical</strong><br />
<strong>Evidence</strong> Report <strong>Form</strong> than in the USRDS Special<br />
Study, the Dialysis Morbidity and Mortality Wave 2<br />
(DMMS Wave 2). The DMMS is a study of over<br />
4,000 patients starting hemodialysis (HD) or<br />
peritoneal dialysis (PD) in 1996 and 1997, in which<br />
Reported Comorbid Conditions Among New<br />
Dialysis <strong>Patient</strong>s by Source, 1996-97*<br />
Cardiovascular Comorbid Conditions<br />
Pre-existing Risk Factor HCFA 2728 DMMS Wave 2 Kappa<br />
Congestive Heart Failure (%) 29.4 36.1 0.49<br />
Coronary Artery Disease (%) 21.5 40.0 0.43<br />
Myocardial Infarction (%) 7.9 16.3 0.40<br />
Cardiac Arrest (%) 1.0 2.2 0.14<br />
CVD / CVA / TIA (%) 8.2 12.0 0.50<br />
Peripheral Vascular Disease (%) 13.6 19.6 0.40<br />
Diabetes on Insulin (%) 26.8 33.1 0.71<br />
COPD (%) 5.8 11.7 0.41<br />
Cancer (%) <strong>4.</strong>0 9.7 0.42<br />
Pericarditis (%) 1.3 2.5 0.25<br />
Non-Cardiovascular Comorbid Conditions<br />
Kappa or<br />
Pre-existing Risk Factor HCFA 2728 DMMS Wave 2 Mean % Diff.<br />
Inability to Ambulate (%) 2.6 10.1 0.19<br />
Inability to Transfer (%) 0.9 8.5 0.13<br />
Current Smoker (%) 6.9 41.8 0.16<br />
Body Mass Index (kg/m 2 ) 25.9 25.5 6.7%<br />
Serum Albumin (g/dl) 3.3 3.5 12.4%<br />
*Matched patients <strong>from</strong> DMMS Wave 2 data and HCFA <strong>Medical</strong> <strong>Evidence</strong> <strong>Form</strong> (n~2443, 50% HD, 50% PD).<br />
Source: Special Analysis.<br />
Table IV-1<br />
USRDS 1999<br />
63
<strong>Patient</strong> <strong>Characteristics</strong> <strong>from</strong> HCFA <strong>Medical</strong> <strong>Evidence</strong> <strong>Form</strong><br />
USRDS 1999 Annual Data Report<br />
data on comorbidity was collected retrospectively by<br />
medical chart abstraction. CAD was reported among<br />
40.0 percent of patients in the DMMS compared to<br />
21.5 percent reported among patients using HCFA<br />
<strong>Medical</strong> <strong>Evidence</strong> <strong>Form</strong> data. Similarly, CVD was<br />
reported among 12.0 percent compared to 8.2<br />
percent; peripheral vascular disease was reported<br />
among 19.6 percent compared to 13.6 percent, and<br />
congestive heart failure was reported among 36.1<br />
compared to 29.4 percent. Furthermore the level of<br />
agreement between the two data sources is relatively<br />
poor for several comorbid measures, with Kappa<br />
values ranging <strong>from</strong> 0.13 to 0.71. The Kappa values<br />
provide a statistical assessment of agreement between<br />
two data sources, with 1.0 indicating perfect<br />
agreement. Levels below 0.50 indicate poor<br />
agreement. Agreement between the data sources is<br />
also discussed in the section entitled “Reporting of<br />
Comorbid Conditions among New Dialysis <strong>Patient</strong>s”.<br />
Ischemic heart disease or CAD is a common form<br />
of heart disease among ESRD patients. A detailed<br />
description of the prevalence of ischemic heart<br />
disease among new ESRD patients, as reported by the<br />
<strong>Medical</strong> <strong>Evidence</strong> Report <strong>Form</strong>, serves two purposes.<br />
First, it serves to emphasize the great burden of<br />
coronary disease that is present among new patients<br />
starting dialysis, which predicts a shortened life span.<br />
Second, it implies that factors responsible for this<br />
excess burden of disease are present long before the<br />
initiation of dialysis. The reported prevalence of<br />
coronary artery disease among incident dialysis<br />
patients in 1997 was 25.1 percent. Prior documented<br />
myocardial infarction was recorded on this form in<br />
9.4 percent of new patients (Figure IV-6).<br />
The distribution of coronary artery disease among<br />
dialysis patients, both incident and prevalent, has<br />
been addressed using data <strong>from</strong> prior USRDS Special<br />
Studies (Bloembergen; Stack 1998a). These data<br />
suggest that demographic differences exist in the<br />
prevalence of coronary disease. National data<br />
collected on incident dialysis patients as reported on<br />
the <strong>Medical</strong> <strong>Evidence</strong> Report <strong>Form</strong> also emphasize<br />
that similar differences exist. Males were reported to<br />
have a greater prevalence of ischemic heart disease<br />
and myocardial infarction than females (27.0 percent<br />
vs 22.9 percent and 10.6 percent vs. 8.1 percent)<br />
(Figure IV-7). Similarly, diabetics were reported to<br />
have a greater burden of clinical coronary disease<br />
than nondiabetics. The prevalence of ischemic heart<br />
disease and acute coronary events was observed to<br />
increase with age as it does in the general population<br />
as show in Figure IV-8. The distribution of coronary<br />
artery disease by race and ethnicity is shown in<br />
Figure IV-9. These data confirm observations of<br />
other USRDS Special Studies (Stack 1998a; Stack<br />
1998b). White, Native American, and “Other” race<br />
had the highest prevalence of ischemic heart disease<br />
(CAD) (30.6 percent, 22.0 percent and 19.5 percent<br />
Ischemic Heart Disease (CAD) and Myocardial<br />
Infarction (MI) by Race and Hispanic Ethnicity in New<br />
Dialysis <strong>Patient</strong>s, 1997*<br />
35<br />
30<br />
25<br />
20<br />
15<br />
10<br />
5<br />
0<br />
New <strong>Patient</strong>s (%)<br />
30.6<br />
11.8<br />
1<strong>4.</strong>8<br />
5.1<br />
17.6<br />
5.6<br />
22.0<br />
CAD<br />
9.3<br />
19.5<br />
White Black Asian Native Other Hispanic Non-<br />
American<br />
Hispanic<br />
*Reported on HCFA <strong>Medical</strong> <strong>Evidence</strong> <strong>Form</strong><br />
5.9<br />
Figure IV-9<br />
MI<br />
20.2<br />
6.0<br />
25.7<br />
9.8<br />
IV -9<br />
USRDS 1999<br />
Ischemic heart disease (CAD) and Myocardial Infarction (MI) by race and Hispanic ethnicity for new dialysis<br />
patients, 1997. Source: Reference Table L.18.<br />
64
USRDS 1999 Annual Data Report<br />
<strong>Patient</strong> <strong>Characteristics</strong> <strong>from</strong> HCFA <strong>Medical</strong> <strong>Evidence</strong> <strong>Form</strong><br />
Non-Cardiovascular <strong>Patient</strong> <strong>Characteristics</strong><br />
among New Dialysis <strong>Patient</strong>s, 1997*<br />
30<br />
New <strong>Patient</strong>s (%)<br />
2<strong>4.</strong>1<br />
20<br />
10<br />
0<br />
7.4<br />
5.2<br />
Diabetes COPD Cancer Smoker Inability to Inability to<br />
on insulin Ambulate Transfer<br />
*Reported on HCFA <strong>Medical</strong> <strong>Evidence</strong> <strong>Form</strong><br />
5.5<br />
Figure IV-10<br />
<strong>4.</strong>6<br />
1.7<br />
IV -10<br />
USRDS 1999<br />
Non-cardiovascular patient characteristics among new dialysis patients, 1997. Source: Reference Table<br />
L.15.<br />
respectively), while Black and Asian race were<br />
reported to have a lower prevalence (1<strong>4.</strong>8 percent and<br />
17.6 percent respectively). Similarly, higher<br />
prevalence rates of disease were observed in non-<br />
Hispanics than Hispanics. Although these prevalence<br />
percentages are unadjusted for several important<br />
factors, such as cause of ESRD and age, these<br />
differences may be due to differences in the<br />
prevalence of cardiac risk factors among racial<br />
groups. Alternatively, differences in health seeking<br />
behaviors among groups may lead to differences in<br />
the rates of detection of coronary disease.<br />
Non-Cardiovascular Comorbidity<br />
Indicators Among New Dialysis<br />
<strong>Patient</strong>s<br />
Although the presence of cardiovascular disease<br />
is a useful indicator of comorbidity experienced by a<br />
population, there are several other surrogate ‘health’<br />
markers that can be utilized to describe the well being<br />
of dialysis patients. The <strong>Medical</strong> <strong>Evidence</strong> Report<br />
<strong>Form</strong> provides data on other comorbid conditions and<br />
the functional status of all new ESRD patients.<br />
Furthermore, data are also collected on a number of<br />
important nutritional markers, including serum<br />
albumin and body mass index (calculated <strong>from</strong> dry<br />
weight and height of incident patients). Figure IV-10<br />
describes the prevalence of these “noncardiovascular”<br />
patient characteristics among new<br />
ESRD patients in 1997. Among incident patients, 7.4<br />
percent reportedly had a history of COPD, 5.2<br />
percent had a history of cancer, <strong>4.</strong>6 percent were<br />
reported as unable to ambulate, and 1.7 percent were<br />
unable to transfer independently. These data<br />
illustrate the impact of disease on functional status<br />
among this incident population. Again the reported<br />
prevalence of these comorbid conditions were<br />
substantially lower than that observed in the DMMS<br />
Wave 2 study as shown in Table IV-1.<br />
Figure IV-11 shows the mean serum albumin<br />
concentration before first dialysis by year of<br />
incidence, and the corresponding mean body mass<br />
index (BMI). BMI (a marker of energy nutritional<br />
status) is based on the reported dry weight and height<br />
for each patient. It is an attempt to determine<br />
whether or not an improvement in nutritional status,<br />
among new ESRD patients, has occurred over the 4-<br />
year period due to improved pre-ESRD care. At first<br />
glance, the relatively stable serum albumin<br />
throughout this period suggests that this is not the<br />
case. However, an improvement may be offset by an<br />
acceptance of sicker and older patients for dialysis. It<br />
is known that serum albumin may not be a ‘true’<br />
nutritional indicator as it is influenced by a number of<br />
inflammatory cytokines (Bergstrom). A better<br />
baseline nutritional indicator might be BMI, which<br />
has increased slightly <strong>from</strong> 25.39 kg/m² to 26.05<br />
kg/m² over the same period. These data however are<br />
unadjusted for several important demographic factors<br />
and comorbidities, which may influence the observed<br />
trends.<br />
65
<strong>Patient</strong> <strong>Characteristics</strong> <strong>from</strong> HCFA <strong>Medical</strong> <strong>Evidence</strong> <strong>Form</strong><br />
USRDS 1999 Annual Data Report<br />
3.5<br />
Serum Albumin and Body Mass Index (BMI)<br />
for New ESRD <strong>Patient</strong>s, 1995-98*<br />
Average Serum Albumin (g/dl) Average BMI (kg/m 2 )<br />
27<br />
3.4<br />
3.3<br />
3.2<br />
3.25<br />
3.22<br />
3.20<br />
3.19<br />
25.39<br />
25.52<br />
25.67<br />
26.05<br />
26<br />
25<br />
3.1<br />
3.0<br />
24<br />
1995 1996 1997 1998 1995 1996 1997 1998<br />
IV -11<br />
*Reported on HCFA <strong>Medical</strong> <strong>Evidence</strong> <strong>Form</strong>; 1998 data are through June USRDS 1999<br />
Figure IV-11<br />
Average serum albumin (g/dl) and body mass index (BMI, kg/m 2 ) by year for new ESRD patients as reported<br />
on the HCFA <strong>Medical</strong> <strong>Evidence</strong> <strong>Form</strong>, 1995 through June of 1998. BMI is computed as weight/(height) 2 .<br />
Source: Reference Table L.21.<br />
In 1998, the mean serum albumin before first<br />
chronic dialysis was reported to be 3.2 g/dl (Figure<br />
IV-11). This is far below the normal range of <strong>4.</strong>0-5.0<br />
g/dl. It highlights the fact that, on average, new<br />
patients to dialysis are considered “malnourished”,<br />
which maybe related to many pre-ESRD factors and<br />
the timing of dialysis initiation. As serum albumin is<br />
an important predictor of mortality, both in the short<br />
term and for up to 5 years following dialysis<br />
initiation (Leavey), our attention should be focused<br />
on improving pre-ESRD care and on interventions<br />
that might improve nutritional status. Similarly, in<br />
1998 the average BMI was reported to be 26 kg/m²<br />
(Figure IV-11). This measure has also been shown to<br />
be an independent predictor of mortality among<br />
dialysis patients (Leavey).<br />
Reporting of Comorbid Conditions<br />
Among New Dialysis <strong>Patient</strong>s<br />
It is recognized that inadequate data recording<br />
and the omission of pertinent patient characteristics<br />
may affect the validity of the data collected. The<br />
potential for poor recording of patient characteristics<br />
is increased as the workload of many dialysis units<br />
increases and resources are stretched. Longenecker et<br />
al. have addressed the issue of validity with respect to<br />
data collected <strong>from</strong> the medical evidence form as<br />
compared to data collected <strong>from</strong> the Choices for<br />
Healthy Outcomes in Caring for ESRD study<br />
(CHOICE) (Longenecker). They found that the<br />
sensitivity of reporting for comorbid medical<br />
conditions was poor using data <strong>from</strong> the <strong>Medical</strong><br />
<strong>Evidence</strong> Report <strong>Form</strong>, ranging between 17 percent<br />
to 78 percent. As such, the prevalence of comorbid<br />
medical conditions among new ESRD patients may<br />
be underestimated and reduce the validity of analyses<br />
utilizing these data.<br />
The comparison of the percentage of comorbid<br />
conditions reported in the <strong>Medical</strong> <strong>Evidence</strong> Report<br />
<strong>Form</strong> data with the USRDS (DMMS) data can also<br />
be used to address the question of the validity of the<br />
data collected. The percent agreement (Kappa<br />
statistic) was generally low. It was highest for<br />
cardiovascular conditions and lowest for noncardiovascular<br />
comorbid conditions. However, as<br />
there is no ‘gold standard’ that gives the “true”<br />
prevalence of comorbidity, one can only surmise that<br />
some conditions may be under-reported and others<br />
over-reported. The lack of agreement is of concern<br />
in that estimates of the true burden of disease is<br />
necessary for determining public health policies and<br />
allocating health resources.<br />
66
USRDS 1999 Annual Data Report<br />
<strong>Patient</strong> <strong>Characteristics</strong> <strong>from</strong> HCFA <strong>Medical</strong> <strong>Evidence</strong> <strong>Form</strong><br />
In general, the prevalence of reported comorbid<br />
conditions was substantially lower for the HCFA<br />
<strong>Medical</strong> <strong>Evidence</strong> <strong>Form</strong> data compared to the DMMS<br />
Wave 2 data. As mentioned previously, there is<br />
likely to be substantial variation in the methods and<br />
personnel used to complete the <strong>Medical</strong> <strong>Evidence</strong><br />
Report <strong>Form</strong> whereas the DMMS data collection<br />
instrument is completed in a standardized manner by<br />
detailed medical chart abstraction. It is conceivable<br />
that in many instances the <strong>Medical</strong> <strong>Evidence</strong> Report<br />
<strong>Form</strong> is completed using recall rather than using<br />
medical records. There has been some discussion as<br />
to which measurement technique is likely to be more<br />
clinically relevant. On one hand, the detailed chart<br />
abstraction is likely to be more complete. However,<br />
one may speculate that the use of recall may be more<br />
useful as only the clinically more significant<br />
conditions are recorded. Of interest is the fact that<br />
the presence of various comorbid conditions in both<br />
data sources have been predictive of outcome in the<br />
past. This suggests that either data source can be<br />
used for epidemiological studies. However, there is<br />
also the possibility that the section on comorbid<br />
conditions is simply “passed over” for some patients.<br />
One may speculate that this may not be a random<br />
event and that these practices may vary by facility.<br />
To further explore this possibility, Figure IV-12<br />
shows the distribution of facilities by average number<br />
of comorbid conditions reported per incident patient<br />
during 1995-1997, as recorded on the HCFA <strong>Medical</strong><br />
<strong>Evidence</strong> Report <strong>Form</strong>. In 92 percent of facilities,<br />
the average number of comorbid conditions was one<br />
or more, with 35.4 percent of facilities having an<br />
average of 2 or more. On average, one would expect<br />
similar reporting of comorbidities by most facilities.<br />
However, as shown in Figure IV-13, this is not the<br />
case. In 33 percent of facilities, 20-30 percent of<br />
patients had zero comorbid conditions recorded; in<br />
18.7 percent of facilities, 30 to 40 percent of patients<br />
have zero comorbid conditions reported; in 7.3<br />
percent of facilities, 40 to 50 percent of patients had<br />
zero comorbid conditions recorded, and in a little<br />
over 6 percent of facilities over 50 percent of patients<br />
had no comorbid conditions reported. This suggests<br />
the possibility that there are facilities in which the<br />
section on comorbid conditions may simply not be<br />
completed for a large proportion of patients. As<br />
such, the value of this data source may be<br />
compromised. The overall objective to ultimately<br />
improve the outcome of patients with ESRD by<br />
epidemiological study of these data would be greatly<br />
enhanced by improved reporting of these comorbid<br />
conditions for all patients. There is a need for an<br />
increased awareness of the importance of this type of<br />
data collection in the renal community to achieve<br />
more accurate and complete reporting of comorbid<br />
conditions.<br />
Are Incident <strong>Patient</strong>s in the United<br />
States Being Started on Dialysis<br />
Earlier<br />
Distribution of Facilities by Average Number of<br />
Comorbidities Reported per <strong>Patient</strong>, 1995-97*<br />
60<br />
50<br />
Facilities (%)<br />
55.6<br />
N = 3,250 Facilities **<br />
40<br />
30<br />
31.5<br />
20<br />
10<br />
0<br />
0.2<br />
8.8<br />
Figure IV-12<br />
3.5<br />
0.3 0.1<br />
0
<strong>Patient</strong> <strong>Characteristics</strong> <strong>from</strong> HCFA <strong>Medical</strong> <strong>Evidence</strong> <strong>Form</strong><br />
USRDS 1999 Annual Data Report<br />
40<br />
30<br />
Distribution of Facilities by Percent of <strong>Patient</strong>s<br />
with Zero Comorbidities Reported, 1995-97*<br />
Facilities (%)<br />
27.2<br />
33.0<br />
N = 3,250 Facilities **<br />
20<br />
18.7<br />
10<br />
0<br />
1.9<br />
5.7<br />
0 0+ to<br />
10%<br />
10+ to<br />
20%<br />
20+ to<br />
30%<br />
30+ to<br />
40%<br />
7.3<br />
40+ to<br />
50%<br />
2.8<br />
50+ to<br />
60%<br />
Figure IV-13<br />
1.5<br />
60+ to<br />
70%<br />
0.4 0.7 0.6 0.2<br />
70+ to<br />
80%<br />
80+ to<br />
90%<br />
90+ to<br />
< 100%<br />
Percent of <strong>Patient</strong>s with Zero Comorbidities Reported<br />
*Reported on HCFA <strong>Medical</strong> <strong>Evidence</strong> <strong>Form</strong><br />
IV -13<br />
**Excludes facilities with < 5 new patients in 3 years USRDS 1999<br />
100%<br />
Distribution of facilities by percent of patients with zero comorbidities as reported on the HCFA <strong>Medical</strong><br />
<strong>Evidence</strong> <strong>Form</strong>, 1995-97. Facilities with less than 5 new patients in 1995-97 are excluded. Source: Special<br />
Analysis.<br />
The timing of dialysis initiation among patients<br />
with advanced renal disease is the subject of much<br />
controversy. While there are the protagonists of the<br />
“early start” hypothesis (Mehrotra), available data are<br />
suggestive but not conclusive that earlier initiation of<br />
dialysis confers a survival advantage. On the<br />
<strong>Medical</strong> <strong>Evidence</strong> <strong>Form</strong>, all new ESRD patients<br />
initiating dialysis have a serum creatinine prior to<br />
first dialysis recorded in addition to dry weight and<br />
height. From these data, an individual’s residual<br />
renal function may be estimated.<br />
Figure IV-14 allows the comparison of the mean<br />
serum creatinine to the estimated glomerular<br />
filtration rate (GFR) by the Modification of Diet in<br />
Serum Creatinine and GFR<br />
for New ESRD <strong>Patient</strong>s by Age Group, 1995-97*<br />
15<br />
Average Serum Creatinine (mg/dl)<br />
Average GFR (ml/min)**<br />
15<br />
10<br />
10.8<br />
8.7<br />
7.5<br />
7.0<br />
6.6<br />
7.1<br />
7.7 8.0<br />
10<br />
5<br />
5<br />
0<br />
20-44 45-64 65-74 75+ 20-44 45-64 65-74 75+<br />
Age<br />
Age<br />
*Reported on HCFA <strong>Medical</strong> <strong>Evidence</strong> <strong>Form</strong><br />
**MDRD <strong>Form</strong>ula<br />
Figure IV-14<br />
0<br />
IV -14<br />
USRDS 1999<br />
Average serum creatinine and GFR for new ESRD patients as reported on the HCFA <strong>Medical</strong> <strong>Evidence</strong><br />
<strong>Form</strong> by age on first service date, 1995-97. Glomerular filtration rate (GFR) is computed using MDRD<br />
formula. Source: Reference Table L.23.<br />
68
USRDS 1999 Annual Data Report<br />
<strong>Patient</strong> <strong>Characteristics</strong> <strong>from</strong> HCFA <strong>Medical</strong> <strong>Evidence</strong> <strong>Form</strong><br />
Serum Creatinine and Weight<br />
for New ESRD <strong>Patient</strong>s by Year, 1995-98*<br />
10<br />
Average Serum Creatinine (mg/dl)<br />
Average Weight (kg)<br />
80<br />
9<br />
8.7<br />
8.5<br />
71.3 71.8 72.1<br />
73.0<br />
70<br />
8<br />
8.1<br />
8.0<br />
7<br />
60<br />
6<br />
50<br />
1995 1996 1997 1998 1995 1996 1997 1998<br />
IV -15<br />
*Reported on HCFA <strong>Medical</strong> <strong>Evidence</strong> <strong>Form</strong>; 1998 data are through June<br />
USRDS 1999<br />
Figure IV-15<br />
Average serum creatinine (mg/dl) and weight (kg) for new ESRD patients by year as reported on the HCFA<br />
<strong>Medical</strong> <strong>Evidence</strong> <strong>Form</strong>, incident in 1995-97. Source: Reference Table L.21.<br />
Renal Disease Study Group (MDRD) formula<br />
(Levey) in all incident patients at dialysis initiation<br />
by age group. Increasing age is associated with a<br />
lower mean serum creatinine and a higher level of<br />
residual renal function. Thus older patients are<br />
initiated on dialysis at higher levels of residual<br />
function and lower serum creatinine. A plausible<br />
explanation is that older patients are initiated on<br />
dialysis earlier because of medical comorbidities or<br />
the effects of uremia (as they may be less tolerant of<br />
uremic complications than younger patients).<br />
A comparison of mean serum creatinine and<br />
weight for all incident patients by year of incidence<br />
(Figure IV-15) addresses the question “Are incident<br />
patients in the United States starting dialysis Early”<br />
From 1995 to 1998, the mean serum creatinine prior<br />
to dialysis initiation has decreased <strong>from</strong> 8.7 to 8.0.<br />
Although this may imply earlier initiation of dialysis<br />
among new patients in recent years, the acceptance of<br />
older and more malnourished patients (with less<br />
muscle mass) may also explain the observed trend.<br />
However, the average weight of patients has<br />
increased <strong>from</strong> 1995-1998, suggesting that there may<br />
be a trend toward earlier initiation of dialysis.<br />
Pre-Dialysis Erythropoeitin<br />
Utilization Among New ESRD<br />
<strong>Patient</strong>s<br />
The introduction of recombinant erythropoeitin<br />
(EPO) has resulted in substantial changes in the<br />
treatment of anemia among dialysis patients.<br />
Nevertheless, anemia remains a common problem<br />
among patients with advanced renal insufficiency not<br />
yet on dialysis and new ESRD patients (USRDS<br />
1995). Figure IV-16 describes the utilization of EPO<br />
before ESRD among new ESRD patients by age and<br />
gender <strong>from</strong> the <strong>Medical</strong> <strong>Evidence</strong> Report <strong>Form</strong>.<br />
EPO utilization is seen to increase with increasing<br />
age. Gender differences also exist: with females<br />
more likely to receive EPO than their male<br />
counterparts. Figure IV-17 serves to illustrate<br />
differences in EPO utilization among racial and<br />
ethnic groups. A greater fraction of Asian and White<br />
ESRD patients were receiving EPO prior to dialysis<br />
initiation compared to other racial groups.<br />
Differences in health seeking behaviors or in referral<br />
patterns may be responsible for the observed<br />
differences in EPO use. Similarly, EPO use is seen<br />
to be less common among Hispanics than non-<br />
Hispanics.<br />
69
<strong>Patient</strong> <strong>Characteristics</strong> <strong>from</strong> HCFA <strong>Medical</strong> <strong>Evidence</strong> <strong>Form</strong><br />
USRDS 1999 Annual Data Report<br />
EPO Use before ESRD by Age and Gender<br />
for New ESRD <strong>Patient</strong>s, 1995-97*<br />
40<br />
Receiving EPO before ESRD (%)<br />
30<br />
22.9<br />
23.8 2<strong>4.</strong>6 23.9<br />
26.0<br />
22.5<br />
20<br />
10<br />
0<br />
20-44 45-64 65-74 75+ Female Male<br />
Age<br />
Gender<br />
*Reported on HCFA <strong>Medical</strong> <strong>Evidence</strong> <strong>Form</strong><br />
Figure IV-16<br />
IV -16<br />
USRDS 1999<br />
Erythropoeitin (EPO) use before ESRD by age and gender for new ESRD patients as reported on the HCFA<br />
<strong>Medical</strong> <strong>Evidence</strong> <strong>Form</strong>, 1995-97. Source: Special Analysis.<br />
Employment Status Among New<br />
Dialysis <strong>Patient</strong>s: Before and at<br />
Initiation of Dialysis<br />
Employment rates are low among new ESRD<br />
patients for many reasons. The acceptance of older<br />
patients with a greater prevalence of comorbid<br />
medical conditions contributes greatly to these low<br />
employment rates. Figure IV-18 compares employment<br />
status among patients ages 20-64 years, 6<br />
months prior to and at the initiation of dialysis, <strong>from</strong><br />
the <strong>Medical</strong> <strong>Evidence</strong> Report <strong>Form</strong>. Among the 90<br />
percent of patients with information about their<br />
employment status at 6 months prior to dialysis<br />
initiation, approximately 32 percent were reportedly<br />
employed, 6 percent were homemakers, 1 percent<br />
were students, and 27 percent were unemployed.<br />
Another 33 percent were retired because of age or<br />
their medical condition, and 1 percent were on<br />
40<br />
EPO Use before ESRD for New ESRD <strong>Patient</strong>s<br />
by Race and Hispanic Ethnicity, 1995-97*<br />
Receiving EPO before ESRD (%)<br />
30<br />
20<br />
26.1<br />
19.9<br />
30.1<br />
21.0 21.7 21.6<br />
2<strong>4.</strong>4<br />
10<br />
0<br />
White Black Asian Native Other Hispanic Non-<br />
American<br />
Hispanic<br />
IV -17<br />
*Reported on HCFA <strong>Medical</strong> <strong>Evidence</strong> <strong>Form</strong><br />
USRDS 1999<br />
Figure IV-17<br />
Erythropoeitin (EPO) use before ESRD by race and Hispanic ethnicity for new ESRD patients as reported on<br />
the HCFA <strong>Medical</strong> <strong>Evidence</strong> <strong>Form</strong>, 1995-97. Source: Special Analysis.<br />
70
USRDS 1999 Annual Data Report<br />
<strong>Patient</strong> <strong>Characteristics</strong> <strong>from</strong> HCFA <strong>Medical</strong> <strong>Evidence</strong> <strong>Form</strong><br />
Prior vs. Current Employment among New ESRD<br />
<strong>Patient</strong>s, Ages 20-64, 1997*<br />
36<br />
30<br />
24<br />
18<br />
12<br />
6<br />
0<br />
New <strong>Patient</strong>s (%)<br />
32<br />
20<br />
27<br />
32<br />
27<br />
30<br />
6<br />
7<br />
Figure IV-18<br />
6 months before ESRD (missing = 10%)<br />
At onset of ESRD (missing = 4%)<br />
Employed** Unemployed Retired, Retired Homemaker <strong>Medical</strong> Student<br />
Disabled by Age Leave<br />
*Reported on HCFA <strong>Medical</strong> <strong>Evidence</strong> <strong>Form</strong>.<br />
IV -18<br />
**Includes part-time and full-time.<br />
USRDS 1999<br />
<strong>Patient</strong>s with employment status missing are excluded.<br />
6<br />
6<br />
1<br />
5<br />
1<br />
0.5<br />
Prior and current employment among new ESRD patients (ages 20-64) as reported on the HCFA <strong>Medical</strong><br />
<strong>Evidence</strong> <strong>Form</strong>, 1997. Prior is defined as employment status 6 months prior to ESRD diagnosis. Current is<br />
defined as employment status at onset of ESRD. Employed consists of both part-time and full-time<br />
employed patients. <strong>Patient</strong>s with employment status missing are excluded. Source: Reference Tables L.13<br />
and L.1<strong>4.</strong><br />
medical leave of absence.<br />
At dialysis initiation, the percent employed<br />
decreased by 12 percentage points or by one third.<br />
This change is explained by an increase in the groups<br />
labeled as unemployed, retired for disability, and<br />
medical leave of absence. Improved pre-ESRD care,<br />
particularly during the last 6 months, and<br />
achievement of a better health status may help<br />
improve employment rates in this patient population.<br />
Summary<br />
Data collected by the new <strong>Medical</strong> <strong>Evidence</strong><br />
Report <strong>Form</strong> are useful in describing the<br />
characteristics of new ESRD patients. Such<br />
information may also be used to improve<br />
comparisons of outcomes between treatments and<br />
among facilities as part of quality assurance<br />
programs. This ESRD Registration <strong>Form</strong> offers a<br />
unique opportunity to describe the health status of the<br />
entire incident ESRD population. Despite the<br />
advantages available <strong>from</strong> this large database, the<br />
limitations must also be recognized. Underreporting<br />
of medical conditions by facilities will underestimate<br />
the true prevalence of disease among patients.<br />
Imprecise estimates will reduce the validity of the<br />
data and the derived conclusions. Given the<br />
enormous potential afforded to the renal community<br />
<strong>from</strong> data collected on patients <strong>from</strong> the <strong>Medical</strong><br />
<strong>Evidence</strong> Reporting <strong>Form</strong>, all members of the renal<br />
community should be aware of its importance and<br />
ensure that there is full and accurate completion of<br />
this form.<br />
References<br />
Bergstrom J, Lindholm B. Malnutrition, Cardiac<br />
Disease, and Mortality: An Integrated Point of<br />
View. Am J Kidney Dis 1998; 32: 834-8<strong>4.</strong><br />
Bloembergen WE: Cardiac Disease in Chronic<br />
Uremia: Epidemiology. AdvRRT 1997; 4: 185-<br />
193.<br />
71
<strong>Patient</strong> <strong>Characteristics</strong> <strong>from</strong> HCFA <strong>Medical</strong> <strong>Evidence</strong> <strong>Form</strong><br />
USRDS 1999 Annual Data Report<br />
Chaveau P, Chadefaux B, Coude M. et al.<br />
Hyperhomocysteinemia, a risk factor for<br />
atherosclerosis in chronic uremic patients. Kidney<br />
Int 1993; 43 (suppl 44): S72-S77.<br />
Gutman RA, Stead WW, Robinson RR. Physical<br />
activity and employment status of patients on<br />
maintenance dialysis. N Engl J Med 1981; 304:<br />
309-313.<br />
Leavey SF, Strawderman RL, Jones CA, Port FK,<br />
Held PJ. Simple nutritional indicators as<br />
independent predictors of mortality in<br />
hemodialysis patients Am J Kidney Dis 31 1998;<br />
31 997-1006.<br />
Levey AS, Bosch JP, Breyer Lewis J, Greene T,<br />
Rogers N, Roth D. MDRD Study Group: A more<br />
accurate method to estimate glomerular filtration<br />
rate <strong>from</strong> serum creatinine: A new prediction<br />
equation. Ann Intern Med 1999; 130: 461-470.<br />
Lindner A, Charra B, Sherrard DJ, et al: Accelerated<br />
atherosclerosis in prolonged maintenance<br />
hemodialysis. N Engl J Med 1974; 290: 697-701.<br />
Longenecker JC, Klag MJ, Coresh J, Levey AS,<br />
Martin AA, Fink NE, Powe NR Validation of<br />
comorbid conditions on the ESRD <strong>Medical</strong><br />
<strong>Evidence</strong> Report by medical record review: The<br />
choices for healthy outcomes in caring for ESRD<br />
(CHOICE) study. J Am Soc Nephrol 1998;<br />
9:218A.<br />
incident hemodialysis patients. Am J Kidney Dis<br />
20 (Suppl 2): 32-38 1992.<br />
U.S. Renal Data System, USRDS 1995 Annual Data<br />
Report. The National Institutes of Health,<br />
National Institutes of Diabetes and Digestive and<br />
Kidney Diseases, Bethesda, MD, April 1995.<br />
U.S. Renal Data System, USRDS 1996 Annual Data<br />
Report. The National Institutes of Health,<br />
National Institutes of Diabetes and Digestive and<br />
Kidney Diseases, Bethesda, MD, April 1996.<br />
U.S. Renal Data System, USRDS 1997 Annual Data<br />
Report. The National Institutes of Health,<br />
National Institutes of Diabetes and Digestive and<br />
Kidney Diseases, Bethesda, MD, April 1997.<br />
U.S. Renal Data System, USRDS 1998 Annual Data<br />
Report. The National Institutes of Diabetes and<br />
Digestive and Kidney Diseases, Bethesda, MD,<br />
April 1998.<br />
Witzum JL, Steinberg D: Role of oxidized low<br />
density lipoprotein in atherogenesis. J Clin Invest<br />
1991; 88:1785-1792.<br />
Mehrotra R, Nolph KD. Argument for timely<br />
initiation of dialysis. J Am Soc Nephrol 1998;<br />
9: 596-599.<br />
Stack A, Bloembergen WE. Predictors and clinical<br />
correlates of coronary artery disease among<br />
incident U.S. dialysis patients. Am Soc Nephrol<br />
1998a; 9: 227A.<br />
Stack A, Bloembergen WE. Congestive Heart<br />
Failure among incident U.S. dialysis patients:<br />
predictors and clinical correlates. Am Soc of<br />
Nephrol 1998b; 9: 226A.<br />
Special Report <strong>from</strong> the National Kidney Foundation<br />
Task Force on the Cardiovascular Disease:<br />
Controlling the Epidemic of Cardiovascular<br />
Disease in Chronic Renal Disease: What do we<br />
know What do we need to know Where do we<br />
go <strong>from</strong> here Am J Kidney Dis 1998 32: Suppl<br />
3.<br />
U.S. Renal Data System Comorbid conditions and<br />
correlations with mortality risk among 3,399<br />
72