2009 ADR v2 Atlas of ESRD - United States Renal Data System
2009 ADR v2 Atlas of ESRD - United States Renal Data System
2009 ADR v2 Atlas of ESRD - United States Renal Data System

Create successful ePaper yourself
Turn your PDF publications into a flip-book with our unique Google optimized e-Paper software.
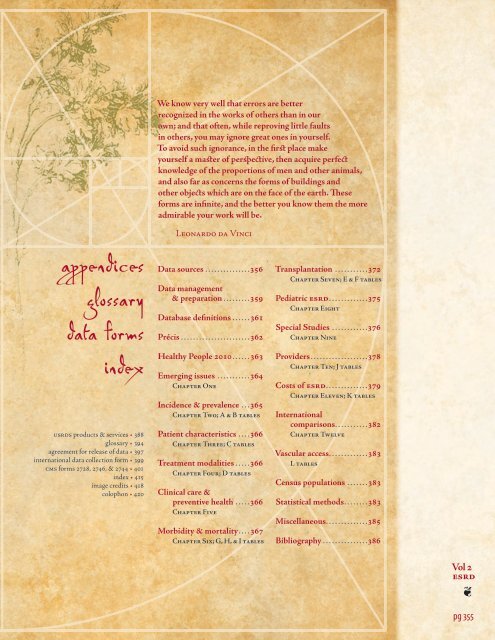
appendices<br />
glossary<br />
data forms<br />
index<br />
USRDS products & services • 388<br />
glossary • 394<br />
agreement for release <strong>of</strong> data • 397<br />
international data collection form • 399<br />
CMS forms 2728, 2746, & 2744 • 401<br />
index • 415<br />
image credits • 418<br />
colophon • 420<br />
We know very well that errors are better<br />
recognized in the works <strong>of</strong> others than in our<br />
own; and that <strong>of</strong>ten, while reproving little faults<br />
in others, you may ignore great ones in yourself .<br />
To avoid such ignorance, in the first place make<br />
yourself a master <strong>of</strong> perspective, then acquire perfect<br />
knowledge <strong>of</strong> the proportions <strong>of</strong> men and other animals,<br />
and also far as concerns the forms <strong>of</strong> buildings and<br />
other objects which are on the face <strong>of</strong> the earth . These<br />
forms are infinite, and the better you know them the more<br />
admirable your work will be .<br />
LEONARDO DA VINCI<br />
<strong>Data</strong> sources . . . . . . . . . . . . . . .356<br />
<strong>Data</strong> management<br />
& preparation . . . . . . . . .359<br />
<strong>Data</strong>base definitions . . . . . .361<br />
Précis . . . . . . . . . . . . . . . . . . . . . . .362<br />
Healthy People 2010 . . . . . .363<br />
Emerging issues . . . . . . . . . . .364<br />
Chap
5<br />
App A<br />
pg 356<br />
In this appendix we present details on the USRDS<br />
database, its standardized working datasets and<br />
specialized code definitions, and our common data<br />
processing practices. We also describe the statistical<br />
methods used in this <strong>ADR</strong>. The Researcher’s guide to<br />
the USRDS database, available online, provides additional information<br />
about the database and Standard Analysis Files.<br />
<strong>Data</strong> sources<br />
The USRDS maintains a stand-alone database with data on diagnoses<br />
and demographic characteristics <strong>of</strong> <strong>ESRD</strong> patients, along with<br />
biochemical data, dialysis claims, and information on treatment<br />
and payor histories, hospitalization events, deaths, physician/supplier<br />
services, and providers.<br />
REMIS/REBUS/PMMIS DATABASE<br />
The major source <strong>of</strong> <strong>ESRD</strong> patient information for the USRDS is the<br />
<strong>Renal</strong> Beneficiary and Utilization <strong>System</strong> (REBUS) <strong>of</strong> the Centers for<br />
Medicare and Medicaid Services (CMS, formerly HCFA), adopted in<br />
1995 as the On-Line Transaction Processing system from the previous<br />
Program Management and Medical Information <strong>System</strong> (PMMIS)<br />
database. The REBUS/PMMIS database contains demographic, diagnosis,<br />
and treatment history information for all Medicare beneficiaries<br />
with <strong>ESRD</strong>. The database has also been expanded to include<br />
non-Medicare patients, as discussed later in this appendix. Having<br />
advanced its database technology, CMS migrated the REBUS database<br />
into an Oracle relational database in the fall <strong>of</strong> 2003, including all<br />
patients who were alive and had <strong>ESRD</strong> as <strong>of</strong> January 1, 1995, or incident<br />
after this date. This database is known as the <strong>Renal</strong> Management<br />
Information <strong>System</strong> (REMIS).<br />
CMS regularly updates the REMIS/REBUS/PMMIS database, using<br />
the Medicare Enrollment <strong>Data</strong>base (EDB), Medicare inpatient and<br />
outpatient claims, the Organ Procurement and Transplantation<br />
Network (OPTN) transplant database, <strong>ESRD</strong> Medical Evidence forms<br />
(2728) provided by the <strong>ESRD</strong> networks, and <strong>ESRD</strong> Death Notification<br />
forms (2746) obtained from renal providers, as well as the Standard<br />
Information Management <strong>System</strong> (SIMS) database <strong>of</strong> the <strong>ESRD</strong><br />
networks. CMS has also established data integrity rules to ensure<br />
accurate identification <strong>of</strong> patients in the SIMS and CMS databases.<br />
Each <strong>ESRD</strong> patient is now identified with a unique patient identification<br />
number common to both databases, ensuring that data on<br />
all patients are consistently managed over time.<br />
CMS MEDICARE ENROLLMENT DATABASE<br />
The Medicare Enrollment <strong>Data</strong>base (EDB) is the designated repository<br />
<strong>of</strong> all Medicare beneficiary enrollment and entitlement data,<br />
and provides current and historical information on residence, Medi-<br />
care as secondary payor (MSP) and employer group health plan<br />
(EGHP) status, and Health Insurance Claim/Beneficiary Identification<br />
Code (HIC/BIC) cross-referencing.<br />
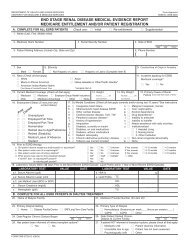
<strong>ESRD</strong> MEDICAL EVIDENCE FORM (CMS 2728)<br />
The <strong>ESRD</strong> Medical Evidence (ME) form is used to register patients at<br />
the onset <strong>of</strong> <strong>ESRD</strong>, and must be submitted by dialysis or transplant<br />
providers within 45 days <strong>of</strong> initiation. The form establishes Medicare<br />
eligibility for individuals previously not Medicare beneficiaries,<br />
reclassifies previously eligible beneficiaries as <strong>ESRD</strong> patients, and provides<br />
demographic and diagnostic information on all new patients.<br />
The CMS, USRDS, and renal research communities rely on the form to<br />
ascertain patient demographics, primary diagnosis, comorbidities,<br />
and biochemical test results at the time <strong>of</strong> <strong>ESRD</strong> initiation. Before<br />
1995, units were required to file the Medical Evidence form only for<br />
Medicare-eligible patients. Since the 1995 revision, however, providers<br />
are required to complete the form for all new <strong>ESRD</strong> patients.<br />
The third major revision <strong>of</strong> the ME form, released in May, 2005,<br />
was intended to remedy several shortcomings found in the 1995<br />
form and its earlier version. Key additions target pre-<strong>ESRD</strong> care and<br />
vascular access use, and additional new fields collect information<br />
on glycosylated hemoglobin and lipid testing, on the frequency <strong>of</strong><br />
hemodialysis sessions, and on whether patients are informed <strong>of</strong><br />
transplant options. This new form will help federal and private<br />
researchers gain better insights into the health and care <strong>of</strong> <strong>ESRD</strong><br />
patients prior to their entry into the program.<br />
This form is the only source <strong>of</strong> information about the cause <strong>of</strong><br />
a patient’s <strong>ESRD</strong>. Because the list <strong>of</strong> diseases has been revised, the<br />
USRDS stores the codes from each version so that detail is not lost<br />
through conversion <strong>of</strong> one set <strong>of</strong> codes to the other.<br />
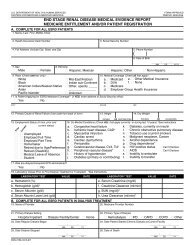
<strong>ESRD</strong> DEATH NOTIFICATION FORM (CMS 2746)<br />
The <strong>ESRD</strong> Death Notification form is used to report the death <strong>of</strong> <strong>ESRD</strong><br />
patients. According to CMS policy, this form must be submitted by<br />
dialysis or transplant providers within 30 days <strong>of</strong> a patient’s death,<br />
and provides the date and causes <strong>of</strong> death (primary and secondary),<br />
reasons for discontinuation <strong>of</strong> renal replacement therapy, if applicable,<br />
and evidence <strong>of</strong> hospice care prior to death. It is the primary<br />
source <strong>of</strong> death information for CMS and the USRDS, identifying<br />
more than 99 percent <strong>of</strong> deaths. The USRDS also utilizes the Social<br />
Security Administration’s (SSA) Death Master File as a supplemental<br />
data source for ascertaining death in a small group <strong>of</strong> lost-to-followup<br />
<strong>ESRD</strong> patients; this file, however, identifies only all-cause deaths.<br />
OPTN TRANSPLANT DATABASE<br />
In the early 1980s CMS began collecting data on all Medicare kidney<br />
transplants. In 1988, the <strong>United</strong> Network <strong>of</strong> Organ Sharing (now
OPTN) was created to provide a national system for allocating donor<br />
organs. OPTN also began collecting data on all transplants. These<br />
two efforts were consolidated in 1994, and OPTN became the single<br />
source <strong>of</strong> data on transplant donors and recipients.<br />
The CMS and OPTN transplant data files overlap for 1988–1993,<br />
and some patients with ME forms indicating transplant as the initial<br />
modality are not included in either file. To resolve conflicts among<br />
the three sources, the USRDS adopts the following procedure:<br />
4 OPTN transplants are accepted into the database.<br />
4 CMS transplants before 1988 are accepted.<br />
4 CMS transplants from 1988 to 1993 are accepted if there is no<br />
OPTN transplant record for that patient within 30 days <strong>of</strong> the<br />
CMS transplant.<br />
4 Transplants indicated on ME forms are accepted if there is<br />
no previously accepted record <strong>of</strong> a transplant for that patient<br />
within 30 days <strong>of</strong> the date listed on the ME form.<br />
CMS STANDARD ANALYTICAL FILES (SAFs)<br />
These files contain billing data from final action claims, submitted<br />
by Medicare beneficiaries with <strong>ESRD</strong>, in which all adjustments are<br />
resolved. For inpatient/outpatient institutional claims we use the<br />
following data: inpatient, 100 percent SAF; outpatient, 100 percent<br />
SAF; home health agency (HHA), 100 percent SAF; hospice, 100 percent<br />
SAF; and skilled nursing facility (SNF), 100 percent SAF. For physician/supplier<br />
claims, we use: physician/supplier, 100 percent SAF;<br />
and durable medical equipment (DME), 100 percent SAF.<br />
CMS SAFs are updated each quarter through June <strong>of</strong> the next year,<br />
when the annual files are finalized. <strong>Data</strong>sets for the current year<br />
are created six months into the year and updated quarterly until<br />
finalized at 18 months, after which they are not updated to include<br />
late arriving claims. Annual files are thus approximately 98 percent<br />
complete. The USRDS <strong>2009</strong> <strong>ADR</strong> includes all claims up to December<br />
31, 2007. Patient-specific demographic and diagnosis information,<br />
however, includes data as recent as October, 2008.<br />
Inpatient transplant and outpatient dialysis claims records are<br />
used to identify new <strong>ESRD</strong> patients for whom no ME form has been<br />
filed. These patients, primarily non-Medicare patients, or beneficiaries<br />
who develop <strong>ESRD</strong> while on Medicare because <strong>of</strong> age or disability,<br />
will eventually be entered into the REMIS/REBUS/PMMIS — and<br />
hence the USRDS — database through the claims records. For patients<br />
without ME forms these claims are the only reliable information<br />
from which to determine first <strong>ESRD</strong> service dates. These paid claims<br />
records are, however, only a supplement to, rather than a replacement<br />
<strong>of</strong>, other sources <strong>of</strong> information on incidence and prevalence.<br />
The problem <strong>of</strong> timely identification has lessened since the revision<br />
<strong>of</strong> the ME form in April 1995, and the amended <strong>ESRD</strong> entitlement<br />
policy that now requires the form to be submitted for all <strong>ESRD</strong><br />
patients regardless <strong>of</strong> insurance and eligibility status.<br />
CMS 5 PERCENT STANDARD ANALYTICAL FILES (SAFs)<br />
These files contain billing data from final action claims, submitted<br />
by Medicare beneficiaries, in which all adjustments have been<br />
resolved. The claims data are selected randomly from general Medicare<br />
claims (i.e. final action claims) using five combinations <strong>of</strong> the<br />
last two digits <strong>of</strong> the CMS Health Insurance Claims (HIC) number:<br />
05, 20, 45, 70, and 95. Since the same two-digit numbers are used<br />
each year to create the 5 percent general Medicare SAFs, one should<br />
expect to see the same beneficiaries in these annual datasets. These<br />
claims are categorized into the inpatient (IP), outpatient (OP), home<br />
health agency (HHA), hospice (HS), skilled nursing facility (SNF),<br />
physician/supplier (PB), and durable medical equipment (DME) SAFs.<br />
The files are updated each quarter through June <strong>of</strong> the next year,<br />
when the annual files are finalized. <strong>Data</strong>sets for the current year<br />
are created six months into the year and updated quarterly until<br />
finalized at 18 months, after which they are not updated to include<br />
late arriving claims. Annual files are thus approximately 98 percent<br />
complete. The USRDS <strong>2009</strong> <strong>ADR</strong> includes all claims up to December<br />
31, 2007.<br />
STANDARD INFORMATION MANAGEMENT<br />
SYSTEM (SIMS) DATABASE (<strong>ESRD</strong> NETWORKS)<br />
The USRDS continues to collaborate with CMS and the <strong>ESRD</strong> networks<br />
to address data tracking issues relating to non-Medicare <strong>ESRD</strong><br />
patients. Past <strong>ADR</strong>s have documented the lack <strong>of</strong> consistent Medicare<br />
claims data among these patients. Working solely with data from<br />
the ME form, the USRDS could establish the first <strong>ESRD</strong> service date,<br />
but could not generate a more detailed treatment history. With the<br />
integration <strong>of</strong> the SIMS event data into the USRDS database, however,<br />
we can now address issues in the non-Medicare <strong>ESRD</strong> population<br />
such as the large and growing number <strong>of</strong> lost-to-follow-up patients,<br />
and look as well at patients for whom there previously were no data<br />
on initial modality or death. This data integration is detailed in the<br />
section on data management and preparation.<br />
CMS DIALYSIS FACILITY COMPARE DATA<br />
The USRDS uses the CMS Dialysis Facility Compare data to define<br />
chain and ownership information for each renal facility. Prior to<br />
the 2003 <strong>ADR</strong>, similar data were extracted from the Independent<br />
<strong>Renal</strong> Facility Cost Report (CMS 265-94).<br />
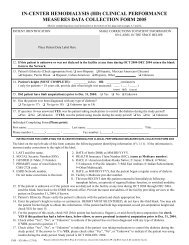
<strong>ESRD</strong> CLINICAL PERFORMANCE MEASURES PROJECT<br />
CMS developed its <strong>ESRD</strong> Clinical Performance Measures Project (CPM,<br />
formerly the <strong>ESRD</strong> Core Indicators Project) to collect information<br />
on the quality <strong>of</strong> care provided to dialysis patients. The data originate<br />
from data collection forms completed by staff at primary care<br />
facilities, and focus on dialysis adequacy measures, anemia management,<br />
and vascular access. Additional clinical parameters such as<br />
albumin are available as well. These data have been collected annually<br />
since 1994, using a random sample <strong>of</strong> adult (age 18 and older)<br />
patients alive and on dialysis at the end <strong>of</strong> each calendar year; on<br />
average, roughly 8,500 adult in-center hemodialysis patients and<br />
1,500 peritoneal dialysis patients are surveyed each year. <strong>Data</strong> collection<br />
for all hemodialysis patients age 12–17 was begun in 2000. Collection<br />
was expanded in 2002 to all in-center hemodialysis patients<br />
younger than 18, and in 2005 to all peritoneal dialysis patients <strong>of</strong><br />
this age. The USRDS Coordinating Center, in collaboration with<br />
CMS, is now making these <strong>ESRD</strong> CPM data available to the general<br />
research community.<br />
MEDICARE CURRENT BENEFICIARY SURVEY (MCBS)<br />
The Medicare Current Beneficiary Survey is a longitudinal survey<br />
<strong>of</strong> a nationally representative sample <strong>of</strong> aged, disabled, and institutionalized<br />
Medicare beneficiaries. The MCBS contains information<br />
on the health status, health care use and expenditures, drug<br />
prescriptions, health insurance coverage, and socioeconomic and<br />
demographic characteristics <strong>of</strong> the entire spectrum <strong>of</strong> Medicare<br />
beneficiaries. <strong>Data</strong> are made available by CMS in two datasets: Access<br />
to Care (1992–2006), and Cost and Use (1992–2005), with the 2006<br />
and 2005 files, respectively, the latest updates for the <strong>2009</strong> <strong>ADR</strong>.<br />
In the fall <strong>of</strong> 1991, the MCBS began to be conducted three times<br />
per calendar year (winter, summer, and fall), and in 1994 a sample<br />
rotation scheme was introduced. Survey participants are kept in<br />
<strong>Data</strong> sources<br />
4 APPENDIx A: ANAlyTICAl METHODS<br />
<strong>2009</strong> USRDS Annual <strong>Data</strong> Report<br />
Vol 2<br />
esrd<br />
5<br />
App A<br />
pg 357
5<br />
App A<br />
pg 358<br />
<strong>ESRD</strong> networks<br />
Network 1<br />
Connecticut, Maine,<br />
Massachusetts, New Hampshire,<br />
Rhode Island, Vermont<br />
<strong>ESRD</strong> Network <strong>of</strong> New England, Inc.<br />
30 Hazel Terrace<br />
Woodbridge, CT 06525<br />
phone 203.387.9332<br />
fax 203.389.9902<br />
Network 5<br />
Virginia, West Virginia,<br />
Maryland, District <strong>of</strong> Columbia<br />
Mid-Atlantic <strong>Renal</strong> Coalition<br />
1527 Huguenot Road<br />
Midlothian, VA 23113<br />
phone 804.794.3757<br />
fax 804.794.3793<br />
Network 9/10<br />
Illinois, Indiana,<br />
Kentucky, Ohio<br />
The <strong>Renal</strong> Network, Inc.<br />
911 East 86th Street, Suite 202<br />
Indianapolis, IN 46240<br />
phone 317.255.8265<br />
fax 317.255.8291<br />
Network 14<br />
Texas<br />
<strong>ESRD</strong> Network <strong>of</strong> Texas, Inc.<br />
4040 McEwen, Suite 350<br />
Dallas, TX 75244<br />
phone 972.503.3215<br />
fax 972.503.3219<br />
Network 18<br />
Southern California<br />
Southern California <strong>Renal</strong><br />
Disease Council, Inc.<br />
6255 Sunset Boulevard, Suite 2211<br />
Los Angeles, CA 90028<br />
phone 323.962.2020<br />
fax 323.962.2891<br />
Network 2<br />
New York<br />
CKD Network for New York<br />
1979 Marcus Avenue, Suite 105<br />
Lake Success, NY 11042-1002<br />
phone 516.209.5578<br />
fax 516.326.8929<br />
Network 6<br />
Georgia, North Carolina,<br />
South Carolina<br />
Southeastern Kidney Council, Inc.<br />
1000 St. Albans Drive, Suite 270<br />
Raleigh, NC 27609<br />
phone 919.855.0882<br />
fax 919.855.0753<br />
Network 11<br />
Minnesota, Michigan,<br />
North Dakota,<br />
South Dakota, Wisconsin<br />
<strong>Renal</strong> Network <strong>of</strong> the Upper Midwest, Inc.<br />
1360 Energy Park Drive, Suite 200<br />
St. Paul, MN 55108<br />
phone 651.644.9877<br />
fax 651.644.9853<br />
Network 15<br />
Arizona, Colorado, Nevada,<br />
New Mexico, Utah, Wyoming<br />
Intermountain <strong>ESRD</strong> Network, Inc.<br />
1301 Pennsylvania Street, Suite 750<br />
Denver, CO 80203-5012<br />
phone 303.831.8818<br />
fax 303.860.8392<br />
Network 1 Connecticut, Maine, Massachusetts,<br />
New Hampshire, Rhode Island, Vermont<br />
Network 2 New York<br />
Network 3 New Jersey, Puerto Rico, Virgin<br />
Islands<br />
Network 4 Delaware, Pennsylvania<br />
Network 5 Maryland, Virginia, Washington D.C.,<br />
West Virginia<br />
Network 6 Georgia, North Carolina, South<br />
Carolina<br />
Network 7 Florida<br />
Network 8 Alabama, Mississippi, Tennessee<br />
Network 9 Indiana, Kentucky, Ohio<br />
Network 3<br />
New Jersey, Puerto Rico,<br />
Virgin Islands<br />
TransAtlantic <strong>Renal</strong> Council<br />
Cranbury Gates Office Park<br />
109 S. Main Street, Suite 21<br />
Cranbury, NJ 08512–3174<br />
phone 609.490.0310<br />
fax 609.490.0835<br />
Network 7<br />
Florida<br />
FMQAI: The Florida <strong>ESRD</strong> Network<br />
5201 W Kennedy Blvd, Suite 900<br />
Tampa, FL 33609<br />
phone 813.383.1530<br />
fax 813.354.1514<br />
Network 12<br />
Iowa, Kansas,<br />
Missouri, Nebraska<br />
Heartland Kidney Network<br />
7505 NW Tiffany Springs Parkway,<br />
Suite 230<br />
Kansas City, MO 64153<br />
phone 816.880.9990<br />
fax 816.880.9088<br />
Network 16<br />
Alaska, Idaho, Montana,<br />
Oregon, Washington<br />
Northwest <strong>Renal</strong> Network<br />
4702 42nd Avenue, SW<br />
Seattle, WA 98116<br />
phone 206.923.0714<br />
fax 206.923.0716<br />
Network 10 Illinois<br />
Network 11 Michigan, Minnesota, North Dakota,<br />
South Dakota, Wisconsin<br />
Network 12 Iowa, Kansas, Missouri, Nebraska<br />
Network 13 Arkansas, Louisiana, Oklahoma<br />
Network 14 Texas<br />
Network 15 Arizona, Colorado, Nevada, New<br />
Mexico, Utah, Wyoming<br />
Network 16 Alaska, Idaho, Montana, Oregon,<br />
Washington<br />
Network 17 American Samoa, Northern<br />
California, Guam, Hawaii<br />
Network 18 Southern California<br />
17/<br />
18<br />
16<br />
16<br />
Network 4<br />
Delaware, Pennsylvania<br />
<strong>ESRD</strong> Network 4, Inc.<br />
40 24th Street, Suite 410<br />
Pittsburgh, PA 15222<br />
phone 412.325.2250<br />
fax 412.325.1811<br />
Network 8<br />
Alabama, Mississippi,<br />
Tennessee<br />
Network 8, Inc.<br />
PO Box 55868<br />
Jackson, MS 39296-5868<br />
phone 601.936.9260<br />
fax 601.932.4446<br />
Network 13<br />
Arkansas, Louisiana,<br />
Oklahoma<br />
<strong>ESRD</strong> Network Organization #13<br />
4200 Perimeter Center Drive, Suite 102<br />
Oklahoma City, OK 73112-2314<br />
phone 405.942.6000<br />
fax 405.942.6884<br />
Network 17<br />
American Samoa, Guam,<br />
Mariana Islands, Hawaii,<br />
Northern California<br />
Western Pacific <strong>Renal</strong> Network, LLC<br />
505 San Marin Drive, Building A,<br />
Suite 300<br />
Novato, CA 94945<br />
phone .415.897.2400<br />
fax 415.897.2422<br />
15<br />
17<br />
14<br />
11 2<br />
1<br />
4 3<br />
12 10 9 5<br />
13<br />
8<br />
6<br />
7
the sample for four years, with approximately one-third rolling <strong>of</strong>f,<br />
and with new participants added each fall to keep the overall sample<br />
size at approximately 12,000 each calendar year.<br />
THOMSON REUTERS MARKETSCAN DATA<br />
The Thomson Reuters MarketScan Commercial Claims and Encounters<br />
<strong>Data</strong>base includes specific health services records for employees<br />
and their dependents in a selection <strong>of</strong> large employers, health plans,<br />
and government and public organizations. The database includes<br />
nine files: Annual Enrollment Summary Table, Enrollment Detail<br />
Table, Inpatient Admissions Table, Inpatient Services Table, Outpatient<br />
Services Table, Outpatient Pharmaceutical Claims Table,<br />
Facility (Inpatient and Outpatient) Header Table, Aggregated Populations<br />
Table, and the RED BOOK (prescription drug information<br />
by National Drug Code). The strength <strong>of</strong> this database lies in the<br />
quality <strong>of</strong> its cost information, where claims data include actual<br />
paid dollars and net payments by the insurer.<br />
The MarketScan database links billing and encounter data to<br />
detailed patient demographic and enrollment information across<br />
sites and types <strong>of</strong> providers, and over time from 1999 to 2007, and<br />
includes commercial health data from approximately 100 payors.<br />
About 80 percent <strong>of</strong> those covered are self-insured. Each year the<br />
database contains health data for about 10.5 million people. For<br />
details about the MarketScan data, please visit www.usrds.org.<br />
INGENIX i3 DATA<br />
The Ingenix i3 database is a commercial and non-capitated health<br />
plan database covering employees from multiple employers within<br />
a single insurer. In addition to the usual service encounter and drug<br />
data, similar to that <strong>of</strong> the MarketScan database, this database also<br />
includes laboratory data, allowing for comparisons between claimsbased<br />
and lab-based definitions <strong>of</strong> diseases. In order to protect the<br />
discount structure <strong>of</strong> its business, the billing data <strong>of</strong> this single<br />
insurer discloses only charged dollars without actual paid amounts<br />
or the portion paid by the insurer.<br />
The Ingenix i3 database links billing and encounter data to<br />
detailed demographic and enrollment information <strong>of</strong> individual<br />
employees from 2000 to 2007, and contains health data for approximately<br />
14 million people annually. For details about what is contained<br />
in the Ingenix i3 data, please visit our website at www.usrds.org.<br />
NATIONAL HEALTH & NUTRITION<br />
EXAMINATION SURVEY (NHANES)<br />
NHANES is a series <strong>of</strong> health examination surveys conducted by<br />
the National Center for Health Statistics (NCHS) <strong>of</strong> the Centers for<br />
Disease Control and Prevention (CDC). Begun in 1960, NHANES is<br />
designed to monitor the health and nutritional status <strong>of</strong> the noninstitutionalized<br />
civilian population in the <strong>United</strong> <strong>States</strong>. NHANES<br />
III was conducted in two phases between 1988 and 1994. In 1999,<br />
NHANES became a continuous annual survey to allow annual estimates,<br />
with release <strong>of</strong> public-use data files every two years. Both<br />
NHANES III and NHANES 1999–2006 were nationally representative<br />
cross-sectional surveys and used a complex, stratified, multistage<br />
probability cluster sampling design that included selection<br />
<strong>of</strong> primary sampling units (counties), household segments within<br />
the counties, and sample persons from selected households. Survey<br />
participants were interviewed in their homes and/or received<br />
standardized medical examinations in mobile examination centers.<br />
Both surveys over-sampled African Americans, Mexican Americans,<br />
and individuals age 60 or older to improve the estimates for<br />
these subgroups.<br />
ANNUAL FACILITY SURVEY (AFS)<br />
Independent <strong>ESRD</strong> patient counts are available not only from the<br />
CMS <strong>ESRD</strong> database, but also from CMS’s Annual Facility Survey (CMS<br />
2744), which all Medicare-certified dialysis units must complete at<br />
the end <strong>of</strong> each year. The AFS reports counts <strong>of</strong> patients being treated<br />
at the end <strong>of</strong> the year, new <strong>ESRD</strong> patients starting treatment during<br />
the year, and patients dying during the year. Both Medicare and<br />
non-Medicare end-<strong>of</strong>-year patients are counted. While AFS files do<br />
not carry patient-specific demographic and diagnosis data, they<br />
provide independent patient counts used to complement the CMS<br />
patient-specific records. Starting with the 2005 AFS, CMS stopped<br />
posting data from these surveys on the web. And beginning with<br />
the 2007 <strong>ADR</strong>, the USRDS has extracted the relevant facility survey<br />
data directly from the SIMS database.<br />
CDC SURVEILLANCE<br />
The CDC used its National Surveillance <strong>of</strong> Dialysis-Associated Diseases<br />
to collect data from U.S. dialysis facilities on patient and staff<br />
counts, membrane types, reuse practices, water treatment, therapy,<br />
vascular access use, antibiotic use, hepatitis vaccination and conversion<br />
rates, and the incidence <strong>of</strong> HIV, AIDS, and tuberculosis. No<br />
data are patient-specific. The CDC did not conduct a survey in 1998,<br />
and terminated this program after 2002.<br />
UNITED STATES CENSUS<br />
In rate calculations throughout this year’s <strong>ADR</strong> we use data from<br />
the 2000 U.S. Census, and also incorporate CDC population estimates<br />
by race. Our methods are described on later in this appendix.<br />
<strong>Data</strong> management & preparation<br />
Our main computer system is based on a VMS cluster running Alpha<br />
EV6 processors. We currently maintain three nodes in the cluster:<br />
two 4-CPU (i.e. Alpha EV6 processor) servers, each with 16-GB RAM<br />
memory, and the other a dual CPU (500MHz) server with 4-GB <strong>of</strong><br />
RAM memory. Through the HP Advanced Server <strong>System</strong>, we map<br />
VMS directories to network shares accessible to Windows clients<br />
as mapped network drives. The Alpha EV6s are connected to 30<br />
terabytes <strong>of</strong> RAID-5 (Redundant Array <strong>of</strong> Independent Disks, level<br />
5) disk farms, which are managed by three interconnecting highspeed<br />
disk controllers via Fibre Channel.<br />
We use SAS database management system and development<br />
tools as our core database technology platform; this differs from<br />
the Oracle RDBMS system used by the previous contractor only in<br />
physical data allocation and management. All information in the<br />
earlier system was integrated into the new database, and its continuity<br />
and completeness are maintained.<br />
DATA LOADING & CLEANING<br />
<strong>Data</strong> files come to the USRDS in IBM 3490 and 3490e cartridges/<br />
CD-ROMs with EBCDIC, ASCII, or SAS formats. Due to increased awareness<br />
<strong>of</strong> and concerns over data security and patient privacy protection,<br />
CMS has instituted data encryption procedures on all out-bound<br />
data regardless <strong>of</strong> their file formats and transportation mediums.<br />
Once loaded and decrypted, files are converted into SAS data sets<br />
for processing, and a series <strong>of</strong> data verification steps is completed to<br />
ensure data quality and integrity before updating the USRDS database.<br />
DATABASE UPDATES<br />
For this <strong>ADR</strong>, patient demographic and diagnosis data are updated<br />
through October, 2008, and Medicare inpatient/outpatient and physician/supplier<br />
claims through December 31, 2007.<br />
<strong>Data</strong> management & preparation<br />
4 APPENDIx A: ANAlyTICAl METHODS<br />
<strong>2009</strong> USRDS Annual <strong>Data</strong> Report<br />
Vol 2<br />
esrd<br />
5<br />
App A<br />
pg 359
5<br />
App A<br />
pg 360<br />
<strong>ESRD</strong> PATIENT DETERMINATION<br />
A person is identified as having <strong>ESRD</strong> when a physician certifies<br />
the disease on the CMS ME form, or when there is other evidence <strong>of</strong><br />
chronic dialysis or a kidney transplant. Patients with acute kidney<br />
failure who are on dialysis for days or weeks, but who then recover<br />
kidney function, are excluded from the database if their ME forms<br />
have not been submitted. Patients who die soon after kidney failure<br />
without receiving dialysis are sometimes missed.<br />
The <strong>ESRD</strong> First Service Date (FSD) is the single most important<br />
data element in the USRDS database, and each patient must, at a minimum,<br />
have a valid FSD. This date is used to determine the incident<br />
year <strong>of</strong> each new patient and the first year in which the patient is<br />
counted as prevalent. The date 90 days after the FSD is used as the<br />
starting point for most survival analyses.<br />
The FSD is derived by taking the earliest <strong>of</strong> the date <strong>of</strong> the start<br />
<strong>of</strong> dialysis for chronic kidney failure, as reported on the ME form;<br />
the date <strong>of</strong> a kidney transplant, as reported on a CMS or OPTN transplant<br />
form, an ME form, or a hospital inpatient claim; or the date <strong>of</strong><br />
the first Medicare dialysis claim. Most FSDs are obtained from the<br />
ME form. In the absence <strong>of</strong> this form, the date <strong>of</strong> the first Medicare<br />
dialysis claim or transplant usually supplies the FSD. In the few<br />
cases in which the date <strong>of</strong> the earliest dialysis claim precedes the<br />
first dialysis date reported on the ME form, the earliest claim date<br />
is used as the FSD. However, starting with the 2007 <strong>ADR</strong>, a patient<br />
entering into the <strong>ESRD</strong> program after December 31, 1994 will have<br />
his or her FSD defined solely by the regular dialysis start date or the<br />
preemptive transplant date, whichever is earliest, on the ME form.<br />
This new method <strong>of</strong> determining the FSD has been introduced so<br />
as to align more closely to the methods used by CMS. After years <strong>of</strong><br />
careful monitoring and repeated comparative analyses <strong>of</strong> the traditional<br />
USRDS method to the new ME method, the USRDS hasbegun<br />
applying the ME method to incident patients entering into the <strong>ESRD</strong><br />
program on or after January 1, 1995.<br />
MEDICARE & NON-MEDICARE (‘ZZ’) PATIENTS<br />
Beneficiaries are enrolled in Medicare based on criteria defined<br />
in Title XVIII <strong>of</strong> the Social Security Act <strong>of</strong> 1965, and in subsequent<br />
amendments to the act. A person in one <strong>of</strong> these four categories is<br />
eligible to apply for Medicare: age 65 and over, disabled, <strong>ESRD</strong> program,<br />
and Railroad Retirement Board (RRB).<br />
Most <strong>ESRD</strong> patients are eligible to apply for Medicare as their<br />
primary insurance payor. Some, however, are not immediately eligible<br />
for Medicare coverage because <strong>of</strong> their employment status and<br />
insurance benefits. These patients are usually covered by employer<br />
group health plans (EGHPs), and must wait 30–33 months before<br />
becoming eligible to have Medicare as their primary payor. Some <strong>of</strong><br />
these patients, particularly new patients since 1995, have FSDs established<br />
by ME forms, but have no dialysis claims or hospitalization<br />
events in the CMS claims database. In the REBUS/PMMIS database all<br />
non-Medicare <strong>ESRD</strong> patients are assigned a code <strong>of</strong> ‘ZZ’ in the twocharacter<br />
Beneficiary Identification Code field. CMS does not generally<br />
include these patients in the datasets released to researchers.<br />
The USRDS recognizes that ‘ZZ’ patients are true <strong>ESRD</strong> patients,<br />
and should be included in patient counts for incidence, prevalence,<br />
and modality. Calculations <strong>of</strong> standardized mortality ratios, standardized<br />
hospitalization ratios, and standardized transplantation<br />
ratios, however, should not include these patients because <strong>of</strong> the<br />
small number <strong>of</strong> claims available in the first 30–33 months after<br />
their first <strong>ESRD</strong> service. Furthermore, it may not be possible to link<br />
‘ZZ’ patients to their <strong>ESRD</strong> Death Notification forms or the OPTN<br />
transplant data, or to determine comorbidity or inpatient/outpa-<br />
tient and physician/supplier services. Because such data are limited,<br />
event rates that include these patients must be assessed with caution.<br />
We continue to include ‘ZZ’ patients in the mortality rate calculations<br />
<strong>of</strong> the <strong>ADR</strong>. We are collaborating with CMS and other interested<br />
researchers to establish a consistent approach to managing the<br />
data for these patients. The USRDS, in working with CMS, has been<br />
able to resolve most <strong>of</strong> the ‘ZZ’ patients since the release <strong>of</strong> the <strong>ESRD</strong><br />
Patient <strong>Data</strong>base, REMIS, in the fall <strong>of</strong> 2003. According to our most<br />
recent assessment — performed during the production <strong>of</strong> the 2007<br />
<strong>ADR</strong> — we have determined that at least 99 percent <strong>of</strong> ‘ZZ’ patients<br />
have been resolved due to significant advancements in the REMIS/<br />
REBUS database system.<br />
LOST-TO-FOLLOW-UP METHODOLOGY<br />
The USRDS uses all available data to create a treatment history for<br />
each patient in the database, including all modality events, their<br />
duration, and the renal providers involved in each patient’s care.<br />
Gaps frequently exist in the billing data upon which modality<br />
periods are based. The USRDS assumes that a modality continues<br />
until death or the next modality-determining event. A patient with<br />
a functioning transplant is assumed to maintain it unless a transplant<br />
failure or death notification is encountered in the data. In the<br />
absence <strong>of</strong> a death notification, dialysis claims, or other confirmation<br />
<strong>of</strong> a continuing modality, a dialysis modality, in contrast, is<br />
assumed to continue for only 365 days from the date <strong>of</strong> the last claim.<br />
After this period the patient is declared lost-to-follow-up until the<br />
occurrence <strong>of</strong> a dialysis claim or transplant event.<br />
Because Medicare may be the secondary payor for up to the first<br />
30–33 months <strong>of</strong> <strong>ESRD</strong>, delaying the submission <strong>of</strong> Medicare dialysis<br />
claims, lost-to-follow-up categorization cannot begin until the end<br />
<strong>of</strong> the third year after the start <strong>of</strong> <strong>ESRD</strong> service. This “first three-year<br />
rule” is particularly important for non-Medicare patients, who may<br />
be followed for up to three years with limited event or mortality<br />
data. These patients would contribute dialysis or transplant days to<br />
the denominator <strong>of</strong> rate calculations, but only questionable event<br />
data to the numerator. In comparison to the two-year rule used in<br />
the 2001 <strong>ADR</strong>, this three-year rule significantly reduces the number<br />
<strong>of</strong> lost-to-follow-up patients in the prevalent population.<br />
A number <strong>of</strong> events can result in a lack <strong>of</strong> dialysis data and eventual<br />
reclassification <strong>of</strong> a patient as lost-to-follow-up:<br />
4 The patient may have recovered renal function (RRF) and no<br />
longer have <strong>ESRD</strong>. For a valid patient classification, this event<br />
must occur within 180 days <strong>of</strong> the FSD, and the RRF period<br />
must persist for at least 90 days.<br />
4 The patient may have left the country.<br />
4 The patient may receive dialysis covered by a payor other<br />
than Medicare, or have received a transplant not paid for<br />
by Medicare or reported to OPTN.<br />
4 The patient may be enrolled in a Medicare HMO, so that Medicare<br />
dialysis claims are not generated even though the patient<br />
is eligible for Medicare coverage.<br />
4 The patient’s death may not have been reported to the Social<br />
Security Administration or to CMS.<br />
INTEGRATION OF THE USRDS, SIMS, & REMIS DATABASES<br />
We have worked to reconcile <strong>ESRD</strong> patients in the SIMS, REMIS, and<br />
USRDS databases. We have analyzed each database for duplicate<br />
records, consolidated these records, and integrated the databases.<br />
<strong>Data</strong> were then re-analyzed for duplicates, which were themselves<br />
consolidated. This consolidation <strong>of</strong> patients is an ongoing collaborative<br />
effort between the <strong>ESRD</strong> Networks, CMS, and the USRDS.
Patient treatment histories compiled by the USRDS rely on Medicare<br />
dialysis billing records, which contain no information on dialysis<br />
therapy or modality changes in non-Medicare patients. Beginning<br />
with the 2003 <strong>ADR</strong>, we incorporate treatment-specific information<br />
from the <strong>ESRD</strong> Networks’ SIMS event database to improve the tracking<br />
<strong>of</strong> these patients in the USRDS database, and <strong>of</strong> patients who<br />
are considered lost-to-follow-up. The consolidation efforts from<br />
database integration among USRDS, SIMS, and REMIS continue to<br />
pay dividends in reducing the number <strong>of</strong> lost-to-follow-up patients.<br />
We continue to take a conservative approach to incorporating<br />
SIMS Event History data into the USRDS treatment history; as we<br />
learn more about the data, we may expand this approach. We currently<br />
make the following updates on an annual basis:<br />
4 The USRDS database is updated with mortality data from the<br />
SIMS event database.<br />
4 The database is updated for each incident patient whose initial<br />
modality is listed as “unknown dialysis,” and for whom<br />
the SIMS database lists a known dialytic modality within 90<br />
days <strong>of</strong> the established first <strong>ESRD</strong> service date.<br />
4 <strong>Data</strong> on non-Medicare “lost-to-follow-up” patients are substituted<br />
with available SIMS treatment information.<br />
Since the 2007 <strong>ADR</strong> we have included the RRF event in the modality<br />
sequence, reducing lost-to-follow-up episodes for prevalent patients.<br />
Such an event is now established in our database only if it occurs<br />
within the first 180 days <strong>of</strong> the FSD and lasts for at least 90 days, a<br />
definition far more conservative than that in the SIMS event database.<br />
60-DAY STABLE MODALITY RULE: TREATMENT HISTORY<br />
This rule requires that a modality continue for at least 60 days before<br />
it is considered a primary or switched modality. It is used to construct<br />
a patient’s modality sequence, or treatment history, so that<br />
incident and prevalent patients are known to have stable and established<br />
modalities. Starting with the 2003 <strong>ADR</strong>, all descriptive data in<br />
the incident, prevalent, and modality sections are based on incident<br />
and prevalent cohorts produced from the modality sequence without<br />
using this rule. In analyses <strong>of</strong> patient outcomes such as hospitalization<br />
and mortality, in contrast, this rule is applied.<br />
90-DAY RULE: OUTCOMES ANALYSES<br />
This rule defines each patient’s start date, for data analyses, as day 91<br />
<strong>of</strong> <strong>ESRD</strong>. Allowing outcomes to be compared among all <strong>ESRD</strong> patients<br />
at a stable and logical point in time, it is used primarily to calculate<br />
survival rates and compare outcomes by modality at several points<br />
in time. Use <strong>of</strong> the rule overcomes the difficulties <strong>of</strong> examining data<br />
from the first three months <strong>of</strong> <strong>ESRD</strong> service (an unstable time for<br />
new patients as renal providers try to determine the best treatment<br />
modality), and from in-center hemodialysis patients younger than<br />
65 and not disabled, who cannot bill Medicare for their dialysis<br />
treatments and hospitalizations until 90 days after the first <strong>ESRD</strong><br />
service date. Patients on peritoneal dialysis or home dialysis, or with<br />
transplant as the first modality, can bill immediately.<br />
SERUM ALBUMIN DATA<br />
The Medical Evidence form reports a patient’s albumin level along<br />
with the test’s lower limit, which indicates the testing method. There<br />
are currently two methods in use: bromcresol purple and bromcresol<br />
green, with lower limits <strong>of</strong> 3.2 and 3.5 g/dl, respectively.<br />
While producing the 2004 <strong>ADR</strong> we uncovered severe problems<br />
in data quality for albumin information on the ME form. We found<br />
that, from 1995 to 2003, almost 50 percent <strong>of</strong> forms contained lower<br />
limit values equal to “zero,” while another 25 percent reported values<br />
other than the expected 3.2 and 3.5 g/dl. Only 25 percent (n=173,000)<br />
<strong>of</strong> incident patients had legitimate lower limit values for determining<br />
normal serum albumin. Further analyses, however, have shown<br />
that these patients are a representative cohort sample, with similar<br />
demographic distributions by age, gender, race, and cause <strong>of</strong> <strong>ESRD</strong><br />
to those <strong>of</strong> the overall <strong>ESRD</strong> population. For all figures in the 2005<br />
and later <strong>ADR</strong>s which present data on serum albumin from the ME<br />
form, we therefore include only those incident patients with both<br />
an albumin lower limit <strong>of</strong> 3.2 or 3.5 g/dl and an albumin value.<br />
<strong>Data</strong>base definitions<br />
MODALITIES<br />
The USRDS and the CMS <strong>ESRD</strong> group have worked extensively on<br />
methods <strong>of</strong> categorizing patients by <strong>ESRD</strong> modality. While the ME<br />
form is the primary source <strong>of</strong> data on modality at <strong>ESRD</strong> initiation, the<br />
modality it indicates may be temporary, as patients <strong>of</strong>ten change to<br />
a new one in the first 90 days, and it can be difficult to track modality<br />
during this time. Patients age 65 and older have Medicare claims<br />
in the first 90 days; these claims contain revenue codes designating<br />
modality. Patients younger than 65 and in employer group health<br />
plans or Medicare risk programs, however, have no such claims.<br />
Modality may thus not be determined until Medicare becomes the<br />
primary payor at day 91 or, for EGHP patients, at 30–33 months after<br />
the first <strong>ESRD</strong> service date. These limitations influence our ability<br />
to determine a patient’s exact modality at any one point in time.<br />
Of particular concern are patients categorized as having an unstable<br />
modality (i.e. on a modality for fewer than 60 consecutive days)<br />
in the first 90 days, and who are therefore not recognized as being<br />
hemodialysis or peritoneal dialysis patients. These patients tend to<br />
have higher death and hospitalization rates, and unless they are identified<br />
and assigned to modalities, interpretations <strong>of</strong> modality-specific<br />
outcomes should be viewed with caution. These patients are included<br />
in the “all <strong>ESRD</strong>” category, which provides a more complete view <strong>of</strong><br />
mortality and hospitalization with the least biasing <strong>of</strong> the data.<br />
As mentioned earlier, a new modality/event — recovered renal<br />
function — was introduced in the 2007 <strong>ADR</strong>. This event can be established<br />
only if it occurs within first 180 days <strong>of</strong> the FSD and if the<br />
RRF period persists for at least 90 days. The RRF event is similar to<br />
the lost-to-follow-up event in that patients with an RRF event will<br />
not be included in the prevalent populations for outcomes analyses.<br />
However, as with lost-to-follow-up events, we keep them in the<br />
modality sequence so that subsequent renal failure episodes can be<br />
closely tracked in a timely manner.<br />
Individual analyses categorize modalities in different ways; these<br />
are defined in the methods sections for each chapter.<br />
PAYORS<br />
Information on payors is obtained from the CMS Medicare Enrollment<br />
<strong>Data</strong>base. We also examine Medicare outpatient claims to<br />
identify patients for whom the EDB does not indicate Medicare as<br />
primary payor (MPP), but who have at least three consecutive months<br />
<strong>of</strong> dialysis treatment covered by Medicare; these patients are also<br />
designated as having MPP coverage. From these two data sources<br />
we construct a payor sequence file to provide payor history, and,<br />
starting with the 2003 <strong>ADR</strong>, we use this file to identify Medicare<br />
eligibility status and other payors.<br />
The construction <strong>of</strong> this file is similar to that <strong>of</strong> the treatment<br />
history file. Payor status is maintained for each <strong>ESRD</strong> patient from<br />
the first <strong>ESRD</strong> service date until death or the end <strong>of</strong> the study period.<br />
Payor data are used to categorize a patient as MPP, Medicare as sec-<br />
<strong>Data</strong>base definitions<br />
4 APPENDIx A: ANAlyTICAl METHODS<br />
<strong>2009</strong> USRDS Annual <strong>Data</strong> Report<br />
Vol 2<br />
esrd<br />
5<br />
App A<br />
pg 361
5<br />
App A<br />
pg 362<br />
ondary payor (MSP) with EGHP, MSP non-EGHP, Medicare Advantage<br />
(Medicare + Choice), Medicaid, or a combination <strong>of</strong> payers. With<br />
this approach, the USRDS is now able to apply payor status information<br />
in all outcome analyses using the “as-treated” model (see the<br />
discussion <strong>of</strong> Chapter Eleven).<br />
PRIMARY CAUSE OF RENAL FAILURE<br />
Information on the primary cause <strong>of</strong> renal failure is obtained<br />
directly from the ME form. For the <strong>ADR</strong> we use eight categories,<br />
with ICD-9-CM codes as follows:<br />
4 diabetes: 250.00 and 250.01<br />
4 hypertension: 403.9, 440.1, and 593.81<br />
4 glomerulonephritis: 580.0, 580.4, 582.0, 582.1, 582.9, 583.1, 583.2,<br />
583.4, and 583.81<br />
4 cystic kidney: 753.13, 753.14, and 753.16<br />
4 other urologic: 223.0, 223.9, 590.0, 592.0, 592.9, and 599.6<br />
4 other cause: all other ICD-9-CM codes covered in the list <strong>of</strong><br />
primary causes on the ME form, with the exception <strong>of</strong> 799.9<br />
4 unknown cause: 799.9 and ICD-9-CM codes not covered in<br />
the list <strong>of</strong> primary causes on the ME form<br />
4 missing cause: no ICD-9-CM code listed<br />
RACE & ETHNICITY<br />
<strong>Data</strong> on patient race and ethnicity are obtained from the ME form,<br />
the CMS Medicare Enrollment <strong>Data</strong>base, and the REMIS/REBUS identification<br />
file. Because they are addressed in separate questions on<br />
the ME form, racial and ethnic categories can overlap.<br />
Patient ethnicity became a required field on the 1995 revised ME<br />
form; because data for 1995 are incomplete, information on Hispanic<br />
patients is presented starting in 1996. The non-Hispanic category<br />
includes all non-Hispanics and patients with unknown ethnicity.<br />
Because <strong>of</strong> the small number <strong>of</strong> <strong>ESRD</strong> patients <strong>of</strong> some races,<br />
as well as the construction <strong>of</strong> the U.S. census data, we concentrate<br />
on white, African American, Native American (includes Alaskan<br />
Native), and Asian (includes Pacific Islander) populations. <strong>Data</strong> on<br />
patients <strong>of</strong> other races will be presented as their numbers increase.<br />
EGHP COHORT<br />
As mentioned, EGHP data in this year’s <strong>ADR</strong> are derived from the<br />
MarketScan and Ingenix I3 databases. To examine the demographic<br />
segment not represented by Medicare, we use enrollment information<br />
to construct yearly cohorts <strong>of</strong> enrollees younger than 65. To ensure<br />
that we select enrollees with the potential to generate claims evidence<br />
appropriate to the demands <strong>of</strong> analytical methods, rules for inclusion<br />
also include 12 months <strong>of</strong> continuous coverage in a commercial<br />
fee-for-service plan, and, for medication analyses, continuous prescription<br />
drug coverage. Comorbidities are identified using claims.<br />
Patients with at least one inpatient claim or at least two outpatient<br />
claims during the period <strong>of</strong> interest and with a diagnosis code <strong>of</strong> a<br />
particular comorbidity are identified as having that comorbidity.<br />
<strong>ESRD</strong> COHORT IN THE EGHP POPULATION<br />
As the MarketScan and I3 databases provide no identifiable data elements,<br />
we cannot link them directly to the USRDS <strong>ESRD</strong> registry. To<br />
identify <strong>ESRD</strong> patients we thus use a process similar to that <strong>of</strong> the<br />
registry. Transplant patients are identified by evidence <strong>of</strong> a kidney<br />
transplant procedure or an adverse graft event, and chronic dialysis<br />
patients by evidence <strong>of</strong> continuous history <strong>of</strong> dialysis therapy, with at<br />
least three consecutive months <strong>of</strong> dialysis service and with dialysis<br />
service claims in at least 70 percent <strong>of</strong> treatment months. Treatment<br />
months are defined from the first dialysis claim to the earliest <strong>of</strong><br />
kidney transplant, death, or end <strong>of</strong> enrollment. Both inpatient and<br />
outpatient claims are evaluated for evidence <strong>of</strong> dialysis service history.<br />
The first <strong>ESRD</strong> service date is set to the earliest <strong>of</strong> the first dialysis<br />
service date or the transplant date. If neither is available, the start<br />
<strong>of</strong> enrollment is used. Incidence is defined by a first <strong>ESRD</strong> service<br />
date at least 60 days after the start <strong>of</strong> enrollment.<br />
Précis<br />
For Figure p.1 we identify chronic kidney disease (CKD), cardiovascular<br />
disease (CVD), and diabetes in patients from the 5 percent<br />
Medicare sample using methods described for Chapter Eleven; these<br />
methods are also used to determine diabetic status and CVD in the<br />
<strong>ESRD</strong> population. Costs for the “cost year” are determined for the<br />
entire calendar year for patients who have fee-for-service coverage<br />
and Medicare as primary payor. Because this analysis combines the<br />
<strong>ESRD</strong> cohort with the 5 percent Medicare sample, <strong>ESRD</strong> patients in<br />
the 5 percent sample are excluded.<br />
Methods for the portion <strong>of</strong> Table p.a that addresses Medicare<br />
spending are addressed in the discussion <strong>of</strong> Chapter Eleven. Total<br />
transplant counts shown in Table p.a include all transplants performed<br />
in 2007 as reported by the OPTN. Transplants <strong>of</strong> unknown<br />
donor type are excluded from by-donor counts. New waiting list<br />
counts include all patients added to the waiting list for a kidneyalone<br />
or a kidney-pancreas transplant in 2007; patients added at<br />
multiple centers are counted once. The total N on the waiting list<br />
includes all patients listed for a kidney-alone or kidney-pancreas<br />
transplant as <strong>of</strong> December 31, 2007, regardless <strong>of</strong> when they first<br />
listed. If patients are added to the list in early 2007 and removed<br />
from the list before the end <strong>of</strong> the year, it is possible for a group to<br />
have more new patients than existing patients, as seen in patients<br />
age 0–17. Median time on the list is shown for patients listed on<br />
December 31, 2007.<br />
Adjusted rates in Figures p.4–5 and p.8 are adjusted for age, gender,<br />
and race.<br />
Figure p.6 shows the point prevalent by-year wait list counts for<br />
those listed for a kidney-alone transplant, and displays the median<br />
time to transplant, as well as the 25 th and 75 th percentiles for time<br />
to transplant, among patients transplanted during the given year.<br />
Time to transplant is computed using Kaplan-Meier methodology.<br />
QUALITY OF CARE<br />
Figure p.12 presents the monthly distribution <strong>of</strong> patients by mean<br />
hemoglobin group, with each month containing all patients with<br />
at least one valid EPO claim during the month. The hemoglobin is<br />
calculated as the reported hematocrit value divided by three. Figure<br />
p.13 shows the mean hemoglobin, by month, for prevalent dialysis<br />
patients with EPO claims, along with the monthly EPO dose per week<br />
for patients with 20 or fewer administrations per month. The mean<br />
EPO dose is adjusted in the same way used in Chapter Five, with a<br />
patient’s time at risk including only those days in which he or she<br />
is not in an inpatient hospital setting.<br />
For Figure p.14, an archived PMMIS quarterly dialysis record is<br />
used to track transfusions in <strong>ESRD</strong> patients before 1991. The percentage<br />
<strong>of</strong> hemodialysis patients receiving transfusions is calculated<br />
as the number receiving at least one transfusion in a given quarter<br />
divided by the number with at least one dialysis record in that quarter.<br />
Since the archived data are current only to the third quarter <strong>of</strong><br />
1995, we emulate this method, using Medicare claims generated by<br />
<strong>ESRD</strong> facilities, to update the data.<br />
Figure p.15 includes prevalent hemodialysis patients in the <strong>ESRD</strong><br />
CPM database who have at least one valid URR measurement. For
each patient, we calculate a mean URR measurement from all measurements<br />
available, then the percentage <strong>of</strong> patients whose mean<br />
URR is in each category. Figure p.16 includes prevalent peritoneal<br />
dialysis patients in the <strong>ESRD</strong> CPM database who have at least one<br />
valid Kt/V measurement. For each patient, we calculate a mean<br />
Kt/V measurement from all those available, then the percentage <strong>of</strong><br />
patients whose mean Kt/V is in each category.<br />
HOSPITALIZATION & MORTALITY<br />
Figure p.17 shows the percent change since 1993 in admission rates<br />
for period prevalent <strong>ESRD</strong> patients. Included patients have Medicare<br />
as a primary payor and are residents <strong>of</strong> the 50 states, the District <strong>of</strong><br />
Columbia, Puerto Rico, and the Territories. Patients with AIDS as a<br />
primary or secondary cause <strong>of</strong> death are excluded, as are patients<br />
with missing age or gender information. Methods generally follow<br />
those described for the prevalent patient cohorts in Chapter Six<br />
and Reference Section G. Rates are adjusted for age, gender, race,<br />
and primary diagnosis using the model-based adjustment method.<br />
The reference cohort includes period prevalent <strong>ESRD</strong> patients, 2005.<br />
Principal ICD-9-CM diagnosis codes for cardiovascular and infectious<br />
hospitalizations are listed in the discussion <strong>of</strong> Figure 6.2. New<br />
dialysis access codes for peritoneal dialysis patients appeared in late<br />
1998; dialysis access values are therefore shown for peritoneal dialysis<br />
patients as a change since 1999 rather than 1993. For peritoneal<br />
dialysis patients, dialysis access hospitalizations are those defined<br />
as “pure” inpatient vascular/dialysis access events, as described for<br />
Tables G.11–15. For hemodialysis patients, vascular access hospitalizations<br />
include “pure” inpatient vascular access events, and vascular<br />
access for hemodialysis patients excludes codes specific to<br />
peritoneal dialysis catheters (996.56, 996.68, and V56.2).<br />
Figure p.18 illustrates trends in mortality rates by vintage for<br />
period prevalent dialysis patients alive on renal replacement therapy<br />
on January 1, with a first service date at least 90 days prior to the<br />
beginning <strong>of</strong> the year, and reaching day 91 <strong>of</strong> <strong>ESRD</strong> treatment during<br />
the year. Patients with unknown age or gender, or <strong>of</strong> a race other than<br />
white, African American, Native American, or Asian, are excluded.<br />
Patients are followed from January 1 until death, transplantation,<br />
or the end <strong>of</strong> the year, and all-cause mortality rates are adjusted for<br />
age, gender, race, and primary diagnosis using generalized mixed<br />
models. The reference population consists <strong>of</strong> 2005 prevalent dialysis<br />
patients, and adjusted mortalities across vintages are comparable.<br />
Figure p.19 presents adjusted first-, second–third, and fourth–<br />
fifth-year mortality rates, by modality, for incident dialysis and<br />
first transplant patients. Patients are followed from day 91 until<br />
death or December 31, 2007. Dialysis patients are also censored<br />
at transplant. Rates are computed from the Cox model using the<br />
model-based adjustment method, described later in this appendix,<br />
and adjusted for age, gender, race, and primary cause <strong>of</strong> <strong>ESRD</strong>. The<br />
reference population consists <strong>of</strong> 2005 incident <strong>ESRD</strong> patients, and<br />
these rates are comparable across modalities.<br />
Figure p.20 illustrates five-year survival by first modality. The<br />
1993–1997 and 1998–2002 cohorts include incident patients on hemodialysis<br />
or peritoneal dialysis on the first <strong>ESRD</strong> service date, and<br />
patients receiving their first renal transplant in a calendar year. All<br />
cohorts include both Medicare and non-Medicare patients living<br />
in the 50 states, the District <strong>of</strong> Columbia, Puerto Rico, and the Territories,<br />
and exclude those with unknown age, gender, or primary<br />
diagnosis, as well as those with a listed age greater than 110; the<br />
dialysis cohort also excludes patients who die or are transplanted in<br />
the first 90 days. Dialysis patients are followed from day 91 to death,<br />
transplantation, or the end <strong>of</strong> 2006, while transplant patients are<br />
followed from the first transplant date until death or the end <strong>of</strong> 2007.<br />
Survival probabilities are adjusted for age, gender, race, and primary<br />
diagnosis. The reference population consists <strong>of</strong> 2005 incident <strong>ESRD</strong><br />
patients. Adjusted probabilities can be compared across modalities.<br />
<strong>ESRD</strong> EXPENDITURES<br />
Methods used for Figures p.21–26 and Table p.b are described in<br />
the text for Chapter Eleven and in the figure captions.<br />
Healthy People 2010<br />
Targets in this chapter come directly or are estimated from published<br />
HP2010 objectives on CKD, diabetes, and immunizations.<br />
Objective 4.1 Incident rates in Figures hp.2–3, hp.4 (first graph),<br />
and hp.26, and in Table hp.a, are calculated using the methods<br />
described for Chapter Two, later in this appendix. Rates <strong>of</strong> diabetes<br />
in the general population (second graph in Figure hp.4) are obtained<br />
from the CDC’s Behavioral Risk Factor Surveillance <strong>System</strong>, at www.<br />
cdc.gov/brfss. Rates in Figures hp.2 and hp.4, are adjusted for age,<br />
gender, and race. In Figure hp.3 and Table hp.a, rates by age are<br />
adjusted for gender and race, rates by gender are adjusted for age and<br />
race, and rates by race and ethnicity are adjusted for age and gender.<br />
Objective 4.2 The cohort includes period prevalent <strong>ESRD</strong> patients,<br />
1991–2007. Cause-specific cardiovascular mortality is defined using<br />
CMS codes 27, 31, and 32 (congestive heart failure); 26 (atherosclerotic<br />
heart disease); 02 and 23 (myocardial infarction); and 01, 04, 25,<br />
28–30, and 36–37 (other cardiovascular disease). Age is calculated<br />
for point prevalent patients as <strong>of</strong> January 1, and for incident patients<br />
as <strong>of</strong> the first <strong>ESRD</strong> service date. We exclude patients with unknown<br />
age, gender, or race, and those with an age calculated to be less than<br />
zero. Rates are estimated as the number <strong>of</strong> patients who die from<br />
cardiovascular disease in each year per 1,000 patient years at risk.<br />
Objective 4.3 Table hp.c and figure hp.8 use data from the newest<br />
version <strong>of</strong> the ME form for patients initiating <strong>ESRD</strong> on hemodialysis.<br />
Information on pre-<strong>ESRD</strong> care is obtained directly from the ME<br />
form. The cohort for Figures hp.9–10 includes incident <strong>ESRD</strong> patients,<br />
age 67 and older at initiation; pre-<strong>ESRD</strong> nephrologist care is identified<br />
through at least one physician/supplier claim with a physician<br />
specialty code <strong>of</strong> “nephrologist.” Albumin tests are identified from<br />
Medicare claims during the two-year period prior to <strong>ESRD</strong>.<br />
Objective 4.4 For Figures hp.12–13, the calculation <strong>of</strong> placement<br />
rates follows methods used in Chapter Five. <strong>Data</strong> from the CMS<br />
<strong>ESRD</strong> Clinical Performance Measures (CPM) Project are used for<br />
Table hp.d (<strong>ESRD</strong> CPM year 2007) and Figures hp.11 and hp.32 (<strong>ESRD</strong><br />
CPM years 1999–2007), . Patients included in these two figures and<br />
the table are those whose date <strong>of</strong> dialysis initiation, according to<br />
the CPM data, occurs in the same year as the data collection, and<br />
the access type represents the access used during the last quarter<br />
<strong>of</strong> the year. To obtain consistent information on race and ethnicity,<br />
patients included in the CPM dataset are matched to those in the<br />
<strong>ESRD</strong> database using UID numbers.<br />
Objective 4.5 The cohort for Figures hp.14–15 and hp.33 and for<br />
Table hp.e includes patients younger than 70 in 1991–2006. Percentages<br />
are calculated as the number <strong>of</strong> patients placed on the<br />
deceased donor organ wait list or receiving a deceased donor transplant<br />
within one year <strong>of</strong> initiating <strong>ESRD</strong> therapy, divided by the<br />
number <strong>of</strong> patients without a living donor available (i.e., patients<br />
receiving a living donor transplant are excluded), and are estimated<br />
using the Kaplan-Meier method. Note that this method differs from<br />
those used in previous <strong>ADR</strong>s, which showed the percentage <strong>of</strong> point<br />
prevalent dialysis patients on the wait list as <strong>of</strong> December 31 <strong>of</strong> the<br />
given year.<br />
Healthy People 2010<br />
4 APPENDIx A: ANAlyTICAl METHODS<br />
<strong>2009</strong> USRDS Annual <strong>Data</strong> Report<br />
Vol 2<br />
esrd<br />
5<br />
App A<br />
pg 363
5<br />
App A<br />
pg 364<br />
Objective 4.6 The study cohort here includes patients from 1991–<br />
2004 who are younger than 70 at <strong>ESRD</strong> certification. <strong>Data</strong> are shown<br />
in Figures hp.16–17 and hp.34, and in Table hp.f. Patients are followed<br />
for three years, from <strong>ESRD</strong> certification until the first <strong>of</strong> death,<br />
transplant, or censoring at three years post-transplant. Percentages<br />
are calculated using the Kaplan-Meier methodology.<br />
Objective 4.7 Incident rates <strong>of</strong> <strong>ESRD</strong> due to diabetes are calculated<br />
using the methods described for Chapter Two. Rates in Figures<br />
hp.18 are adjusted for age, gender, and race, those in Figure hp.19 are<br />
adjusted for gender and race, and those in Figure hp.20 are adjusted<br />
for age and gender. In Table hp.g, rates by age are adjusted for gender<br />
and race, rates by gender are adjusted for age and race, and rates by<br />
race and ethnicity are adjusted for age and gender.<br />
Objective 4.8 Methods and codes used to determine rates <strong>of</strong> glycosylated<br />
hemoglobin (A1c) testing and eye examinations are taken<br />
from HEDIS 2008 specifications (HEDIS 2008, an NCQA program, is<br />
used to monitor the performance <strong>of</strong> managed health care plans).<br />
CPT codes 83036 and 83037 are used to identify diabetic A1c testing<br />
(claims made within 30 days <strong>of</strong> the last claim for each patient are<br />
excluded, and at least two A1c claims must be counted). Codes used<br />
to identify diabetic eye examinations are as follows: CPT codes 92002,<br />
92004, 92012, 92014, 92018, 92019, 92225, 92226, 92230, 92235, 92240,<br />
92250, 92260, 67101, 67105, 67107, 67108, 67110, 67112, 67141, 67145,<br />
67208, 67210, 67218, 67227, 67228, 67028, 67030, 67031, 67036, 67038,<br />
67039, 67041, 67042, 67043, 67113, 67121, 67221, 67228, S0625, S0620,<br />
S0621, and S3000. ICD-9-CM procedure codes 14.1–14.5, 14.9, 95.02,<br />
95.03, 95.04, 95.11, 95.12, and 95.16, and ICD-9-CM diagnosis code<br />
V72.0. Lipid testing is identified through CPT codes 80061, 82465,<br />
83715–83721, 84478, 83700, 83701, and 83704. The general Medicare<br />
population includes patients diagnosed with CKD and diabetes in<br />
each year, continuously enrolled in the Medicare inpatient/outpatient<br />
and physician/supplier program during the whole year, and age 65<br />
or older at the beginning <strong>of</strong> the year. Testing is tracked during each<br />
year. Patients are excluded if they are enrolled in a managed care<br />
program (HMO), acquire Medicare as secondary payor, are diagnosed<br />
with <strong>ESRD</strong> during the year, have a missing date <strong>of</strong> birth, or do not live<br />
in the 50 states, the District <strong>of</strong> Columbia, Puerto Rico, or the Territories.<br />
Racial and ethnic categories are mutually exclusive. Methods<br />
<strong>of</strong> defining CKD and diabetes are described in the CKD volume.<br />
Figure hp.36 illustrates diabetic preventive care among pre-<strong>ESRD</strong><br />
patients, by network. The cohort is 2007 incident <strong>ESRD</strong> patients, age<br />
67 or older at initiation, with diabetes one year prior to the start <strong>of</strong><br />
<strong>ESRD</strong>, and with Medicare inpatient/outpatient and physician/supplier<br />
coverage during that year. Eye examinations are tracked in<br />
the two years prior to <strong>ESRD</strong>, while lipid and A1c testing are tracked<br />
in the one year prior.<br />
Figures hp.21–22 and Table hp.h also show ACE-I/ARB use for<br />
diabetic CKD patients in the Medicare population. We use Cost and<br />
Use data from the Medicare Current Beneficiary Survey (MCBS) — a<br />
national, continuous, multipurpose survey <strong>of</strong> older, disabled, and<br />
institutionalized beneficiaries — to measure costs in Medicare<br />
patients age 65 and older. To ensure that we obtain information on<br />
all therapy received by each person during each study year, included<br />
patients are continuously enrolled in the Medicare inpatient/outpatient<br />
and physician/supplier program during the entire year, survive<br />
until the end <strong>of</strong> the year, have a completed survey, are not enrolled<br />
in an HMO, and do not have <strong>ESRD</strong>; they also reside in the 50 states<br />
or the District <strong>of</strong> Columbia and are community-dwelling respondents.<br />
Comorbidities, including CKD and diabetes, are defined from<br />
the claims, using the same method used with the 5 percent data.<br />
Drug use information is obtained from the MCBS Cost and Use data<br />
file “Prescribed Medicine Events,” and SUDAAN (Research Triangle<br />
Institute, Research Triangle Park, NC) is used to analyze all data.<br />
Objective 5.11 The cohort for Figures hp.23–25 and for Table hp.i<br />
is similar to that used for Objective 4.8, but includes all diabetic<br />
patients instead <strong>of</strong> diabetic CKD patients. CPT codes for urinary<br />
microalbumin measurement are also identified from HEDIS 2008<br />
specifications, and include 82042, 82043, 82044, and 84156. Testing<br />
is tracked during each year. Figure hp.37 illustrates urinary microalbumin<br />
measurements in the pre-<strong>ESRD</strong> population by <strong>ESRD</strong> network.<br />
The cohort is the same as that used in Figure hp.36.<br />
Objective 14.29 The cohort for influenza vaccinations includes all<br />
<strong>ESRD</strong> patients initiating therapy at least 90 days prior to September<br />
1 <strong>of</strong> each year and alive on December 31. For pneumococcal pneumonia<br />
vaccinations, cohorts include all <strong>ESRD</strong> patients initiating<br />
therapy at least 90 days before January 1 <strong>of</strong> the graphed time period<br />
and alive on December 31. Patients not residing in the 50 states, the<br />
District <strong>of</strong> Columbia, Puerto Rico, or the Territories are omitted<br />
from the study, as are those who have a missing date <strong>of</strong> birth, who<br />
have <strong>ESRD</strong> for fewer than 90 days prior to the start <strong>of</strong> the reporting<br />
interval, or who are lost-to-follow-up during the study period. Influenza<br />
vaccinations are tracked between September 1 and December<br />
31 <strong>of</strong> each year, while pneumococcal pneumonia vaccinations are<br />
tracked during the time periods graphed. Patients in both analyses<br />
have Medicare inpatient/outpatient and physician/supplier coverage<br />
during the study periods. All ages are calculated at the end<br />
<strong>of</strong> the graphed time period. Influenza vaccinations are identified<br />
by CPT codes 90724, 90657, 90658, 90659, and 90660, and HCPCS<br />
code G0008; pneumococcal vaccinations are identified through<br />
CPT codes 90669 and 90732, and HCPCS codes J6065 and G0009.<br />
Emerging issues<br />
Chapter One<br />
MORTALITY & HOSPITALIZATION<br />
The population for Figures 1.1–5 and Tables 1.a–d includes 1981–<br />
2006 incident dialysis patients age 20 and older who reside in the<br />
50 states, the District <strong>of</strong> Columbia, Puerto Rico, or the Territories.<br />
Patients with unknown age, gender, or primary diagnosis are<br />
excluded. Patients are followed from the first service date up to one<br />
year, and are censored at transplant, loss-to-follow-up, or December<br />
31, 2007. Adjusted mortality based on a Cox regression is presented<br />
for all-causes and for cardiovascular disease, infection, and other<br />
causes. Overall mortalities are adjusted for age, gender, race, and<br />
primary cause <strong>of</strong> <strong>ESRD</strong>. The reference cohort consists <strong>of</strong> 2005 incident<br />
dialysis patients.<br />
Figures 1.6–9 and Tables 1.e–h present all-cause and cause-specific<br />
admission rates in the first months <strong>of</strong> hemodialysis. Cohorts<br />
include incident hemodialysis patients age 20 and older, 1991–2006.<br />
Included patients have Medicare as a primary payor and are residents<br />
<strong>of</strong> the 50 states, the District <strong>of</strong> Columbia, Puerto Rico, and<br />
the Territories. As in the hospitalization analyses (Chapter Six),<br />
patients with missing data for age or gender, or with AIDS as a primary<br />
or secondary cause <strong>of</strong> death, are excluded. Since in-center<br />
hemodialysis patients who are younger than 65 and not disabled<br />
cannot bill for hospitalizations until 90 days after <strong>ESRD</strong> initiation,<br />
the 90-day rule is applied to patients age 20–64. Patients are required<br />
to survive the first 90 days after hemodialysis initiation, and are<br />
followed for admissions after day 90. For patients age 65 and older,<br />
however, modality is determined on the first <strong>ESRD</strong> service date, and<br />
to avoid counting the admission at initiation, follow-up begins the<br />
day after initiation. <strong>Data</strong> cleaning and counting <strong>of</strong> admissions and<br />
time at risk for admissions generally follow that described for Refer-
ence Section G; here, however, incident patients are followed during<br />
intervals in the first year <strong>of</strong> hemodialysis rather than in prevalent<br />
years. Censoring occurs at death, three days prior to transplant,<br />
end <strong>of</strong> payor status, one year after initiation, or December 31, 2007,<br />
and also at loss to follow-up for those younger than 65. Cardiovascular<br />
and infectious admissions in Tables 1.f–g and Figures 1.7–8<br />
are identified by the principal ICD-9-CM diagnosis codes listed in<br />
the discussion <strong>of</strong> Figure 6.2. Adjusted rates are calculated with a<br />
model-based adjustment method and an interval Poisson model.<br />
For Figures 1.6–9, rates are adjusted for gender, race, and primary<br />
diagnosis, and the reference cohort includes incident hemodialysis<br />
patients in 2005 who are alive at day 90 after initiation. For Tables<br />
1.e–h, rates are additionally adjusted for age, and the reference cohort<br />
includes incident hemodialysis patients in 2005, age 65 and older.<br />
OUTPATIENT ANTIBIOTIC USE<br />
Figures 1.10–18 use outpatient claims to identify the use <strong>of</strong> intravenous<br />
(IV) antibiotics and the evidence <strong>of</strong> bacterial cultures obtained<br />
in the hemodialysis population. Only patients who remain alive<br />
and on hemodialysis during the entire cohort year are included in<br />
these figures. Prior to 2007, antibiotic claims were typically billed<br />
on a monthly basis, while in 2007 service dates were included to<br />
indicate when a particular IV antibiotic was given. Figure 1.18, therefore,<br />
is limited to 2007, and the timing <strong>of</strong> each IV antibiotic is identified<br />
through the first service date for each type <strong>of</strong> antibiotic. CPT<br />
codes used to identify IV antibiotics include J3370 (vancomycin);<br />
J0690 (cefazolin); J0713, J0692, and J0696 (broad spectrum cephalosporins);<br />
J1580, J3260, J0278, and J1840 (aminoglycosides); and<br />
J1956 (aev<strong>of</strong>loxacin), as well as an extensive list <strong>of</strong> other codes which<br />
account for less than 3 percent <strong>of</strong> IV antibiotics used. These additional<br />
codes are available upon request. HCPCs codes for bacterial<br />
cultures include 87040–87077, 87081, and 87086–87088, where 87040<br />
represents the code for a blood culture.<br />
RACIAL DISPARITIES IN DIABETES<br />
Figure 1.19 shows the distribution <strong>of</strong> NHANES participants, age 20<br />
and older, by body mass index (BMI), gender, race, and ethnicity.<br />
BMI categories are as follows: underweight,
5<br />
App A<br />
pg 366<br />
REFERENCE SECTION A<br />
The Reference Tables present parallel sets <strong>of</strong> counts and rates for<br />
incidence (Section A) and December 31 point prevalence (Section B).<br />
Section B also presents annual period prevalent counts and counts<br />
<strong>of</strong> lost-to-follow-up patients. Because the U.S. population figures<br />
(shown in Reference Section M) used in the <strong>ADR</strong> include only residents<br />
<strong>of</strong> the 50 states and the District <strong>of</strong> Columbia, tables also focus<br />
on patients from these areas. Exceptions are Tables A.1, A.a, A.6, A.8,<br />
A.10, and A.c, all <strong>of</strong> which present data specific to patients in Puerto<br />
Rico and the Territories, or include these patients in the patient<br />
population. Age is computed as <strong>of</strong> the beginning <strong>of</strong> <strong>ESRD</strong> therapy.<br />
Rates in Table A.9 are calculated using the model-based method<br />
(described in the Statistical Methods section later in this appendix),<br />
and adjusted for age, race, and gender, with the 2005 national<br />
population as reference.<br />
REFERENCE SECTION B<br />
With the exception <strong>of</strong> Tables B.1, B.6, B.8, and B.10, these tables<br />
focus on patients in the 50 states and the District <strong>of</strong> Columbia. Age<br />
is calculated as <strong>of</strong> December 31. Table B.9 is constructed similarly<br />
to Table A.9.<br />
Patient characteristics<br />
Chapter Three; C tables<br />
<strong>Data</strong> used in this chapter are obtained from the ME form.<br />
Figure 3.1 includes 2007 incident hemodialysis patients with ME<br />
forms. Access type and primary cause are identified from the ME<br />
form, and data exclude patients with unknown access type.<br />
Figure 3.5 includes incident hemodialysis patients who have valid<br />
EPO claims during each <strong>of</strong> the first four months after initiation.<br />
Treatment modalities<br />
Chapter Four; D tables<br />
Chapter Four and the associated reference tables describe the treatment<br />
modalities <strong>of</strong> all known <strong>ESRD</strong> patients, both Medicare and<br />
non-Medicare, who are not classified as lost-to-follow-up or having<br />
recovered renal function (RRF). The RRF event, introduced in<br />
the 2007 <strong>ADR</strong>, is defined as an event that occurs within the first 180<br />
days <strong>of</strong> <strong>ESRD</strong> initiation and lasts for at least 90 days. Unless noted<br />
otherwise, incident and point prevalent cohorts without the 60-day<br />
stable modality rule are used in the analyses. Treatment modalities<br />
are defined here as follows:<br />
4 center hemodialysis: hemodialysis treatment received at a<br />
dialysis center<br />
4 center self-hemodialysis: hemodialysis administered by the<br />
patient at a dialysis center; a category usually combined with<br />
center hemodialysis<br />
4 home hemodialysis: hemodialysis administered by the patient<br />
at home; cannot always be reliably identified in the database<br />
4 CAPD: continuous ambulatory peritoneal dialysis; usually<br />
combined with CCPD<br />
4 CCPD: continuous cycling peritoneal dialysis; usually combined<br />
with CAPD<br />
4 peritoneal dialysis: analyses typically consist <strong>of</strong> CAPD and<br />
CCPD only, unless stated otherwise<br />
4 other peritoneal dialysis: primarily intermittent peritoneal<br />
dialysis (IPD), a small category except among very young children;<br />
usually combined with unknown dialysis and uncertain<br />
dialysis to form an other/unknown dialysis category<br />
4 uncertain dialysis: a period in which the dialysis type is<br />
unknown or multiple modalities occur but none last 60<br />
days; usually combined with other peritoneal dialysis (IPD)<br />
and unknown dialysis to form an other/unknown dialysis<br />
category<br />
4 unknown dialysis: a period in which the dialysis modality<br />
is not known (e.g. when dialysis sessions are performed in<br />
a hospital); usually combined with other peritoneal dialysis<br />
(IPD) and uncertain dialysis to form an other/unknown<br />
dialysis category<br />
4 renal transplantation: a functioning graft from either a living<br />
donor (a blood relative or other living person) or a cadaveric<br />
donor<br />
4 death: a category not appearing in the year-end modality<br />
tables, which report only living patients, but used as an outcome<br />
(e.g. in tables showing living patients followed for a<br />
period <strong>of</strong> time for their modality treatment history)<br />
Modality and provider characteristics are presented in Figures 4.3<br />
and 4.6. For a description <strong>of</strong> the provider data used in these figures,<br />
please see the discussion <strong>of</strong> Chapter Ten. All provider-related figures<br />
include only dialysis patients. Figures 4.4 and 4.7 show modality<br />
and payor information, while Tables c–d and Figures 4.9–14 provide<br />
a closer look at the demographic and geographic variations <strong>of</strong><br />
home hemodialysis patients.<br />
Rates by age are adjusted for gender and race, rates by gender are<br />
adjusted for age and race, rates by race and ethnicity are adjusted<br />
for age and gender, and rates by primary diagnosis are adjusted for<br />
age, gender, and race.<br />
REFERENCE SECTION D<br />
Reference Section D is divided into four sections. The first, Tables<br />
D.1–11 and D.15–16, provides counts and percentages — by demographics,<br />
geographic location, and treatment modality — <strong>of</strong> incident<br />
and prevalent patients alive at the end <strong>of</strong> each year. Age is computed<br />
as <strong>of</strong> the start <strong>of</strong> <strong>ESRD</strong> for incident patients, and as <strong>of</strong> December 31<br />
for point prevalent patients.<br />
Table D.12 shows modality at day 90 and two years after first<br />
service for all incident Medicare patients beginning renal replacement<br />
therapy from 2003 to 2005. The 90-day rule is used to exclude<br />
patients who die during the first 90 days <strong>of</strong> <strong>ESRD</strong>, and age is computed<br />
as <strong>of</strong> the first <strong>ESRD</strong> service date.<br />
The third section, Tables D.13–14, presents counts <strong>of</strong> prevalent<br />
patients alive at the end <strong>of</strong> each year, by <strong>ESRD</strong> exposure time and<br />
modality. Table D.13 shows counts by the number <strong>of</strong> years <strong>of</strong> <strong>ESRD</strong>,<br />
while Table D.14 presents counts by the number <strong>of</strong> years on the end<strong>of</strong>-year<br />
treatment modality. For the duration <strong>of</strong> <strong>ESRD</strong> exposure, zero<br />
should be read as less than one year, one as at least one full year but<br />
less than two, and so on.<br />
The fourth section, Tables D.17–22, presents counts <strong>of</strong> incident<br />
and prevalent patients alive at the end <strong>of</strong> selected years (i.e. 1999,<br />
2003, 2007), by demographic characteristics, payor category, and<br />
treatment modality. Again, age is computed as <strong>of</strong> the start <strong>of</strong> <strong>ESRD</strong><br />
for incident patients, and as <strong>of</strong> December 31 for point prevalent<br />
patients. The definitions <strong>of</strong> payor categories can be found under<br />
“<strong>Data</strong>base definitions” at the beginning <strong>of</strong> this appendix.<br />
Clinical care & preventive health<br />
Chapter Five<br />
In Figure 5.1, for both Kt/V measurements, 2005 <strong>ESRD</strong> CPM data<br />
are used to calculate a mean Kt/V value for each patient from the<br />
1–3 values present for each, and the percent <strong>of</strong> patients with a mean<br />
Kt/V over a certain threshold is determined. For prevalent hemo-
dialysis patients in 2007, each patient’s URR is obtained from the<br />
G-modifier attached to CPT code 90999, with a revenue code <strong>of</strong> 821<br />
or 825. Each measurement is categorized into one <strong>of</strong> five ranges,<br />
and the median URR is calculated; for patients whose median lies<br />
between two ranges, we assign a weight <strong>of</strong> 0.5 to each. Information<br />
on new hemodialysis patients with an arteriovenous fistula as the<br />
first access is calculated as described for Figure hp.11. Hemoglobin<br />
levels are calculated for EPO-treated, 2007 prevalent hemodialysis<br />
patients, using available EPO claims during the year. EPO claims with<br />
a dose per administration <strong>of</strong> less than 500 or greater than 80,000<br />
units, or with a hematocrit value less than 10 percent or greater<br />
than 50, are omitted. For each patient a yearly mean hemoglobin<br />
is calculated as the mean <strong>of</strong> all hematocrit values divided by three.<br />
<strong>Data</strong> on albumin are obtained for incident hemodialysis patients in<br />
2007 who have a valid result on their ME form; those with a lower<br />
limit equal to zero are omitted. <strong>Data</strong> for influenza, pneumococcal<br />
pneumonia, and hepatitis B vaccinations are from Figures 5.14–16.<br />
ANEMIA TREATMENT<br />
Methods for Figures 5.2–3 are described in the discussion <strong>of</strong> Figures<br />
p.12–13. Figures 5.4–9 include data from all incident dialysis<br />
patients with an EPO claim in the first 30 days <strong>of</strong> <strong>ESRD</strong> therapy, and<br />
at least one EPO claim during each <strong>of</strong> the following six months. EPO<br />
claims with a dose per administration <strong>of</strong> less than 500 units or more<br />
than 80,000 units are omitted, as are those with an average dose<br />
per day (calculated as the total EPO units on the claim divided by<br />
the number <strong>of</strong> days spanned by the claim) <strong>of</strong> less than 100 units or<br />
greater than 10,000 units. For 2007, patients are incident prior to<br />
June 1, to allow them to have six months <strong>of</strong> EPO and/or iron claims<br />
after their incident date. For graphs by starting hemoglobin, patients<br />
are included only if they have a hematocrit listed on the ME form,<br />
and their starting hemoglobin is determined from this value. In<br />
Figure 5.4, a mean hemoglobin is calculated for each patient from<br />
claims during the month, and the average <strong>of</strong> these values is then<br />
calculated for each month. For Figure 5.5, the mean EPO dose per<br />
week is adjusted by only including days during a month in which<br />
a patient is not in an inpatient hospital setting, so that the mean<br />
EPO dose represents outpatient dosing only. Access type is defined<br />
using the ME form.<br />
PREVENTIVE CARE<br />
Figures 5.10–13 present data on diabetic preventive care. <strong>ESRD</strong><br />
patients without Medicare inpatient/outpatient and physician/<br />
supplier coverage during the entire study period are omitted from<br />
these analyses, as are general Medicare patients enrolled in an HMO<br />
or diagnosed with <strong>ESRD</strong> during the study period. Also omitted are<br />
those who do not reside in the 50 states, the District <strong>of</strong> Columbia,<br />
Puerto Rico, or the Territories; who have a missing date <strong>of</strong> birth;<br />
who do not survive the entire reporting period; who have <strong>ESRD</strong> for<br />
fewer than 90 days prior to the start <strong>of</strong> the reporting interval; or<br />
who are lost-to-follow-up during the study period.<br />
Age is generally calculated at the end <strong>of</strong> the study period. Comparisons<br />
<strong>of</strong> diabetic care in <strong>ESRD</strong> and general Medicare patients are<br />
limited to those age 67–75.<br />
Methods and codes used to determine rates <strong>of</strong> diabetic glycosylated<br />
hemoglobin (A1c) testing, lipid testing, and eye examinations<br />
are described in the methods for the HP2010 chapter, Objective<br />
4.8. Patients are defined as having diabetes either through medical<br />
claims (one inpatient/outpatient, two physician/supplier, two outpatient,<br />
or one physician/supplier and one outpatient), or through<br />
a listing <strong>of</strong> diabetes on the ME form as the primary cause <strong>of</strong> <strong>ESRD</strong> or<br />
as a comorbid condition. ICD-9-CM diagnosis codes used to define<br />
diabetes are 250, 357.2, 362.0x, and 366.41. Comprehensive diabetic<br />
care includes at least four A1c tests, at least two lipids tests, and at<br />
least one eye exam. A1c and lipid tests are at least 30 days apart.<br />
The <strong>ESRD</strong> population includes patients initiating therapy at least<br />
90 days prior to January 1 <strong>of</strong> the first year <strong>of</strong> each study period and<br />
with diabetes in the first year. The general Medicare population<br />
includes patients enrolled in Medicare Parts A and B before January<br />
1 <strong>of</strong> the first year <strong>of</strong> each study period, continuously enrolled<br />
in the program for the entire period, and with diabetes in the first<br />
year. Testing is tracked in the second year <strong>of</strong> each study period, and<br />
tests are at least 30 days apart.<br />
Figures 5.14–16 show rates <strong>of</strong> influenza, pneumococcal pneumonia,<br />
and hepatitis B vaccinations for prevalent <strong>ESRD</strong> patients by<br />
modality, age, race/ethnicity, and time period. Cohorts and methods<br />
for Figures 5.14–15 are the same as those described for Objective<br />
14.29 in the HP2010 chapter, while the cohort for Figure 5.16 includes<br />
<strong>ESRD</strong> patients initiating therapy at least 90 days before January 1 <strong>of</strong><br />
each year and alive on December 31. Patients without Medicare inpatient/outpatient<br />
and physician/supplier coverage during the entire<br />
year are omitted, as are those who do not reside in the 50 states, the<br />
District <strong>of</strong> Columbia, Puerto Rico, or the Territories; who have a<br />
missing date <strong>of</strong> birth; or who are lost-to-follow-up during the year.<br />
Age is generally calculated at the end <strong>of</strong> the study period. Hepatitis<br />
B vaccinations are tracked in each year and identified through CPT<br />
codes 90636, 90740, 90743–90744, 90748, 90731, 90723, and G0010.<br />
VASCULAR ACCESS IN PREVALENT PATIENTS<br />
Figures 5.17–23 include prevalent hemodialysis patients who are in<br />
both the USRDS and <strong>ESRD</strong> CPM databases, and whose day 91 begins<br />
prior to October 1 <strong>of</strong> the prevalent year. The access represents the<br />
current access being used according to the CPM data. Claims are<br />
then searched during the following calendar year for events and<br />
complications. Figure 5.23 includes incident peritoneal dialysis<br />
patients from the USRDS database. For Figures 5.20–23, complication<br />
rates are calculated as the number <strong>of</strong> events (from Medicare<br />
claims) divided by the time at risk, which is censored at death,<br />
change in modality, change in payment status, or the placement<br />
<strong>of</strong> a different type <strong>of</strong> access. Vascular access codes are listed in the<br />
methods for Chapter Eleven.<br />
Morbidity & mortality<br />
Chapter Six; G, H, & I tables<br />
HOSPITALIZATION<br />
Methods used for the prevalent patient hospitalization figures in<br />
this chapter generally echo those used for the tables in Reference<br />
Section G (described below). Inclusion and exclusion criteria are<br />
generally the same, as are the methods for counting hospital admissions<br />
and days, and defining the follow-up time at risk. One difference<br />
is the exclusion in Reference Section G <strong>of</strong> patients <strong>of</strong> races<br />
that are unknown or other than white, African American, Native<br />
American, or Asian; these patients are included in the Chapter Six<br />
figures, except where data are presented by race.<br />
Inpatient institutional claims are used for the analyses, and<br />
methods for cleaning claims follow those described for Section G.<br />
Adjusted rates are calculated using the model-based adjustment<br />
method on the observed category-specific rates. This method is<br />
described further in the discussion <strong>of</strong> Section G, and in the statistical<br />
methods section later in this appendix.<br />
Methods for rates in Figures 6.2–3 follow those described for<br />
Reference Section G. In Figure 6.2, methods include those described<br />
Morbidity & mortality<br />
4 APPENDIx A: ANAlyTICAl METHODS<br />
<strong>2009</strong> USRDS Annual <strong>Data</strong> Report<br />
Vol 2<br />
esrd<br />
5<br />
App A<br />
pg 367
5<br />
App A<br />
pg 368<br />
for Figure p.17 in the Précis. Principal ICD-9-CM diagnosis codes<br />
are used to identify cardiovascular and infectious admissions. The<br />
cardiovascular category consists <strong>of</strong> codes 276.6, 394–398.99, 401–405,<br />
410–420, 421.9, 422.90, 422.99, 423–438, and 440–459, while infection<br />
is indicated by codes 001–139, 254.1, 320–326, 331.81, 372–372.39, 373.0–<br />
373.2, 382–382.4, 383.0, 386.33, 386.35, 388.60, 390–393, 421–421.1, 422.0,<br />
422.91–422.93, 460–466, 472–474.0, 475–476.1, 478.21–478.24, 478.29,<br />
480–490, 491.1, 494, 510–511, 513.0, 518.6, 519.01, 522.5, 522.7, 527.3, 528.3,<br />
540–542, 566–567.9, 569.5, 572–572.1, 573.1–573.3, 575–575.12, 590–590.9,<br />
595–595.4, 597–597.89, 598, 599.0, 601–601.9, 604–604.9, 607.1, 607.2,<br />
608.0, 608.4, 611.0, 614–616.1, 616.3–616.4, 616.8, 670, 680–686.9, 706.0,<br />
711–711.9, 730–730.3, 730.8–730.9, 790.7–790.8, 996.60–996.69, 997.62,<br />
998.5, and 999.3. Figure 6.3 presents adjusted rates <strong>of</strong> total hospital<br />
admissions and days per patient year. Prevalent <strong>ESRD</strong> patients are<br />
included, and rates are adjusted for age, gender, race, & primary<br />
diagnosis with the 2005 <strong>ESRD</strong> cohort used as the reference.<br />
Figure 6.4 shows adjusted admission rates for principal diagnoses<br />
for prevalent <strong>ESRD</strong> patients. Again, rates are adjusted for age, gender,<br />
race, and primary diagnosis, with <strong>ESRD</strong> patients in 2005 used as the<br />
reference cohort. Principal ICD-9-CM codes are as follows: pneumonia,<br />
480–486 and 487.0; bacteremia/septicemia, 038.0–038.9 and<br />
790.7; cellulitis, 682; vascular access infection (hemodialysis patients<br />
only), 996.62; and peritonitis (peritoneal dialysis patients only), 567.<br />
Table 6.a presents adjusted admission rates and relative risks <strong>of</strong><br />
admission among adult (age 20 and older) period prevalent hemodialysis<br />
patients. Principal ICD-9-CM diagnosis codes are used to<br />
identify cardiovascular and infectious admissions, and are listed in<br />
the discussion <strong>of</strong> Figure 6.2. Vascular access admissions are defined<br />
as “pure” inpatient vascular access events, as described for vascular/<br />
dialysis access events in Tables G.11–15; vascular access, however,<br />
excludes the codes specific to peritoneal dialysis catheters (996.56,<br />
996.68, and V56.2). Rates and relative risks are adjusted for age,<br />
gender, race, and primary <strong>ESRD</strong> diagnosis, while values presented<br />
by one factor are adjusted for the other three. Adjusted relative<br />
risks are calculated with a Poisson model, with reference groups<br />
as listed. For adjusted rates, hemodialysis patients in 2005 are used<br />
as the reference cohort. Values by age, gender, race, and primary<br />
diagnosis are shown for 2006–2007 prevalent hemodialysis patients.<br />
Figures 6.9–11 show rates by age, adjusted for gender, race, and<br />
primary diagnosis, using the model-based adjustment method. They<br />
include period prevalent dialysis (Figures 6.9–10) and hemodialysis<br />
(Figure 6.11) patients age 20 and older, with the 2005 dialysis cohort<br />
as the reference. Figure 6.9 presents adjusted rates <strong>of</strong> cause-specific<br />
hospital admissions per patient year. The categories for cardiovascular<br />
disease and infection are defined by the codes listed for Figure<br />
6.2; the infection codes for Figure 6.9 exclude those due to an internal<br />
device. The principal ICD-9-CM diagnosis codes used for infection<br />
due to internal device (related to a vascular access device or peritoneal<br />
dialysis catheter) are 996.62 and 996.68. At the end <strong>of</strong> 1998 a<br />
new ICD-9-CM code was added for infections due to internal devices<br />
in peritoneal dialysis patients; data prior to this date are omitted.<br />
Figure 6.10 shows adjusted event rates for inpatient coronary<br />
revascularization. Patients are followed until the first coronary<br />
revascularization event, and are censored at the earliest <strong>of</strong> death,<br />
three days prior to transplant, or the end <strong>of</strong> the calendar year. Events<br />
are identified from inpatient and physician/supplier claims occurring<br />
within a hospital stay. The following ICD-9-CM procedure and<br />
CPT codes are used to identify events: angioplasty, procedure codes<br />
00.66, 36.01, 36.02, and 36.05, and CPT codes 92982, 92984, 92995,<br />
and 92996; coronary stents, procedure code 36.06 and CPT codes<br />
92980–92981; and bypass, procedure codes 36.1x and CPT codes<br />
33510–33523, 33533–33536. Rates for coronary stents are shown starting<br />
in 1997, due to the release <strong>of</strong> CPT codes.<br />
Figure 6.11 displays adjusted vascular access placement rates for<br />
period prevalent adult hemodialysis patients. These are not hospital<br />
admission rates, but procedure rates for vascular access placements<br />
in an inpatient setting. Vascular access placements are obtained<br />
from CPT codes on physician/supplier claims, and are restricted to<br />
those occurring in the hospital (during an inpatient stay or emergency<br />
room visit). Categories include catheters, fistulas, and grafts,<br />
and the CPT codes used to define them are found in Table a.b later<br />
in this appendix. The category for all vascular access placements<br />
includes the CPT codes for all <strong>of</strong> the above categories. Methods are<br />
also used to exclude vascular access used for purposes other than<br />
dialysis. Catheter placement codes that are not specific for dialysis<br />
are included only if they are accompanied by an ICD-9-CM renal<br />
diagnosis code. Also, rates for catheter and all vascular access placements<br />
exclude patients with specific chemotherapy or parenteral<br />
nutrition claims during the year. Inpatient/outpatient institutional,<br />
physician/supplier, and durable medical equipment claims indicate<br />
chemotherapy (CPT codes 96408, 96410, and 96412) or parenteral<br />
nutrition (CPT codes B4164–B5200, B9004, B9006, and B9999).<br />
MORTALITY<br />
Patient cohorts for all mortality figures here include both Medicare<br />
and non–Medicare patients living in the 50 states, the District <strong>of</strong><br />
Columbia, Puerto Rico, and the Territories.<br />
Figure 6.1 shows trends in mortality rates by modality for incident<br />
<strong>ESRD</strong> patients, 1980–2006. The population groups include all-<strong>ESRD</strong>,<br />
hemodialysis, CAPD/CCPD, and first transplant (known deceased<br />
and living donors only). Adjusted first-, second-, third-, fourth-,<br />
and fifth-year mortality rates for incident cohorts — including all-<br />
<strong>ESRD</strong>, hemodialysis, CAPD/CCPD, and first transplant patients — are<br />
computed from the Cox model using the model-based adjustment<br />
method, described later in this appendix. Mortality rates for all<br />
patients are adjusted for age, gender, race, and primary diagnosis.<br />
The reference population for adjusted rates consists <strong>of</strong> 2005 incident<br />
<strong>ESRD</strong> patients.<br />
Figure 6.5 presents unadjusted all-cause mortality, by HSA, for<br />
2007 prevalent <strong>ESRD</strong>, dialysis, transplant, and general Medicare<br />
patients age 65 and older. General Medicare patients are non-<strong>ESRD</strong><br />
patients with at least one month <strong>of</strong> Medicare eligibility in 2007;<br />
they are followed from the first day <strong>of</strong> the first month with Medicare<br />
eligibility until death or December 31, 2007. <strong>ESRD</strong> patients are<br />
followed from January 1 until December 31, 2007.<br />
Table 6.b shows expected remaining lifetimes for dialysis patients,<br />
renal transplant patients, and the general U.S. population in 2004.<br />
For period prevalent <strong>ESRD</strong> patients in 2007, expected lifetimes are<br />
calculated using the death rates from the mixed model with 16 age<br />
groups, assuming constant survival and mortality within each age<br />
group. Patient inclusion and exclusion criteria are those used in<br />
Tables H.4.4 and H.28.4, and the method for calculating expected<br />
remaining lifetimes is described in the section on statistical methods<br />
at the end <strong>of</strong> this appendix. <strong>Data</strong> for the general population are<br />
obtained from the CDC’s National Vital Statistics Reports.<br />
Figure 6.6 shows all-cause mortality by age for 2007 prevalent<br />
<strong>ESRD</strong>, dialysis, transplant, and general Medicare patients. All-cause<br />
mortality rates by age are calculated using generalized mixed models,<br />
and are adjusted for gender and race. Medicare patients from<br />
2007 are used as the reference cohort.<br />
Figure 6.7 illustrates trends in mortality rates by patient vintage<br />
for period prevalent dialysis patients alive on renal replacement
therapy on January 1, with a first service date at least 90 days prior<br />
to the beginning <strong>of</strong> the year, and reaching day 91 <strong>of</strong> <strong>ESRD</strong> treatment<br />
during the year. Patients with unknown age or gender, or<br />
<strong>of</strong> a race other than white, African American, Native American,<br />
or Asian, are excluded. Patients are followed from January 1 until<br />
death, transplantation, or the end <strong>of</strong> the year, and all-cause mortality<br />
rates are adjusted for age, gender, race, and primary diagnosis<br />
using generalized mixed models. The reference population consists<br />
<strong>of</strong> 2005 prevalent dialysis patients, and adjusted mortalities across<br />
vintages are comparable.<br />
Figure 6.8 presents five-year survival by modality for 1993–1997<br />
and 1998–2002 incident patients, with modality defined on the first<br />
<strong>ESRD</strong> service date. Transplant is defined as the first transplant in<br />
the incident year. Patients with unknown age, gender, or primary<br />
diagnosis, and those with a listed age greater than 110, are excluded,<br />
as are dialysis patients who die or receive a transplant in the first 90<br />
days. Dialysis patients are followed from day 91 until death, transplantation,<br />
or the end <strong>of</strong> 2007, while transplant patients are followed<br />
from the first transplant date until death or the end <strong>of</strong> 2007. All probabilities<br />
are adjusted for age, gender, and race; overall probabilities<br />
are also adjusted for primary diagnosis. The reference population<br />
consists <strong>of</strong> 2005 incident <strong>ESRD</strong> patients, and adjusted probabilities<br />
are comparable across modalities.<br />
Figure 6.12 displays adjusted all-cause and cause-specific mortality<br />
in incident dialysis patients. The cohort includes dialysis patients,<br />
1991–2006, residing in the 50 states, the District <strong>of</strong> Columbia, Puerto<br />
Rico, or the Territories. Patients with unknown age, gender, or primary<br />
diagnosis are excluded, as are those with a listed age greater<br />
than 110. Patients are followed from the first service date up to one<br />
year, and censored at transplant or recovery <strong>of</strong> kidney function.<br />
Overall mortality rates are adjusted for age, gender, race, and primary<br />
diagnosis. The reference population consists <strong>of</strong> 2005 incident<br />
dialysis patients, and adjusted mortality rates can be compared<br />
across years and causes <strong>of</strong> mortality.<br />
Figures 6.13–14 display adjusted mortality due to cardiovascular<br />
disease and infection, respectively, by age. Populations are the same<br />
as in Figure 6.12. Mortality rates by age are adjusted for gender, race,<br />
and primary diagnosis. The reference population consists <strong>of</strong> 2005<br />
incident dialysis patients.<br />
STROKE & TIA IN HEMODIALYSIS PATIENTS<br />
Stroke and transient ischemic attack (TIA) in Figures 6.15–18 and<br />
Table 6.c are identified using ICD-9-CM codes 430.x, 431.x, 432.x, 434.x,<br />
436.x (stroke), and 435.x (TIA), and patients are required to have one<br />
inpatient claim or two outpatient or Part B claims with a diagnosis<br />
to be identified as having had a stroke. Prevalent patients in 2005<br />
include those who survive and remain on hemodialysis during the<br />
entire cohort year, while those defined as having an incident stroke in<br />
2006 include only those without a stroke in 2005. The time to stroke/<br />
TIA in 2006 is censored by death or a change in either modality or<br />
payor status. Figure 6.16 includes only patients who reach <strong>ESRD</strong>, and<br />
excludes those with any stroke claims in the two years prior to initiation.<br />
In calculating the cumulative probability <strong>of</strong> walking disabilities<br />
(Figure 6.17) and death (Figure 6.18) after stroke, time to these<br />
events prior to a stroke is attributed to the “without or before stroke”<br />
group. Walking disabilities in Figure 6.17 are identified through the<br />
following codes: ICD-9-CM codes 782.1, abnormal gait; 719.7, difficulty<br />
walking; V15.88, history <strong>of</strong> fall; and E88.01, E88.09, E88.42–46,<br />
E88.59, E88.88, and E88.89 for a specific type <strong>of</strong> fall; and DME codes<br />
for canes, walkers, or wheelchairs, E01.00, E01.05, E01.30–E01.49,<br />
E09.50–E1030, E10.50–E12.98, K00.01–K00.12, and K00.14–K0108.<br />
REFERENCE SECTION G<br />
Hospitalization reference tables present adjusted total admission<br />
and hospital day rates by year from 1993 to 2007. They begin in<br />
1993 because Medicare inpatient claims are available beginning in<br />
1991, and the model-based adjustment method uses data from the<br />
current and previous two years to obtain the predicted rates. (This<br />
method is further discussed later in this section and in the statistical<br />
methods section at the end <strong>of</strong> this appendix.)<br />
Because hospitalization data for non-Medicare patients may<br />
be incomplete, analyses in this section include only patients with<br />
Medicare as their primary payor. Hospitalization data are obtained<br />
from inpatient/outpatient institutional inpatient claims, with the<br />
following exceptions: supplementary tables G.1.4–G.10.4 and G.1.5–<br />
G.10.5 (on our website and CD-ROM) use only REBUS inpatient data.<br />
Tables G.1–18 include dialysis and transplant patients on their<br />
modality for at least 60 days, reaching day 91 <strong>of</strong> <strong>ESRD</strong> by the end<br />
<strong>of</strong> the year, and residing in the 50 states, the District <strong>of</strong> Columbia,<br />
Puerto Rico, and the Territories. Excluded are patients with AIDS as<br />
a primary or secondary cause <strong>of</strong> death; patients with missing values<br />
for age, gender, or race; and patients <strong>of</strong> races that are unknown or<br />
other than white, African American, Native American, or Asian.<br />
Age is determined on January 1 <strong>of</strong> each year. Patients are also classified<br />
according to their primary cause <strong>of</strong> <strong>ESRD</strong>, in which the “other”<br />
category includes patients with missing data or causes other than<br />
diabetes, hypertension, or glomerulonephritis.<br />
Patients are classified by modality at the beginning <strong>of</strong> the year:<br />
4 all dialysis: patients on hemodialysis, CAPD/CCPD, or dialysis<br />
<strong>of</strong> an unknown type, as well as those on more than one<br />
modality in the past 60 days<br />
4 hemodialysis: patients on hemodialysis for at least 60 days<br />
as <strong>of</strong> the start <strong>of</strong> the period at risk<br />
4 CAPD/CCPD: patients on CAPD/CCPD for at least 60 days as <strong>of</strong><br />
the start <strong>of</strong> the period at risk<br />
4 transplant: patients with a functioning transplant, and who<br />
received the transplant less than three years prior to the start<br />
<strong>of</strong> the period at risk<br />
4 all-<strong>ESRD</strong>: all patients<br />
To limit the contribution <strong>of</strong> patient years at risk from patients<br />
who do not have Medicare coverage but do have Medicare as a secondary<br />
payor or HMO coverage, and who therefore have incomplete<br />
hospitalization data, cohorts include only patients with Medicare<br />
Parts A and B coverage at the start <strong>of</strong> follow-up. The follow-up period<br />
is censored when payor status changes to a patient no longer having<br />
Medicare Parts A and B coverage or Medicare as a primary payor.<br />
For patients in the all-dialysis, hemodialysis, and peritoneal dialysis<br />
categories, the period at risk for all hospitalization analyses is<br />
from January 1 or day 91 <strong>of</strong> <strong>ESRD</strong> until the earliest <strong>of</strong> death, three<br />
days prior to transplant, end <strong>of</strong> Medicare Parts A and B coverage,<br />
or December 31. Modality change is considered a censoring event<br />
only in the case <strong>of</strong> a change from dialysis to transplant. For dialysis<br />
patients in the all-<strong>ESRD</strong> category, in contrast, the analysis period<br />
is censored only at death, end <strong>of</strong> Medicare Parts A and B coverage,<br />
or December 31 <strong>of</strong> the year; a modality change is not used as a censoring<br />
event. For transplant patients in the all-<strong>ESRD</strong> and transplant<br />
categories, the period is censored at the earliest <strong>of</strong> death, three years<br />
after the transplant date, end <strong>of</strong> Medicare Parts A and B coverage,<br />
or December 31 <strong>of</strong> the year. The censoring <strong>of</strong> transplant patients at<br />
three years following the transplant is necessary because Medicare<br />
eligibility may be lost and hospitalization data may be incomplete<br />
for these patients.<br />
Morbidity & mortality<br />
4 APPENDIx A: ANAlyTICAl METHODS<br />
<strong>2009</strong> USRDS Annual <strong>Data</strong> Report<br />
Vol 2<br />
esrd<br />
5<br />
App A<br />
pg 369
5<br />
App A<br />
pg 370<br />
Time at risk is calculated differently for hospital days and total<br />
admissions. Since a hospitalized patient remains at risk for additional<br />
hospital days, rates for hospital days include hospital days<br />
in the time at risk. Since a currently hospitalized patient is not,<br />
however, at risk for new admissions, hospital days for each year<br />
are subtracted from the time at risk for total admissions. In the<br />
case <strong>of</strong> hospitalizations in which admission occurs the same day<br />
as discharge, zero days are subtracted from the time at risk for<br />
total admissions. When bridge hospitalizations span the start <strong>of</strong><br />
the analysis period, only the days within the period are subtracted<br />
from the time at risk for total admissions.<br />
All admissions and hospital days during the analysis period are<br />
included, respectively, in the total admissions and hospital days for<br />
each year. An admission for a hospitalization that occurs before<br />
and spans the start <strong>of</strong> the analysis period is excluded from the total<br />
admissions for that period, and only the hospitalization days within<br />
the period are counted in the total days for hospital day rates. The<br />
minimum length <strong>of</strong> stay is one day, and hospitalizations with an<br />
admission and discharge on the same day, as well as those with a<br />
discharge the day after admission, are both counted as one day.<br />
As in previous <strong>ADR</strong>s, all overlapping and only certain adjacent<br />
hospitalizations are combined, due to the fact that many adjacent<br />
claims may actually be legitimate separate hospitalizations. Specifically,<br />
hospitalizations with an admission on the same day or the<br />
day after a previous discharge are combined only when there is a<br />
discharge transfer code or indication <strong>of</strong> an interim claim. In the<br />
1991–2007 institutional inpatient claims, for example, 4.3 percent <strong>of</strong><br />
the hospitalizations were combined using these criteria. In the case<br />
<strong>of</strong> two hospitalizations combined into one, the principal diagnosis<br />
and procedure codes are retained from the first <strong>of</strong> the two hospitalizations,<br />
with the combined hospitalization extending from the<br />
first admission date to the last discharge date.<br />
The methodology for computing adjusted total admission and<br />
hospital day rates uses the model-based adjustment method (discussed<br />
in the statistical methods section). Predicted rates for each<br />
subgroup combination <strong>of</strong> age, gender, race, primary diagnosis, and<br />
year are obtained using a model with the Poisson assumption. For<br />
prevalent patient cohorts, this model uses data from the current and<br />
previous two years, with respective weights <strong>of</strong> 1, ¼, and ⅛. Adjusted<br />
rates are then calculated using the direct adjustment method, with<br />
all 2005 <strong>ESRD</strong> patients as the reference cohort.<br />
Tables G.11–15 show inpatient utilization in period prevalent<br />
<strong>ESRD</strong> patients. Methods — including modality definitions, inclusion<br />
criteria, data cleaning, follow-up time definitions, and rate<br />
calculations — generally follow those previously described for the<br />
total admission rates in Tables G.1–5, but some differences do exist.<br />
While patients <strong>of</strong> races other than white, African American, Native<br />
American, or Asian are excluded from G.1–5, they are included in<br />
G.11–15, except where rates are given by race. Rates are unadjusted<br />
and reflect total admissions per 100 patient years for 1999–2001,<br />
2002–2004, and 2005–2007 (pooled) prevalent patients. While the<br />
rates for all causes are computed similarly to the unadjusted rates in<br />
G.1–5, the other nine cause-specific categories only include admissions<br />
for specific diseases. Vascular access and peritoneal dialysis<br />
access hospitalizations are those classified as “pure” inpatient<br />
vascular/dialysis access events. Such access events are defined as<br />
admissions with a specified ICD-9-CM principal diagnosis code, or<br />
an ICD-9-CM principal procedure code in conjunction with a certain<br />
DRG code. Codes are listed later in this appendix in Table a.c.<br />
If an admission does not qualify as vascular/dialysis access, it is<br />
classified by the principal diagnosis code into one <strong>of</strong> eight other<br />
mutually exclusive groups. Categories and ICD-9-CM codes are as<br />
follows: circulatory diseases, 390–459; digestive diseases, 520–579;<br />
genitourinary diseases, 580–629; endocrine and metabolic diseases,<br />
240–279; respiratory diseases, 460–519; infectious diseases, 001–139;<br />
and cancer, 140–172, 174–208, 230–231, and 233–234. Hospitalizations<br />
that do not fall under any <strong>of</strong> these categories are counted<br />
under all others.<br />
Tables G.16–18 display hospital admission rates for infections<br />
including bacteremia/septicemia, pneumonia, and urinary tract<br />
infection. Rates reflect hospital admissions for the purpose <strong>of</strong> these<br />
infections and are therefore categorized by principal ICD-9-CM<br />
diagnosis codes. Codes for bacteremia/septicemia and pneumonia<br />
are listed under the discussion <strong>of</strong> Figure 6.4; codes for urinary<br />
tract infection include 590–590.9, 595–595.4, 597–597.89, 598, 599.0,<br />
601–601.9, 604–604.9, 607.1–2, 608.0, 608.4, 616.1, 616.3–4, and 616.8.<br />
Rates are unadjusted and show admissions per 100 patient years by<br />
modality for prevalent <strong>ESRD</strong> patients pooled across years.<br />
Supplementary tables providing additional rates and counts are<br />
available on our website and CD-ROM. Standardized hospitalization<br />
ratios by state (Table G.a) are calculated using the Bayesian<br />
method, also described in the statistical methods section. Tables<br />
G.1.1–10.1 present adjusted rates similar to those shown in G.1–10,<br />
but include more patient subgroups. Rates <strong>of</strong> admissions per 1,000<br />
patients and days per patient, rather than per patient year, are also<br />
available. The rates in these tables (G.1.2–10.2) are calculated with<br />
denominators consisting <strong>of</strong> the total patients, rather than the total<br />
time at risk in patient years. Additional tables (G.1.3–10.3) display<br />
the counts <strong>of</strong> the total admissions or hospital days, patient years at<br />
risk, and total patients that are used to calculate the rates.<br />
Long-term trends in hospitalization data are also available in<br />
supplementary tables (G.1.4–10.4). Total admission rates per 1,000<br />
patient years and hospital day rates per patient year from 1980–2007<br />
are presented in G.1.4–3.4 and G.6.4–8.4. Due to the instability <strong>of</strong><br />
rates in earlier years, these rates are presented from 1983 in G.4.4<br />
and G.9.4 for peritoneal dialysis patients, and from 1986 in G.5.4<br />
and G.10.4 for transplant patients. Rather than using institutional<br />
inpatient claims data, which are unavailable for earlier years, these<br />
tables use only REBUS inpatient claims data. All one-day hospitalizations<br />
with a discharge date on the same or next day as the admission<br />
date are excluded from these tables, since, prior to 1991, the REBUS<br />
data include no hospitalizations <strong>of</strong> less than 24 hours. To enable<br />
comparison <strong>of</strong> rates across years, therefore, only hospitalizations<br />
with a length <strong>of</strong> at least two days are included. As a result, these rates<br />
are lower than those in Tables G.1.1–10.1, which use all institutional<br />
inpatient claims. Other methods (rate calculation, model-based<br />
adjustment, etc.) generally follow those discussed for Tables G.1–10.<br />
Additionally, supplementary tables G.1.5–10.5 present counts <strong>of</strong> total<br />
admissions or days, patient years at risk, and total patients, which<br />
correspond with the rates presented in G.1.4–10.4.<br />
REFERENCE SECTION H<br />
Cohorts for tables in Section H include both Medicare and non–<br />
Medicare patients living in the 50 states, the District <strong>of</strong> Columbia,<br />
Puerto Rico, and the Territories.<br />
Cohorts in Tables H.1–31 include both incident and prevalent<br />
patients. Incident cohorts are limited to patients who reach day 91<br />
<strong>of</strong> <strong>ESRD</strong> treatment during the year, while prevalent cohorts include<br />
patients alive on renal replacement therapy on January 1 and whose<br />
first service date is at least 90 days prior to the beginning <strong>of</strong> the year.<br />
Because calculations include only one year <strong>of</strong> follow-up, a prevalent<br />
patient surviving to the end <strong>of</strong> the year contributes one year at risk,
while a prevalent patient dying during the year contributes less than<br />
one year. Since the calculation for incident patients begins on day<br />
91 <strong>of</strong> <strong>ESRD</strong>, most patients contribute less than one year at risk; a full<br />
year is contributed only if day 91 <strong>of</strong> <strong>ESRD</strong> is January 1 and the patient<br />
survives to the end <strong>of</strong> the year. Patients considered lost-to-followup<br />
at the beginning <strong>of</strong> the year are excluded. The period at risk is<br />
not censored at the start <strong>of</strong> a lost-to-follow-up period, however; if a<br />
patient enters the lost-to-follow-up category during a calendar year,<br />
he or she remains in the death rate computation until the end <strong>of</strong><br />
that year. Patient cohort populations <strong>of</strong>ten overlap. Patients with a<br />
functioning transplant on the start date, for example, are included<br />
in the all-<strong>ESRD</strong> and functioning transplant categories, while patients<br />
on dialysis are defined as both all-<strong>ESRD</strong> and all-dialysis. A patient<br />
in the all-dialysis category may also be reported in one <strong>of</strong> two subgroups<br />
— hemodialysis or CAPD/CCPD — if he or she has been on<br />
that modality for at least the previous 60 days. Dialysis patients not<br />
on hemodialysis or CAPD/CCPD, or on that modality for fewer than<br />
60 days, are included only in the all-<strong>ESRD</strong> and all-dialysis categories.<br />
Cohorts in Tables H.32–46 include incident <strong>ESRD</strong>, dialysis, hemodialysis,<br />
CAPD/CCPD, and transplant patients who survive the first<br />
90 days. Patient selection criteria are the same for both unadjusted<br />
and adjusted mortality rates. All new <strong>ESRD</strong> patients who have a<br />
first <strong>ESRD</strong> service date between January 1, 1980, and December 31,<br />
2006, are included in the analysis. For incident <strong>ESRD</strong> and transplant<br />
cohorts, these patients are followed from day 91 until death or<br />
December 31, 2007; for incident dialysis, hemodialysis, and CAPD/<br />
CCPD cohorts, patients are followed from day 91 until death, transplant,<br />
or December 31, 2007.<br />
Tables H.1, H.2, and H.2.1–2.4 present mortality data for all <strong>ESRD</strong><br />
patients. Total deaths are presented in Table H.1. Overall unadjusted<br />
and adjusted annual mortality rates by age, gender, race/ethnicity,<br />
primary diagnosis, and vintage are presented in Table H.2. The<br />
unadjusted mortality rates are calculated by dividing total patient<br />
deaths in a category — male, for example — by total follow-up time<br />
in the same category. For the adjusted rates, generalized mixed<br />
models are used to calculate the smoothed rates; these methods are<br />
described in the statistical methods section later in this appendix.<br />
After obtaining smoothed rates from the generalized mixed models,<br />
direct adjustment methods are used. Overall mortality rates are<br />
adjusted for age, gender, race, primary diagnosis, and vintage, while<br />
rates for each individual category are adjusted for the remaining<br />
four. The reference population includes 2005 prevalent <strong>ESRD</strong> patients.<br />
a aii<br />
Collapsed categories <strong>of</strong> death<br />
(used for Reference Table H.29)<br />
Acute myocardial infarction Myocardial infarction, acute<br />
Hyperkalemia Hyperkalemia<br />
Pericarditis Pericarditis, including cardiac tamponade<br />
Atherosclerotic heart disease Atherosclerotic heart disease<br />
Cardiomyopathy Cardiomyopathy<br />
Cardiac dysrhythmia Cardiac dysrhythmia<br />
Cardiac arrest Cardiac arrest, cause unknown<br />
Valvular heart disease Valvular heart disease<br />
Pulmonary edema Pulmonary edema<br />
Cerebrovascular disease Cerebrovascular accident including<br />
intracraniahemorrhage; ischemic brain damage/anoxic encephalopathy<br />
G. I. hemorrhage Hemorrhage from tx site; hemorrhage from vascular<br />
access; hemorrhage from dialysis circuit; hemorrhage from ruptured<br />
vascular aneurysm; hemorrhage from surgery; other<br />
Septicemia Septicemia, due to peritonitis; septicemia, due to peripheral<br />
vascular disease, gangrene; septicemia, other<br />
Pulmonary infection Pulmonary infection (bacterial); pulmonary infection<br />
(fungal); pulmonary infection (other); tuberculosis<br />
Table H.2.1 presents adjusted mortality rates by primary diagnosis.<br />
The method for calculating the adjusted rate is same as that<br />
in Table H.2, except that vintage is not included. Overall mortality<br />
rates are adjusted for age, gender, race, and primary diagnosis,<br />
while rates for diabetes, hypertension, glomerulonephritis, and other<br />
causes <strong>of</strong> <strong>ESRD</strong> are adjusted for age, gender, and race. The difference<br />
between Table H.2.1 and H.2.2 is that the mortality rate is expressed<br />
as per 1,000 patient years in H.2.1 and per 1,000 patients in H.2.2.<br />
Table H.2.3 shows total death counts, total follow-up years, and total<br />
patient counts. Table H.2.4 presents mortality rates by patient age,<br />
gender, race, and primary diagnosis for 2007 prevalent <strong>ESRD</strong> patients.<br />
Mortality rates in Table H.2.4 are smoothed and unadjusted using<br />
a generalized mixed model.<br />
The same methods are used for Tables H.3, H.4, and H.4.1–4<br />
(dialysis); Tables H.11, H.12, and H.12.1–4 (hemodialysis); Tables<br />
H.19, H.20, and H.20.1–4 (CAPD/CCPD); and Tables H.27, H.28, and<br />
H.28.1–4 (transplant).<br />
Tables H.5–10 (dialysis), H.13–18 (hemodialysis), and H.21–26<br />
(CAPD/CCPD) include total patient deaths and annual unadjusted<br />
and adjusted mortality rates for patients who have never been on<br />
the transplant waitlist, for those who have been listed, and for those<br />
who have returned to the modality after a transplant.<br />
In Table H.29, unadjusted mortality rates are reported by primary<br />
cause <strong>of</strong> death for patients prevalent at the beginning <strong>of</strong>, or<br />
incident during, 2005–2007. The unadjusted mortality rate for a<br />
specific primary cause <strong>of</strong> death in each subgroup is obtained by<br />
dividing the total deaths from that cause by the subgroup’s total<br />
follow-up time, and the sum <strong>of</strong> rates for each cause in a subgroup<br />
is equal to the overall mortality rate <strong>of</strong> that subgroup. Two new categories<br />
<strong>of</strong> primary cause <strong>of</strong> death due to congestive heart failure and<br />
withdrawal from dialysis have been added, based on the new <strong>ESRD</strong><br />
Death Notification form introduced in October, 2005.<br />
Patient populations for Tables H.32–46 are the same as those<br />
used in Reference Section I. The population groups include all <strong>ESRD</strong>,<br />
all dialysis, hemodialysis, CAPD/CCPD, and first transplant (known<br />
deceased and living donors only). Adjusted first-, second-, and thirdyear<br />
mortality rates for incident cohorts — including all <strong>ESRD</strong>, all<br />
dialysis, hemodialysis, CAPD/CCPD, and first transplant patients — are<br />
computed from the Cox model using the model-based adjustment<br />
method, described later in this appendix. These rates are presented<br />
using aggregate categories for age, gender, race, and primary diagnosis,<br />
and a rate presented for one variable is adjusted for the remaining<br />
Viral infection Viral infection, CMV; viral infection, other; Hepatitis B; other<br />
viral hepatitis<br />
AIDS AIDS<br />
Other infection Infection, other; fungal peritonitis<br />
Cachexia Cachexia<br />
Malignant disease Malignant disease, patient ever on immunosuppressive<br />
therapy; malignant disease<br />
Other cause Pulmonary embolus; mesenteric infarction/ischemic bowel;<br />
liver-drug toxicity; cirrhosis; polycystic liver disease; liver failure,<br />
cause unknown or other; pancreatitis; perforation <strong>of</strong> peptic ulcer;<br />
perforation <strong>of</strong> bowel; bone marrow depression; dementia, including<br />
dialysis dementia, Alzheimer’s; seizures; diabetic coma, hyperglycemia,<br />
hypoglycemia; chronic obstructive pulmonary disease (COPD);<br />
complications <strong>of</strong> surgery; air embolism; accident related to treatment;<br />
accident unrelated to treatment; suicide; drug overdose (street drugs);<br />
drug overdose; other identified cause <strong>of</strong> death.<br />
Unknown cause Unknown<br />
Missing forms Missing forms<br />
Morbidity & mortality<br />
4 APPENDIx A: ANAlyTICAl METHODS<br />
<strong>2009</strong> USRDS Annual <strong>Data</strong> Report<br />
Vol 2<br />
esrd<br />
5<br />
App A<br />
pg 371
5<br />
App A<br />
pg 372<br />
three. Overall mortality rates for all patients are adjusted for each <strong>of</strong><br />
the four variables. Mortality rates for Hispanic and non-Hispanic<br />
patients, however, are unadjusted (crude) rates calculated as the<br />
number <strong>of</strong> deaths over patient years at risk. The reference population<br />
for adjusted rates consists <strong>of</strong> 2005 incident <strong>ESRD</strong> patients.<br />
REFERENCE SECTION I<br />
These tables, which include only incident cohorts, present patient<br />
counts and survival probabilities. All causes <strong>of</strong> death are included,<br />
as are all non-Medicare patients and patients living in the 50 states,<br />
the District <strong>of</strong> Columbia, Puerto Rico, and the Territories. Patients<br />
with unknown gender or age, or whose listed age is greater than<br />
110, are excluded.<br />
Patient selection criteria are the same for both unadjusted and<br />
adjusted survival probabilities. All new <strong>ESRD</strong> patients who have a<br />
first <strong>ESRD</strong> service date between January 1, 1980, and December 31,<br />
2006, are included in the analysis. These patients are followed until<br />
December 31, 2007, with a maximum follow-up time <strong>of</strong> 24 years and<br />
a minimum <strong>of</strong> one year.<br />
Results are reported for the following groups:<br />
4 all <strong>ESRD</strong>: all <strong>ESRD</strong> patients beginning renal replacement therapy<br />
in a calendar year and surviving beyond day 90; patients<br />
are censored only at the end <strong>of</strong> follow-up<br />
4 dialysis only: all dialysis patients starting renal replacement<br />
therapy in a calendar year, surviving beyond day 90, and<br />
not receiving a transplant by day 91; patients are censored<br />
at transplant or the end <strong>of</strong> follow-up<br />
4 hemodialysis only: all hemodialysis patients starting renal<br />
replacement therapy in a calendar year, surviving beyond<br />
day 90, and not receiving a transplant by day 91; patients are<br />
censored at transplant or the end <strong>of</strong> follow-up<br />
4 peritoneal dialysis only: all peritoneal dialysis patients starting<br />
renal replacement therapy in a calendar year, surviving<br />
beyond day 90, and not receiving a transplant by day 91;<br />
patients are censored at transplant or the end <strong>of</strong> follow-up<br />
4 transplant: patients with a functioning transplant at the start<br />
<strong>of</strong> the period and who have had the transplant for at least<br />
60 days; the period at risk is censored at the end <strong>of</strong> the year<br />
Unadjusted patient survival probabilities are estimated using the<br />
Kaplan-Meier method, while the Cox model and the model-based<br />
adjustment method are used for adjusted probabilities.<br />
To limit imprecision due to small cell sizes, adjusted probabilities<br />
use aggregate categories for age, gender, race, and primary diagnosis.<br />
For each cohort, a probability presented for one variable is adjusted<br />
for the remaining three. Overall probabilities for all patients are<br />
adjusted for each <strong>of</strong> the four variables, as described later in the statistical<br />
methods section. The reference population consists <strong>of</strong> 2005<br />
incident <strong>ESRD</strong> patients.<br />
Transplantation<br />
Chapter Seven; E & F tables<br />
Figure 7.1 presents an overview <strong>of</strong> the transplant population. Panel<br />
1 juxtaposes the growing rate <strong>of</strong> <strong>ESRD</strong> with the falling rate <strong>of</strong> transplantation<br />
in patients age 20 and older at transplant, 1991–2007. Most<br />
adult-only figures are limited to patients age 18 and older, but this<br />
figure is limited to age 20 and older because census population data<br />
are provided in five-year increments. Panel 2 summarizes the wait<br />
list, showing, by prior transplant status, the number <strong>of</strong> patients age<br />
20 and older on the OPTN kidney or kidney-pancreas wait list on<br />
December 31 <strong>of</strong> the year, and the median wait time for a deceased-<br />
donor kidney. Patients with overlapping listings at more than one<br />
center are counted once. Median wait time is plotted only when the<br />
Kaplan-Meier median is observed, and is thus missing for patients<br />
listed more recently. Panel 3 presents transplant counts for patients<br />
20 and older, by donor type, obtained through a combination <strong>of</strong><br />
OPTN and CMS data.<br />
TRANSPLANT WAIT LIST<br />
Figures 7.2–3 show the number and distribution <strong>of</strong> patients on the<br />
OPTN kidney or kidney-pancreas wait list on December 31 <strong>of</strong> the<br />
year. Because patients may list at multiple transplant centers, Figure<br />
7.2 shows the number <strong>of</strong> unique patients on the list and the proportion<br />
<strong>of</strong> patients listed at multiple centers. Similar data are presented<br />
for patients by citizenship status. Distributions by age, gender, and<br />
race, shown in Figure 7.3, are based on first listings only.<br />
Figure 7.4 presents observed and projected median wait times<br />
in patients age 18 or older at the time <strong>of</strong> transplant, by race, blood<br />
type, and panel reactive antibody (PRA). Median wait times are estimated<br />
for each year using the Kaplan-Meier methodology. Years for<br />
which the median is observed are plotted, while for cases in which<br />
a subgroup has fewer than 15 patients the median is not plotted and<br />
is left as unknown. For more recent years in which the median has<br />
not yet been observed — i.e., more than 50 percent <strong>of</strong> the patients<br />
listed in that year have yet to be transplanted — the median time<br />
is estimated using a linear regression model. These projections are<br />
plotted with a dotted line. The regression analysis considers all years<br />
for which the median is observed, excluding cells with fewer than<br />
15 patients, as described above. A regression line is estimated using<br />
the year <strong>of</strong> transplantation as an independent variable. To improve<br />
the fit <strong>of</strong> this line, a quadratic term for the year <strong>of</strong> transplantation is<br />
included in the model. Predicted medians are then estimated from<br />
the resulting regression line.<br />
Figure 7.5 shows median wait times by state for adult patients<br />
receiving a deceased donor kidney during 2007. Wait time is calculated<br />
as the transplant date minus the date the patient is added to<br />
the kidney or kidney-pancreas wait list, not necessarily the date he<br />
or she is first listed at the center where the transplant is performed.<br />
State is the state where the transplant took place, not the state <strong>of</strong><br />
the patient’s primary residence.<br />
Figure 7.6 shows the distribution <strong>of</strong> listed patients by PRA and<br />
number <strong>of</strong> years after listing for adults listed between 1997 and 2002.<br />
The PRA level is the last known PRA value at each post-listing year.<br />
The denominator for each post-listing year includes all patients who<br />
remain listed at that time. A patient who receives a transplant 18<br />
months after listing, for example, will contribute to denominators<br />
at listing and at year 1, but not years 2 through 5.<br />
In 2003, OPTN started the expanded criteria donor (ECD) program,<br />
to allow patients to indicate their willingness to accept a kidney<br />
from a “marginal” donor. Figure 7.7 shows, by OPTN region, the<br />
percent <strong>of</strong> adult patients — new and prevalent listings — willing to<br />
accept an ECD kidney; prevalent listings include all patients on the<br />
list in the 2006–2007 interval regardless <strong>of</strong> when they initially list.<br />
OPTN regions are as follows:<br />
1. Connecticut, Maine, Massachusetts, New Hampshire, Rhode<br />
Island<br />
2. District <strong>of</strong> Columbia, Delaware, Maryland, New Jersey, Pennsylvania,<br />
West Virginia<br />
3. Alabama, Arkansas, Florida, Georgia, Louisiana, Mississippi,<br />
Puerto Rico<br />
4. Oklahoma, Texas<br />
5. Arizona, California, Nevada, New Mexico, Utah
6. Alaska, Hawaii, Idaho, Montana, Oregon, Washington<br />
7. Illinois, Minnesota, North Dakota, South Dakota, Wisconsin<br />
8. Colorado, Iowa, Kansas, Missouri, Nebraska, Wyoming<br />
9. New York, Vermont<br />
10. Indiana, Michigan, Ohio<br />
11. Kentucky, North Carolina, South Carolina, Tennessee,<br />
Virginia<br />
Figure 7.8 illustrates changes over time in the percent <strong>of</strong> listed<br />
patients who receive a living donor transplant within a year <strong>of</strong> listing.<br />
Patients include all first time listings from 1991–2006, including<br />
pediatric patients. Kaplan-Meier methods are used to estimate<br />
proportions, which are reported by age group.<br />
Figure 7.9 shows the adjusted one-year mortality rate, by state,<br />
for patients prevalent as <strong>of</strong> January 1, 2007. A Poisson regression is<br />
used to estimate rates, adjusted for age, gender, race, and time on<br />
the list prior to 2007. Patients are followed for up to one year after<br />
January 1, 2007.<br />
Figure 7.10 shows the likelihood <strong>of</strong> adult patients dying while<br />
awaiting transplant in the first five years after listing, looking at<br />
those first listed between 1991 and 2006. The likelihood <strong>of</strong> dying is<br />
estimated using the Kaplan-Meier method. Patients are censored<br />
at removal from the list and the end <strong>of</strong> the follow-up period. And<br />
Figure 7.11 illustrates outcomes for adult patients first listed in 2002.<br />
Patients are classified at five years post-listing as having received a<br />
transplant, having died awaiting a transplant, having been removed<br />
from the list prior to transplantation, or still waiting.<br />
TRANSPLANTATION & DONATION<br />
Organ donation information is presented in Figures 7.12–15. Figure<br />
7.12 shows rate <strong>of</strong> organ donation per million population by age,<br />
gender, and race. A deceased donor is counted once, regardless <strong>of</strong><br />
how many organs are transplanted. Figure 7.13 shows similar data,<br />
by the state where the donation was made. Figure 7.14 presents living<br />
donor transplant counts by donor relation, with data on living<br />
donor relations obtained from the OPTN. And Figure 7.15 presents<br />
unadjusted donation rates per 1,000 deaths, by state. Population<br />
and death count estimates for the year from July 1, 2006, to July 1<br />
2007, are obtained from the U.S. Census Bureau.<br />
Figure 7.16 shows transplant rates per 100 dialysis patient years,<br />
by state, in 2007. Rates are estimated from a Poisson regression,<br />
adjusting for age, gender, race, and primary cause <strong>of</strong> renal failure,<br />
then standardized to the age, gender, race, and primary cause <strong>of</strong><br />
renal disease makeup <strong>of</strong> the national population <strong>of</strong> dialysis patients<br />
incident in 2007. The state is the recipient’s last known state <strong>of</strong> residence,<br />
not necessarily the state where the transplant was performed.<br />
Figure 7.17 displays Bayesian transplantation ratios by state in<br />
2007. The cohort consists <strong>of</strong> point prevalent dialysis patients alive<br />
on December 31, 2006. Follow-up begins January 1, 2007, and concludes<br />
at the earliest <strong>of</strong> transplantation, death, or December 31, 2007.<br />
Expected transplantations are derived from a Cox proportional hazards<br />
model, with adjustments for age, gender, race, and primary cause<br />
<strong>of</strong> <strong>ESRD</strong>. In the Bayesian model, observed transplantations during a<br />
state-year are assumed to follow a Poisson distribution with mean<br />
mθ, where m is equal to the expected graft failures and log θ is equal<br />
to the sum <strong>of</strong> normally distributed state effect and an independent,<br />
normally distributed state-year effect, both with mean 0 and precision<br />
τ, the prior distribution <strong>of</strong> which is almost non-informative.<br />
State-specific transplant rates may vary because <strong>of</strong> differing<br />
distributions <strong>of</strong> patient characteristics, so it is useful to consider<br />
the ratios <strong>of</strong> observed to expected transplants in each state, after<br />
adjustment for age, gender, race, and primary cause <strong>of</strong> <strong>ESRD</strong>. The<br />
use <strong>of</strong> a Bayesian model to estimate these ratios reduces numerical<br />
instability in states with small populations.<br />
Transplant rates in Figure 7.18, by age, gender, race, and primary<br />
diagnosis, show trends in adult transplants from 1991 through 2007.<br />
Rates presented by one variable are adjusted for the remaining three<br />
using a Poisson regression model. Figure 7.19 presents trends in<br />
transplant rates by donor type, 1991–2007. These unadjusted rates<br />
are calculated as the number <strong>of</strong> each type <strong>of</strong> transplant divided by<br />
the total dialysis patient time during the year.<br />
Figure 7.20 shows the growth in the percentage <strong>of</strong> adult transplants<br />
using kidneys from expanded criteria donors (ECDs) and<br />
non-heart beating donors (DCDs), 1991–2007. Factors defining ECD<br />
status are listed on the OPTN Deceased Donor Registration form,<br />
and patients here include only first-time, kidney-only recipients<br />
<strong>of</strong> a deceased donor kidney. ECDs are age 60 or older, or age 50–59<br />
with two or more <strong>of</strong> the following: death attributed to CVA, history<br />
<strong>of</strong> hypertension, or creatinine greater than 1.5 mg/dl. DCD status<br />
became available from the OPTN in 1993.<br />
Figure 7.21 presents the distribution <strong>of</strong> adult transplant recipients<br />
by the number <strong>of</strong> years <strong>of</strong> prior renal replacement therapy. Time<br />
is the number <strong>of</strong> years from the first <strong>ESRD</strong> service, including prior<br />
time on transplant, for patients receiving a subsequent transplant.<br />
Figure 7.22 highlights changes over time in PRA level at transplant<br />
for all adults transplanted since 1991. Figure 7.23 displays the yearly<br />
distribution <strong>of</strong> all adult transplant recipients by the transplant’s<br />
ordinal number (first, second, third, etc.). Although data are limited<br />
to adult transplant patients, transplants received before age 18 are<br />
counted in the number <strong>of</strong> transplants. Figure 7.24 highlights differences<br />
in insurance coverage among adult recipients <strong>of</strong> deceased<br />
donor and living donor transplants. Insurance coverage data is provided<br />
by the OPTN, and a full year <strong>of</strong> data was not available until 1995.<br />
Figure 7.25 displays the number <strong>of</strong> multi-organ kidney transplants,<br />
by other organ type and year, among adults receiving these<br />
transplants. <strong>Data</strong> are suppressed for counts <strong>of</strong> ten patients or fewer;<br />
kidney-lung transplant data are therefore not plotted. Figure 7.26<br />
reports the number <strong>of</strong> adult kidney transplant recipients who<br />
reported to the OPTN that they had had a prior organ transplant.<br />
Simultaneous kidney-pancreas (SPK) transplants are not counted<br />
among the prior pancreas transplants, unless the current SPK transplant<br />
patient had a prior SPK transplant procedure. Those reporting<br />
prior multiple-organ transplants are counted once per organ;<br />
a patient reporting a prior heart-lung transplant will be counted<br />
once in the heart category and once in the lung category. <strong>Data</strong> are<br />
suppressed for counts <strong>of</strong> ten or fewer. Figure 7.27 reports the percentage<br />
<strong>of</strong> patients with evidence <strong>of</strong> delayed graft function (defined by<br />
a need for dialysis in the first week after transplantation) by donor<br />
type and ECD and DCD status, as reported to the OPTN. Each year’s<br />
cohort includes all adult patients whose grafts were functioning<br />
upon discharge. DCD status was unavailable until 1993, and not<br />
reported prior to that year.<br />
Figure 7.28 presents the distribution <strong>of</strong> estimated glomerular<br />
filtration rate (eGFR) at discharge, by insurance coverage, among<br />
all adult transplant recipients who were transplanted in 2007 and<br />
discharged with graft function within 15 days <strong>of</strong> transplant. GFR is<br />
estimated using the MDRD equation. Figure 7.29 illustrates trends<br />
in discharge eGFR by donor type.<br />
IMMUNOSUPPRESSION<br />
Figures 7.30–35 present data on immunosuppressive medications<br />
used in adult recipients at the time <strong>of</strong> transplantation, since 1995,<br />
Transplantation<br />
4 APPENDIx A: ANAlyTICAl METHODS<br />
<strong>2009</strong> USRDS Annual <strong>Data</strong> Report<br />
Vol 2<br />
esrd<br />
5<br />
App A<br />
pg 373
5<br />
App A<br />
pg 374<br />
as reported on the OPTN Immunosuppression Treatment form. All<br />
such medications (apart from induction antibodies) are indicated as<br />
maintenance immunosuppression on the form. Figure 7.31 highlights<br />
the switch over time from azathioprine to mycophenolate m<strong>of</strong>ietil<br />
or mycophenolate sodium as the common anti-metabolite. Figure<br />
7.32 contrasts the percent <strong>of</strong> patients using mTOR inhibitors — sirolimus<br />
or everolimus — at baseline and one year after transplant.<br />
Figure 7.33 contrasts the percent <strong>of</strong> patients using steroids at baseline<br />
and one year after transplant. Figure 7.34 shows changes in<br />
trends <strong>of</strong> antibody induction use over time, and Figure 7.35 shows<br />
the most common immunosuppression regimes in adult patients<br />
transplanted during 2005–2007.<br />
GRAFT SURVIVAL<br />
Figure 7.36 shows the percentage <strong>of</strong> adult transplants with primary<br />
non-function, defined as kidney failure within seven days <strong>of</strong> transplantation,<br />
while Figure 7.37 illustrates the distribution <strong>of</strong> eGFR one<br />
year after transplant. Figure 7.38 shows five-year graft survival by<br />
eGFR for patients transplanted in 2000–2005, with graft function at<br />
one year post-transplant. Graft survival rates are estimated using<br />
the Kaplan-Meier method.<br />
Figures 7.39–40 present five- and ten-year graft survival, as well as<br />
conditional half-lives, for adult recipients <strong>of</strong> kidneys from deceased<br />
and living donors. All estimates are made from Cox proportional<br />
hazards models, adjusted for transplant year, age, gender, race, and<br />
primary diagnosis, and based on the population’s average survival<br />
curves, rather than on curves <strong>of</strong> the average patient in the population.<br />
Estimates <strong>of</strong> conditional half-lives are conditional on first-year<br />
graft survival, and estimated from the cumulative hazard between<br />
years one and two. Conditional half-lives are interpreted as the estimated<br />
median survival <strong>of</strong> grafts surviving the first year, while halflives<br />
are interpreted as the estimated median survival <strong>of</strong> all grafts.<br />
Figure 7.41 presents one-year post-transplant hospital admission<br />
rates for Medicare patients receiving their first kidney-alone transplant<br />
in 2006. <strong>Data</strong> are collected from Medicare claims occurring<br />
within a year <strong>of</strong> discharge from the transplant hospitalization, and<br />
exclude the transplant hospitalization. Admission rates are censored<br />
at graft failure, loss <strong>of</strong> Medicare coverage, or December 31, 2007.<br />
Statistical methods for computing admission rates are similar to<br />
those described for Reference Section G, but cohorts are constructed<br />
differently. Instead <strong>of</strong> computing rates in point prevalent patients<br />
within a given year, we define the cohort based on transplant year<br />
and examine hospital claims up to a year post-transplant. Figure<br />
7.42 shows the primary cause <strong>of</strong> hospitalization for cardiovascular<br />
problems or infection up to three years post-transplant in Medicare<br />
patients who had their first kidney-alone transplant in 2003–2005.<br />
Figure 7.43 presents the one-year cumulative incidence <strong>of</strong> acute<br />
rejections in adult, first-time, kidney-alone transplant patients discharged<br />
from the transplant hospitalization with a functioning graft.<br />
A patient is assumed to have acute rejection if OPTN data collection<br />
forms note 1) acute rejection episodes, 2) that medications were given<br />
for acute rejection, and that 3) acute rejection was the primary or<br />
secondary cause <strong>of</strong> graft failure. B3iopsy-proven status was available<br />
starting in 1991 on the OPTN Transplant Recipient Registration,<br />
which identifies early rejection, but was not added to the Transplant<br />
Recipient Follow-up form until April, 2003. Rejections that<br />
are a primary or contributing cause <strong>of</strong> graft failure are assumed<br />
to be biopsy-proven, while rejections identified by treatment status<br />
are not assumed to be biopsy-proven. Cumulative incidence is<br />
estimated using Kaplan-Meier methods, censored at death or one<br />
year post-transplant.<br />
Figures 7.44–45 present data on post-transplant diabetes and<br />
post-transplant lymphoproliferative disorder (PTLD). The patient<br />
population includes first-time, kidney-only recipients, 2000–2004,<br />
with Medicare as primary payor. To identify de novo post-transplant<br />
diabetes, patients are further required to have six months<br />
<strong>of</strong> Medicare primary payor coverage prior to transplantation. We<br />
search for claims during this entry period indicating diabetes, and<br />
patients with these claims are omitted. To identify PTLD, we search<br />
Medicare claims for ICD-9-CM diagnosis codes 200.xx, 202.xx, and<br />
204.xx. Only the first three years post-transplant are searched for<br />
each condition, as many transplant recipients lose Medicare coverage<br />
three years post-transplant. For each complication, the figure<br />
shows cumulative incidence over the three-year post-transplant<br />
period; this incidence is estimated from a Cox proportional hazards<br />
model, adjusting for age, gender, race, Hispanic ethnicity, primary<br />
cause <strong>of</strong> renal failure, year <strong>of</strong> transplantation, donor type, hepatitis B<br />
and C serology, education level, employment status, time on dialysis,<br />
donor age, donor gender, donor race, HLA mismatches, recipientdonor<br />
body surface area matching, body mass index, panel reactive<br />
antibodies, cytomegalovirus matching, baseline maintenance<br />
immunosuppression (cyclosporin, neoral, tacrolimus, rapamycin,<br />
azathioprine, mycophenolate m<strong>of</strong>etil), and anti-lymphocyte receptor<br />
antibody use (IL-2, other), and estimated from the population<br />
average curve rather than the curve <strong>of</strong> the average patient. In Figure<br />
7.45, we overlay PTLD data from OPTN sources in the Medicare<br />
population and in all transplant patient.<br />
In Figure 7.46 we present the rate <strong>of</strong> return to dialysis/preemptive<br />
retransplantation, the rate <strong>of</strong> death with a functioning graft,<br />
and the rate <strong>of</strong> any graft failure, which includes failure due to death.<br />
Rates are limited to adult patients, and estimated from a Poisson<br />
regression, adjusting for age, gender, and race.<br />
Figure 7.47 displays causes <strong>of</strong> death for adult patients transplanted<br />
between 2003 and 2007 who subsequently die with a functioning<br />
graft. Causes <strong>of</strong> death are ascertained from OPTN transplant followup<br />
data, or, if unknown, from the <strong>ESRD</strong> Death Notification form.<br />
Figure 7.48 presents data on graft failures in adults that necessitate<br />
long-term dialysis; graft failures due to death and preemptive<br />
retransplantation are excluded from these counts. Subsequent<br />
treatment is determined from a combination <strong>of</strong> Medicare claims<br />
and OPTN data.<br />
Figure 7.49 shows the proportion <strong>of</strong> adult patients who go back<br />
on the wait list or receive a subsequent transplant within a year <strong>of</strong><br />
graft failure, while Figure 7.50 shows the median and 25th percentile<br />
for months to retransplantation, and Figure 7.51 shows modality<br />
immediately following graft failure. The y-axis for Figures 7.49–51 is<br />
the year <strong>of</strong> graft failure. Kaplan-Meier methods are used to compute<br />
rates and time to re-transplantation, with censoring at death with<br />
a functioning kidney. In Figure 7.50, the Kaplan-Meier median is<br />
not observed for patients whose grafts failed after 1999.<br />
REFERENCE SECTION E<br />
Tables E.1–6 present measures regarding the wait list for renal transplantation.<br />
Wait list data prior to 1988 are not shown; the OPTN wait<br />
list began in earnest in 1987. Table E.1 presents counts <strong>of</strong> patients<br />
newly added to the wait list for a kidney or kidney-pancreas transplant<br />
on December 31 <strong>of</strong> the given year. Patients listed at multiple<br />
transplant centers are counted only once. Table E.2 presents wait<br />
times, defined as the median time in days from first listing to transplant<br />
among patients listed for a kidney-alone transplant. Kaplan-<br />
Meier methodology is used to estimate median wait times. Table<br />
E.3 presents counts <strong>of</strong> patients on the wait list on December 31 <strong>of</strong>
the given year, regardless <strong>of</strong> when the first listing occurred. Table<br />
E.4 presents counts for patients that have been certified as having<br />
<strong>ESRD</strong>, and Table E.5 the percentage <strong>of</strong> prevalent dialysis patients<br />
on the kidney wait list. Table E.5 includes point prevalent dialysis<br />
patients on December 31 <strong>of</strong> the given year. Table E.6 presents the<br />
percentage <strong>of</strong> patients wait-listed or receiving a transplant within<br />
one year <strong>of</strong> <strong>ESRD</strong> initiation; patients receiving a transplant from a<br />
living donor are excluded from the measure in the first half <strong>of</strong> the<br />
table and included in the second half. Percentages are calculated<br />
using the Kaplan-Meier methodology. This measure is modeled<br />
after Healthy People 2010 Objective 4.5.<br />
Transplant counts are presented in Tables E.7–10. All known<br />
transplant events are included unless specified in the footnote, and<br />
all counts include non-Medicare patients.<br />
Transplant rates per 100 patient years on dialysis are shown<br />
in Table E.11. All hemodialysis patients, peritoneal dialysis (CAPD/<br />
CCPD) patients, and patients on an unknown form <strong>of</strong> dialysis are<br />
included, as are all non-Medicare patients. A patient’s dialysis days<br />
are counted from the beginning <strong>of</strong> the specified year, or day one <strong>of</strong><br />
<strong>ESRD</strong> dialysis therapy if treatment begins mid-year, until the first <strong>of</strong><br />
transplant, death, or the end <strong>of</strong> the year. Patients lost to follow-up<br />
in a given year are not censored at the lost-to-follow-up date, but<br />
are followed until the end <strong>of</strong> the calendar year. Dialysis time for<br />
patients returning from transplant is counted. Transplant rates are<br />
calculated as the number <strong>of</strong> transplant events divided by the total<br />
number <strong>of</strong> dialysis patient years for each year.<br />
Table E.12 shows the distribution <strong>of</strong> transplanted patients by<br />
donor type and PRA level, determined from the OPTN Recipient<br />
Histocompatibility form. Table E.13 presents a cross-tabulation <strong>of</strong><br />
recipients and donors in terms <strong>of</strong> CMV antibody status at the time<br />
<strong>of</strong> transplantation. A recipient/donor is considered positive if any<br />
applicable OPTN data source indicates positive, and “unknown” status<br />
is applied only in the event that no applicable test is performed.<br />
Table E.14 presents similar data for Hepatitis C antibody status.<br />
Table E.15 presents transplant counts based on cold ischemia times<br />
(hours) among deceased donor transplants. Cold ischemia times<br />
are taken from the OPTN Transplant Recipient Registration form.<br />
REFERENCE SECTION F<br />
This section presents probabilities <strong>of</strong> graft survival and graft failure<br />
necessitating dialysis or retransplantation, by donor type, for<br />
various groups and follow-up times. In previous <strong>ADR</strong>s, “graft failure<br />
necessitating dialysis or retransplantation” was referred to as<br />
“death-censored graft failure.” Due to some confusion regarding<br />
terminology, we have decided to rename this outcome. This section<br />
now seeks to address two major issues: the probability <strong>of</strong> graft<br />
survival at various times post-transplant, and the probability that<br />
a patient will return to dialysis or require retransplantation at various<br />
times post-transplant. Patients are followed from the transplant<br />
date to graft failure, death, or the end <strong>of</strong> the follow-up period<br />
(December 31, 2007). In the analysis <strong>of</strong> graft survival, death is considered<br />
a graft failure. In the analysis <strong>of</strong> graft failure necessitating<br />
dialysis or retransplantation, patients are followed until graft failure<br />
(excluding death), and patient follow-up is censored at death.<br />
To produce a standard patient cohort, patients with unknown age<br />
or gender are omitted. Unknown age is defined as a missing age at<br />
transplant, or an age calculated to be less than zero or greater than<br />
or equal to 100. Patients are also excluded if their first <strong>ESRD</strong> service<br />
date is prior to 1977.<br />
Unadjusted survival probabilities are estimated using the<br />
Kaplan-Meier methodology, while the Cox proportional hazards<br />
model is used for adjusted probabilities. Probabilities are adjusted<br />
for age, gender, race, primary diagnosis, and first versus subsequent<br />
transplant, and standardized to 2005 patient characteristics.<br />
Tables F.25–26 present the relative risk <strong>of</strong> graft failure, return to<br />
dialysis (including preemptive retransplantation), and death with<br />
a functioning graft for first-time recipients <strong>of</strong> deceased donor and<br />
living donor kidneys, respectively. Relative risks are estimated from<br />
Cox proportional hazards models, one for each donor type cohort<br />
and outcome. Patients transplanted between 2002 and 2007 are<br />
included. Follow-up is censored at December 31, 2007, for a maximum<br />
follow-up <strong>of</strong> six years. For the graft failure outcome, death is<br />
considered a graft failure; for return to dialysis, patients are censored<br />
at death with a functioning graft; and for death with function,<br />
follow-up is censored at return to dialysis.<br />
Pediatric <strong>ESRD</strong><br />
Chapter Eight<br />
Information on pediatric patients is a subset <strong>of</strong> <strong>ESRD</strong> patient data<br />
used throughout the <strong>ADR</strong>; methods used for most figures are therefore<br />
the same as those described in the related chapter discussions.<br />
Figure 8.1 includes 2007 pediatric hemodialysis patients with at<br />
least one EPO claim including valid height and weight values. The<br />
first valid EPO claim after either dialysis initiation (for incident<br />
patients) or January 1 (for prevalent patients) is used. Heights and<br />
weights are standardized for age and gender using a method developed<br />
by the CDC and based on their 2000 growth charts.<br />
Rates in Figures 8.3–6 are adjusted for age, gender, and race.<br />
ANEMIA TREATMENT<br />
For Figure 8.10, the mean hemoglobin and mean weekly EPO dose<br />
are calculated on a quarterly basis, and each quarter includes<br />
only patients with at least one valid EPO claim during that time.<br />
Doses are adjusted for inpatient days. Figure 8.11 includes prevalent<br />
hemodialysis and peritoneal dialysis patients who are alive<br />
and remain on the modality for the entire prevalent year. Patients<br />
are identified as receiving iron if they have at least one claim for<br />
it during the year.<br />
PREVENTIVE CARE<br />
Figures 8.12–14 show rates <strong>of</strong> preventive healthcare in pediatric <strong>ESRD</strong><br />
patients by modality and race. Methods and codes used to determine<br />
vaccination rates are similar to those described for Chapter<br />
Five. All patients are age 0–19 at the beginning <strong>of</strong> each study period;<br />
reside in the 50 states, the District <strong>of</strong> Columbia, Puerto Rico, or the<br />
Territories; and have Medicare inpatient/outpatient and physician/<br />
supplier coverage for the entire period.<br />
For influenza vaccinations (Figure 8.12), the cohort includes<br />
patients starting <strong>ESRD</strong> therapy at least 90 days prior to September<br />
1 and alive on December 31 <strong>of</strong> each year; rates are calculated for<br />
patients vaccinated in the last four months <strong>of</strong> each year. For pneumococcal<br />
pneumonia vaccinations (Figure 8.13), the cohort includes<br />
prevalent patients initiating therapy at least 90 days prior to January<br />
1 <strong>of</strong> the first year <strong>of</strong> each two-year period and alive on December<br />
31 <strong>of</strong> the second year; rates are calculated for patients receiving<br />
one vaccination in each period. And for hepatitis B vaccinations<br />
(Figure 8.14), cohorts include prevalent patients initiating therapy<br />
90 days prior to January 1 and alive on December 31 <strong>of</strong> each year;<br />
rates are calculated for patients receiving one vaccination or test<br />
each year. Years 2000–2003 and 2004–2007 are grouped in Figures<br />
8.12 and 8.14, and 2000–2001 and 2002–2003, and 2004–2005 and<br />
2006–2007, are grouped in Figure 8.13.<br />
Pediatric <strong>ESRD</strong><br />
4 APPENDIx A: ANAlyTICAl METHODS<br />
<strong>2009</strong> USRDS Annual <strong>Data</strong> Report<br />
Vol 2<br />
esrd<br />
5<br />
App A<br />
pg 375
5<br />
App A<br />
pg 376<br />
VASCULAR ACCESS<br />
Figure 8.15 includes incident hemodialysis patients from the 2001–<br />
2006 <strong>ESRD</strong> CPM data. Year represents the incident year, and access<br />
is that reported as used at the time <strong>of</strong> data collection during that<br />
year. Figures 8.16–17 include incident hemodialysis patients in both<br />
the USRDS and <strong>ESRD</strong> CPM datasets. Patients are age 0–19 at dialysis<br />
initiation, and have Medicare as primary payor on January 1 <strong>of</strong> the<br />
following year. CPM data are used to determine the access used at<br />
the time <strong>of</strong> data collection in the incident year. For 8.16, primary<br />
cause <strong>of</strong> renal failure is determined from USRDS registry information.<br />
In 8.17, patients are followed from January 1 <strong>of</strong> the year following<br />
incidence, and Medicare claims are used to identify access<br />
infections and sepsis. Included events occur between January 1 and<br />
the censoring date, which is the earliest <strong>of</strong> death, modality change,<br />
change in payor status, placement <strong>of</strong> a different vascular access, or<br />
December 31, and time at risk is calculated as the number <strong>of</strong> days<br />
between January 1 and the censoring date. Figure 8.26 also includes<br />
incident peritoneal dialysis patients from the USRDS database who<br />
are age 0–19 and have Medicare as primary payor on day 91 after<br />
incidence. Medicare claims during the one-year period after day 91<br />
are used to identify the first occurrence <strong>of</strong> either sepsis or an infection<br />
<strong>of</strong> the peritoneal dialysis catheter, censored at death, modality<br />
change, change in payor status, or placement <strong>of</strong> a hemodialysis<br />
access. For Figure 8.26, the event-free probability represents the<br />
survival probability from an unadjusted Kaplan-Meier curve, using<br />
patients from 2000–2005 combined.<br />
HOSPITALIZATION & SURVIVAL<br />
Figures 8.18–21 present adjusted admission rates in the first year <strong>of</strong><br />
dialysis among incident dialysis patients age 0–19. Included patients<br />
have Medicare as primary payor and are residents <strong>of</strong> the 50 states,<br />
the District <strong>of</strong> Columbia, Puerto Rico, and the Territories. Patients<br />
with AIDS as a primary or secondary cause <strong>of</strong> death, and those with<br />
missing age or gender information, are excluded. Since in-center<br />
hemodialysis patients who are younger than 65 and not disabled<br />
cannot bill for hospitalizations until 90 days after <strong>ESRD</strong> initiation,<br />
the 90-day rule is applied. Patients are required to survive the first<br />
90 days after dialysis initiation, and are followed for admissions for<br />
up to one year after day 90. <strong>Data</strong> cleaning and counting <strong>of</strong> admissions<br />
and time at risk for admissions generally follow that described<br />
for Reference Section G; here, however, incident patients are followed<br />
during intervals following day 90 rather than during prevalent<br />
years. Censoring occurs at death, loss to follow-up, three days<br />
prior to transplant, end <strong>of</strong> payor status, December 31, 2007, or after<br />
one year. Rates are adjusted for gender, race, and primary diagnosis,<br />
and are calculated with a model-based adjustment method and<br />
an interval Poisson model. The reference cohort includes incident<br />
dialysis patients, age 0–19, in 2005. Principal ICD-9-CM diagnosis<br />
codes used for cardiovascular and infectious hospitalizations are<br />
listed in the discussion <strong>of</strong> Figure 6.2.<br />
Figure 8.22–25 present adjusted all-cause and cause-specific<br />
mortality in the first months <strong>of</strong> dialysis, by age, for incident dialysis<br />
patients younger than 20. Patients are followed from the day <strong>of</strong><br />
<strong>ESRD</strong> onset until December 31, 2007, and censored at loss to followup<br />
or transplantation. Rates are adjusted for gender, race, and primary<br />
diagnosis <strong>of</strong> <strong>ESRD</strong>. Incident dialysis patients younger than 20,<br />
2004–2005, are used as the reference cohort.<br />
Figure 8.26 presents five-year survival by modality for 1993–1997<br />
and 1998–2002 incident patients, age 0–19. Patients with unknown<br />
age, gender, or primary diagnosis are excluded, as are dialysis<br />
patients who die or receive a transplant in the first 90 days. Dialy-<br />
sis patients are followed from day 91 until death, transplant, or the<br />
end <strong>of</strong> 2007; transplant patients are followed from the first transplant<br />
date until death or the end <strong>of</strong> 2007. All probabilities are adjusted<br />
for age, gender, and race; overall probabilities are also adjusted for<br />
primary diagnosis. The reference population consists <strong>of</strong> 2004–2005<br />
incident pediatric <strong>ESRD</strong> patients, and adjusted probabilities can be<br />
compared across modalities.<br />
Special Studies<br />
Chapter Nine<br />
CARDIOVASCULAR SPECIAL STUDIES<br />
Table 9.a displays the relative risk <strong>of</strong> a cardiovascular diagnosis or<br />
procedure, by age, gender, race, and ethnicity. The cohort includes<br />
point prevalent <strong>ESRD</strong> patients on January 1, 2005, age 20 and older,<br />
with Medicare as primary payor; dialysis patients are those receiving<br />
hemodialysis or peritoneal dialysis at 90 days after <strong>ESRD</strong> initiation.<br />
Patients are followed from January 1, 2005, to the earliest <strong>of</strong><br />
event, death, modality change, loss to follow-up, end <strong>of</strong> Medicare<br />
as primary payor status, recovery <strong>of</strong> renal function, or December<br />
31, 2007. Patients with an event or procedure in 2004 are excluded.<br />
The Cox model is used to estimate the relative risk, adjusted for<br />
age, gender, race, ethnicity, modality, and comorbidities, including<br />
atherosclerotic heart disease (ASHD), other cardiac disease, congestive<br />
heart failure (CHF), CVA/TIA, peripheral vascular disease (PVD),<br />
chronic obstructive pulmonary disease, gastrointestinal (GI) disease,<br />
liver disease, dysrhythmia, cancer, and diabetes, each defined in<br />
the entry year 2004.<br />
Cardiovascular events include CHF, CVA/TIA, peripheral arterial<br />
disease (PAD), cardiac arrest, and AMI, while treatments cover percutaneous<br />
coronary interventions (PCI), coronary artery bypass graft<br />
(CABG) surgery, and implantable cardioverter defibrillators (ICDs)<br />
and cardiac resynchronization therapy with defibrillator (CRT-D).<br />
Figure 9.2 demonstrates first event or procedure rates per 1,000<br />
patient years, by modality, using the same cohort as in Table 9.a.<br />
Figures 9.3–10 show geographic variations in cardiovascular<br />
event and procedure rates. The cohort, which includes point prevalent<br />
hemodialysis, peritoneal dialysis, and transplant patients on<br />
January 1, 2007, is constructed similarly to that in Table 9.a, but<br />
restricted to those residing in the 50 states and the District <strong>of</strong> Columbia.<br />
Rates are for incident events or first procedures per 1,000 patient<br />
years in 2007. Similar methods are used to identify point prevalent<br />
hemodialysis, peritoneal dialysis, and transplant patients on January<br />
1, 1997, to evaluate event and procedure rates in 1997. The figure on<br />
ICD/CRT-D use includes a point prevalent cohort on January 1, 2003.<br />
Figure 9.11 illustrates, by modality, the survival <strong>of</strong> patients with<br />
cardiovascular events and procedures. The cohort is that described<br />
for Table 9.a with a first cardiovascular event or procedure in 2005–<br />
2007 (index date); patients are followed from the index date until<br />
the earliest <strong>of</strong> death, modality change, loss to follow-up, end <strong>of</strong><br />
Medicare as primary payor status, recovery <strong>of</strong> renal function, one<br />
year after the index date, or December 31, 2007. Survival probabilities<br />
are adjusted for age, gender, race, and diabetic status. The point<br />
prevalent cohort on January 1, 2005, including hemodialysis, peritoneal<br />
dialysis, and transplant patients age 20 and older, is used as<br />
the reference.<br />
Figure 9.12 shows physician care, by specialty, during and after<br />
hospitalization <strong>of</strong> dialysis patients with cardiovascular events and<br />
procedures. The cohort includes the hemodialysis and peritoneal<br />
dialysis patients described for Figure 9.11, with a first claim for the<br />
cardiovascular event or procedure obtained from inpatient claims<br />
in the three-year follow-up, and who are discharged alive. The time
period for evaluating care after hospitalization begins on the day<br />
after discharge and ends on the earliest <strong>of</strong> death, modality change,<br />
loss to follow-up, end <strong>of</strong> Medicare as primary payor status, recovery<br />
<strong>of</strong> renal function, 90 days after discharge, or December 31, 2007. For<br />
PCI and ICD/CRT-D, procedures identified from outpatient or physician/supplier<br />
claims are also included. The physician specialty is<br />
identified from claims. For CHF, AMI, PCI, ICD/CRT-D, and surgical<br />
revascularization, primary care includes general practice (1)<br />
and family practice (8); internal medicine (11), cardiology (06), and<br />
nephrology (39) are also considered. In addition, we include neurology<br />
(13) for CVA/TIA and cardiac arrest, and radiology (94) and<br />
vascular surgery (77) for PAD.<br />
Figure 9.13 presents per person per month (PPPM) costs, by<br />
modality, related to cardiovascular events and procedures for the<br />
same study population described for Figure 9.11. The time period<br />
for calculating costs begins on the date <strong>of</strong> the first cardiovascular<br />
event or procedure, and ends at the earliest <strong>of</strong> modality change, loss<br />
to follow-up, end <strong>of</strong> Medicare as primary payor status, recovery <strong>of</strong><br />
renal function, one year after the index date, or December 31, 2007.<br />
The Medicare payment is calculated as the total cost divided by<br />
the total follow-up time (in months). The inpatient cost is defined<br />
as the cost in inpatient/outpatient and physician/supplier claims<br />
during the hospitalization period. Outpatient costs are calculated<br />
from both outpatient and physician/supplier claims.<br />
To identify comorbidity we use the ME form and its listed primary<br />
cause <strong>of</strong> <strong>ESRD</strong>, along with Medicare claims during the entry<br />
period. According to a previously validated methodology for using<br />
Medicare claims to identify diabetic patients, a patient is diabetic<br />
if, within a one-year observation period, he or she has an ICD-9-CM<br />
diagnosis code <strong>of</strong> diabetes on one or more Part A institutional claims<br />
(inpatient hospitalization, skilled nursing facility, or home health<br />
agency), or two or more Part A institutional claims (outpatient)<br />
or Part B physician/supplier claims. With this methodology, we<br />
identify patients with comorbid conditions, using the following<br />
ICD-9-CM diagnosis codes:<br />
4 AMI, 410 and 412<br />
4 CHF, 398.91, 422, 425, 428, 402.x1, 404.x1, 404.x3, and V42.1<br />
4 CVA/TIA, 430–438<br />
4 PVD, 440–444, 447, 451–453, and 557<br />
4 diabetes, 250, 357.2, 362.0x, and 366.41<br />
4 cardiac arrest, 427.4 and 427.5<br />
4 ASHD, 410–414, V45.81, and V45.82<br />
4 other cardiac, 420–421, 423–424, 429, 785.0–785.3, V42.2, and<br />
V43.3<br />
4 COPD, 491–494, 496, and 510<br />
4 GI, 456.0–456.2, 530.7, 531–534, 569.84, 569.85, and 578<br />
4 liver disease, 570, 571, 572.1, 572.4, 573.1–573.3, V42.7<br />
4 dysrhythmia, 426–427, V45.0, and V53.3<br />
4 cancer, 140–172, 174–208, 230–231, 233–234.<br />
PVD is also defined from Medicare claims for amputation, which<br />
is identified through ICD-9-CM procedure codes in inpatient/outpatient<br />
claims and/or Current Procedural Terminology (CPT) codes in<br />
physician/supplier claims: 84.0x, excluding 84.01–84.02, and 84.1x,<br />
excluding 84.11 (ICD-9-CM procedure codes); 23900, 23920, 24900,<br />
24920, 25900, 25905, 25920, 25927, 27295, 27590, 27591, 27592, 27598,<br />
27880, 27881, 27882, 27888, 27889, 28800, and 28805 (CPT codes).<br />
PAD is defined using the same diagnosis codes as PVD (excluding<br />
451–453), and/or CPT codes in physician/supplier claims: 84.0, 84.1,<br />
84.91, 39.25, 39.26, and 39.29 (ICD-9-CM procedure codes); 24900,<br />
24920, 25900, 25905, 25920, 25927, 27295, 27590, 27591, 27592, 27598,<br />
27880, 27881, 27882, 27888, 27889, 28800, 28805, 34900, 35131, 35132,<br />
35141, 35142, 35151, 35152, 34051, 34151, 34201, 34203, 34800–34834,<br />
35081–35103, 35331, 35341, 35351, 35355, 35361, 35363, 35371, 35372, 35381,<br />
35450, 35452, 35454, 35456, 35459, 35470, 35471, 35472, 35473, 35474,<br />
35480, 35481, 35482,35483, 35485, 35490, 35491, 35492, 35493, 35495,<br />
35521, 35531, 35533, 35541, 35546, 35548, 35549, 35551, 35556, 35558, 35563,<br />
35565, 35566, 35571, 35583, 35585, 35587, 35621, 35623, 35646, 35647, 35651,<br />
35654, 35656, 35661, 35663, 35665, 35666, and 35671 (CPT codes).<br />
Different sources <strong>of</strong> information are used to identify cardiovascular<br />
events and procedures. AMI, CHF, CVA/TIA, cardiac arrest,<br />
and PVD are identified from both non-fatal and fatal events. The<br />
event date for a non-fatal event is defined as the date <strong>of</strong> the first<br />
appearance <strong>of</strong> an ICD-9-CM diagnosis code in one or more inpatient<br />
claims only (for AMI and cardiac arrest), or in one or more inpatient,<br />
skilled nursing facility, or home health agency claims or two<br />
or more outpatient and/or physician/supplier claims (for CHF, CVA/<br />
TIA, and PVD). PVD is also identified through ICD-9-CM procedure<br />
codes for amputation in inpatient/outpatient claims and CPT codes<br />
for amputation in physician/supplier claims.<br />
For fatal events, the date <strong>of</strong> death due to the event is obtained<br />
from the Death Notification form. The codes <strong>of</strong> cause-specific<br />
death are: AMI, 23; CHF, 27, 31, and 32; cardiac arrest, 28 and 29;<br />
CVA/TIA, 36; and PVD, 51. For coronary revascularization, the date<br />
is defined through ICD-9-CM procedure codes in inpatient/outpatient<br />
claims and/or CPT codes in physician/supplier claims. For<br />
PVD, PAD, cardiac arrest, and coronary revascularization, we use<br />
the same diagnosis and/or procedure codes used in determining<br />
comorbid conditions; for CHF, we employ the same diagnosis codes<br />
used to determine CHF comorbid conditions, with the exception<br />
<strong>of</strong> V42.1 and 422. For AMI, cardiac arrest, and CVA/TIA, we use the<br />
following: AMI, 410, 410.X0, and 410.X1; cardiac arrest, 427.4 and<br />
427.5; and CVA/TIA, 430.x–437.x. ICD and CRT-D are defined through<br />
ICD-9-CM procedure codes in inpatient/outpatient claims. And<br />
PCI and CABG surgery are defined through ICD-9-CM procedure<br />
codes in inpatient/outpatient claims and/or CPT codes in physician/supplier<br />
claims. Codes used to identify patients receiving<br />
these tests and treatments are as follows:<br />
4 PCI: 00.66, 36.01, 36.02, 36.05, and 36.06 (ICD-9-CM procedure<br />
codes); 92980–92982, 92984, and 92995–92996 (CPT codes)<br />
4 CABG surgery: 36.1x (ICD-9-CM procedure codes); 33510–33523<br />
and 33533–33536 (CPT codes)<br />
4 ICD: 37.94 (ICD-9-CM procedure code)<br />
4 CRT-D: 00.51 (ICD-9-CM procedure code)<br />
EMPLOYMENT AMONG INCIDENT DIALYSIS PATIENTS:<br />
DATA FROM THE COMPREHENSIVE DIALYSIS STUDY<br />
The Comprehensive Dialysis Study (CDS) includes 1,645 incident<br />
dialysis patients. (One CDS participant counted in the 2008 <strong>ADR</strong><br />
was subsequently found not eligible.)<br />
In the data summarized in this spread, age is defined as <strong>of</strong> the<br />
date <strong>of</strong> the patient’s baseline interview.<br />
Educational status is obtained from question 9 <strong>of</strong> the CDS Patient<br />
Questionnaire. The first four response categories (0–6 years completed,<br />
7–9 years completed, some high school completed, high<br />
school diploma or GED completed) are collapsed to form the category<br />
<strong>of</strong> high school or less. The last three response categories (vocational<br />
school or some college completed, college degree completed, pr<strong>of</strong>essional<br />
or graduate degree completed) are collapsed to form the<br />
category <strong>of</strong> college. Educational status information is missing for<br />
six patients. Of those remaining, the distribution is 55.5 percent<br />
high school or less and 44.5 percent college.<br />
Special Studies<br />
4 APPENDIx A: ANAlyTICAl METHODS<br />
<strong>2009</strong> USRDS Annual <strong>Data</strong> Report<br />
Vol 2<br />
esrd<br />
5<br />
App A<br />
pg 377
5<br />
App A<br />
pg 378<br />
The number <strong>of</strong> cardiovascular conditions (congestive heart failure,<br />
atherosclerotic heart disease, other cardiac disease, cerebrovascular<br />
disease, peripheral vascular disease), along with data on<br />
diabetes as primary cause <strong>of</strong> renal failure, COPD, and hemoglobin<br />
and serum albumin values, are obtained from the ME form.<br />
Employment status is obtained from question 73 <strong>of</strong> the Patient<br />
Questionnaire: “Are you now working for pay (receiving taxable<br />
wages)? If yes, full-time or part-time?”<br />
Information on the kind <strong>of</strong> work employed patients were doing<br />
is obtained from question 74 <strong>of</strong> the Patient Questionnaire: “If yes<br />
(now working for pay), what kind <strong>of</strong> work are you doing now?” Jobs<br />
were classified into occupational status categories 1 (high) to 7 (low)<br />
using the Hollingshead occupational status scale.<br />
<strong>Data</strong> on patient-reported ability to work is obtained from question<br />
72 <strong>of</strong> the Patient Questionnaire: “Are you now able to work<br />
for pay?”<br />
<strong>Data</strong> on receipt <strong>of</strong> disability income is obtained from question 75<br />
<strong>of</strong> the Patient Questionnaire: “Are you receiving disability benefits<br />
(SSDI, SSI) from Social Security?”<br />
The Adjusted Activity Score is obtained from responses to the<br />
94-item Human Activity Pr<strong>of</strong>ile, reproduced for use in the CDS with<br />
permission <strong>of</strong> the author. The Adjusted Activity Score is defined as a<br />
measure <strong>of</strong> usual daily activities, and is interpreted as providing the<br />
best estimate <strong>of</strong> an individual’s average level <strong>of</strong> energy expenditure.<br />
PHYSICAL ACTIVITY & LABORATORY MARKERS OF<br />
NUTRITION & INFLAMMATION AMONG CDS PARTICIPANTS<br />
Participants in the CDS were asked about physical activity using the<br />
94-item Human Activity Pr<strong>of</strong>ile (HAP), which has been previously<br />
shown to correlate with physical activity measured by accelerometry<br />
and with physical performance among patients with end-stage renal<br />
disease (Johansen et al.). The HAP provides a survey <strong>of</strong> activities<br />
across a broad range <strong>of</strong> energy requirements. The activity items are<br />
ranked based on estimated metabolic equivalents, i.e., the approximate<br />
amount <strong>of</strong> oxygen consumed by an average person at rest, with<br />
item 1 being the activity requiring the least energy expenditure and<br />
item 94 requiring the greatest energy expenditure. For each item, the<br />
respondent indicates whether he or she is still doing, has stopped<br />
doing, or never did the activity. The Maximum Activity Score (MAS)<br />
is the highest oxygen-demanding activity that the respondent still<br />
performs. The Adjusted Activity Score (AAS) is determined by subtracting<br />
from the MAS the total number <strong>of</strong> activities the respondent<br />
has stopped doing that have numbers lower than the MAS. The AAS<br />
is interpreted as a measure <strong>of</strong> usual physical activity level.<br />
Other variables are obtained from the CDS or from the ME form<br />
(2728). Vascular access type was ascertained directly from CDS participants.<br />
The Medical Outcomes Study Short Form 12-item survey<br />
(SF-12) was administered in its entirety as part <strong>of</strong> the CDS Patient<br />
Questionnaire. Self-reported physical functioning was assessed<br />
using the Physical Component Summary (PCS) score <strong>of</strong> the SF-12.<br />
Under the direction <strong>of</strong> the Nutrition Special Studies Center,<br />
serum specimens were obtained in conjunction with routine<br />
monthly laboratory studies for the subset <strong>of</strong> CDS participants<br />
chosen to participate in the Nutrition substudy. One 15 ml tube<br />
<strong>of</strong> blood was drawn for serum isolation and then shipped on dry<br />
ice via overnight delivery to the laboratory in Davis, California.<br />
Serum was separated upon receipt and aliquoted for analysis and<br />
for storage in a repository. One aliquot was analyzed for C-reactive<br />
protein (CRP), prealbumin, albumin, and alpha 1 acid glycoprotein<br />
(AAG) by rate nephelometry using a Beckmann Array nephelometer.<br />
All nephelometric measures were made in duplicate in<br />
each <strong>of</strong> two optical systems. The average <strong>of</strong> these values is used<br />
for calculations.<br />
Physical activity level is compared between or among groups<br />
using Mann-Whitney U tests for two groups or Kruskal Wallis<br />
one-way analysis <strong>of</strong> variance for three or more groups. Differences<br />
reported in the text are based on a two-sided p-value <strong>of</strong> less than 0.05.<br />
Providers<br />
Chapter Ten; J tables<br />
The USRDS continues to use its new definition <strong>of</strong> a dialysis chain.<br />
Throughout the atlas and in Reference Section J, we now define a<br />
chain-affiliated unit as one <strong>of</strong> a group <strong>of</strong> 20 or more freestanding<br />
dialysis units which are owned or operated by a corporation at the<br />
end <strong>of</strong> a year. The affiliation category <strong>of</strong> “small dialysis organization,”<br />
or SDO, includes all organizations meeting our definition <strong>of</strong><br />
a chain but having 20 or more but fewer than 100 units.<br />
In previous years, chain affiliation was determined from the<br />
“Provider Name” field <strong>of</strong> the CMS Annual Facility Survey, the “Chain<br />
Name” field <strong>of</strong> the CMS Dialysis Facility Compare database, and the<br />
“Chain Organization Name” field <strong>of</strong> the CMS Independent <strong>Renal</strong><br />
Facility Cost Report. Currently, however, it is determined solely<br />
from the “Provider Name” field <strong>of</strong> the Facility Survey.<br />
<strong>Data</strong> are obtained from the Facility Survey (for 1988–2007), the<br />
Cost Report (Form 265-94, for 1994–2000), the CMS Dialysis Facility<br />
Compare (DFC) database (for 2001–2007), and the CDC National<br />
Surveillance <strong>of</strong> Dialysis-Associated Diseases in the <strong>United</strong> <strong>States</strong><br />
(for 1988–2002, excluding 1998, when the CDC did not conduct a<br />
survey). The CDC discontinued the National Surveillance <strong>of</strong> Dialysis-<br />
Associated Diseases after 2002. In 2007, there were 5,240 facilities<br />
in the Facility Survey.<br />
A facility’s hospital-based or freestanding status is determined<br />
from the third and fourth digits <strong>of</strong> the provider number assigned<br />
to each dialysis unit by CMS. For years prior to 2002, we determine<br />
facility pr<strong>of</strong>it status through the ownership type field on the<br />
CMS survey. In the 2002 CMS survey the pr<strong>of</strong>it status variable was<br />
dropped, so for that and subsequent years we use the pr<strong>of</strong>it status<br />
field <strong>of</strong> the DFC. There are, however, a small number <strong>of</strong> facilities<br />
in the CMS survey that are not in the DFC database; these facilities<br />
have an unknown pr<strong>of</strong>it status, and are omitted from any graph<br />
showing pr<strong>of</strong>it status.<br />
For provider-specific analyses, unless otherwise specified, the<br />
dialysis provider for individual patients is assigned as follows: for<br />
prevalent studies, the patient is assigned to the facility providing<br />
dialysis services at the prevalent date, as determined from the treatment<br />
history. For incident analyses, the patient is assigned to the<br />
facility providing dialysis services at the incident date, as determined<br />
from the treatment history. In either case, if provider data<br />
are unavailable from the patient’s treatment history, the patient is<br />
assigned to “unknown provider” or excluded, depending on the<br />
analysis.<br />
ANEMIA TREATMENT & VASCULAR ACCESS<br />
Figure 10.5 includes period prevalent dialysis patients in 2002 and<br />
2007. <strong>Data</strong> for mean hemoglobin include only patients with valid<br />
EPO claims. A mean is calculated for each patient from all valid<br />
claims during the year. Chain affiliation is defined at the final patient<br />
claim <strong>of</strong> the year.<br />
Figure 10.6 illustrates the prevalence <strong>of</strong> IV iron administration,<br />
by dialysis unit affiliation and product type. The cohort consists <strong>of</strong><br />
patients initiating <strong>ESRD</strong> therapy at least 90 days prior to the start<br />
<strong>of</strong> 2007, and receiving dialysis on December 31, 2006. All patients
survive, continue dialysis, and carry Medicare as primary payor<br />
during all <strong>of</strong> 2007. Iron use is indicated by inpatient/outpatient<br />
claims with HCPCS codes J1750, J1755–J1756, J1760, J1770, J1780, and<br />
J2915–J2916. For iron use, chain affiliation is defined at the beginning<br />
<strong>of</strong> follow-up.<br />
Figure 10.9 includes point prevalent dialysis patients in 2002 and<br />
2007, with a first service date 90 days prior to January 1 <strong>of</strong> each year<br />
and alive through the end <strong>of</strong> the year. Rates represent patients with<br />
one or more transfusions within the year. In the case <strong>of</strong> an overlap<br />
in transfusion dates, only one event is used. If both inpatient and<br />
outpatient claims indicate a transfusion event and have the same<br />
“from” date, the inpatient claim is used; if inpatient and outpatient<br />
claims partially overlap, the claim with the earliest date is used;<br />
and if one or more short-period claims indicating a transfusion<br />
are within a long-period claim indicating a transfusion, the long<br />
period claim is used.<br />
PREVENTIVE CARE<br />
Figures 10.10–15 include incident hemodialysis patients in 2002<br />
and 2007, and show the cumulative probability <strong>of</strong> testing in the<br />
first six months <strong>of</strong> dialysis, by unit affiliation. Tests are identified<br />
from outpatient and physician/supplier claims during the<br />
year, using the following HCPCS codes: calcium/phosphorus, 82310,<br />
80048, 80050, 80053, 80069, and 84100; parathyroid hormone,<br />
83970; ferritin, 82728; iron saturation, 83550, 83540, and 84466;<br />
complete blood cell (CBC), 85025, 85027, 80050, and 80055; and<br />
prothrombin time, 85610.<br />
Figures 10.16–18 use the same cohort as Figure 5.10, here for<br />
periods 2006–2007; Figure 10.19 uses the cohort from Figure 5.14,<br />
here for 2004 and 2007; Figure 10.20 uses the 2002–2003 and<br />
2006–2007 cohorts from Figure 5.15; and Figure 10.21 uses the<br />
cohort from Figure 5.16, here for 2004 and 2007. All are limited<br />
to dialysis patients.<br />
COSTS FOR INTERVENTION & PREVENTIVE CARE<br />
Figures 10.22–24 use the Model 1 (as-treated actuarial model) methods<br />
described for Chapter Eleven. Costs for clinical services (Figures<br />
10.22–23) are taken from outpatient facility claims for period<br />
prevalent dialysis patients, and expressed as per person per month<br />
costs. Costs for preventive care (Figure 10.24) are obtained from the<br />
outpatient facility claims as well as physician/supplier claims, and<br />
are identified using CPT codes: A1c testing, 83036 and 83037; lipid<br />
testing, 80061, 82465, 83715–83721, and 84478; diabetic eye examinations,<br />
67101, 67105, 67107, 67108, 67110, 67112, 67141, 67145, 67208,<br />
67210, 67218, 67227, 67228, 92002, 92004, 92012, 92014, 92018, 92019,<br />
92225, 92226, 92230, 92235, 92240, 92250, and 92260; influenza vaccinations,<br />
90645, 90646, 90647, 90648, 90565, 90656, 90657, 90658,<br />
90659, 90660, 90724, 90737, and G0008; and pneumonia vaccination,<br />
90669, 90732, J6065, and G0009. Comprehensive diabetic<br />
monitoring includes at least four A1c tests, at least two lipid tests,<br />
and at least one diabetic eye examination per year.<br />
HOSPITALIZATION & MORTALITY RATIOS<br />
Figures 10.25–32 compare mortality and hospitalization among dialysis<br />
provider types, chains, and regions, using standardized mortality<br />
ratios (SMRs) and standardized hospitalization ratios (SHRs).<br />
Both are estimated by the traditional SMR calculation method. A<br />
patient’s dialysis provider is defined on January 1, 2007. Patients are<br />
followed from January 1, 2007, to the first <strong>of</strong> death, transplant, or<br />
December 31, 2007. Patients dying <strong>of</strong> AIDS are excluded; those dying<br />
<strong>of</strong> drug overdose (street drugs) or an accident not related to treat-<br />
ment are censored at the date <strong>of</strong> death. SMR calculations include all<br />
January 1, 2007, point prevalent hemodialysis patients, while SHR<br />
calculations include only hemodialysis patients with Medicare as<br />
primary payor, and use the number <strong>of</strong> hospital admissions as the<br />
endpoint. Both SMRs and SHRs are adjusted for age, gender, race,<br />
primary diagnosis, and vintage, with 2007 point prevalent hemodialysis<br />
patients used as the reference cohort for the SMR calculations,<br />
and Medicare patients used for the SHR data.<br />
Costs <strong>of</strong> <strong>ESRD</strong><br />
Chapter Eleven; K tables<br />
The majority <strong>of</strong> the economic analyses in this year’s <strong>ADR</strong> use the astreated<br />
model, described in detail later in this section.<br />
PAYOR SEQUENCE<br />
The payor sequence is similar in concept to the USRDS treatment<br />
history. Payor status is tracked for each <strong>ESRD</strong> patient from the first<br />
<strong>ESRD</strong> service date until death or the end <strong>of</strong> the study period. <strong>Data</strong><br />
from the Medicare Enrollment <strong>Data</strong>base, as well as dialysis claims<br />
information, are used to categorize payor status as Medicare primary<br />
payor (MPP), Medicare secondary payor (MSP), Medicare Advantage<br />
(HMO), or non-Medicare. The claims database contains data only for<br />
MPP and MSP patients, so economic analyses are restricted to these<br />
categories. In addition, since it is impossible to determine the complete<br />
cost <strong>of</strong> care for <strong>ESRD</strong> patients with MSP coverage, most analyses<br />
exclude patients during the periods when they have this coverage.<br />
CHAPTER ELEVEN<br />
Table p.a in the Précis summarizes data on the costs <strong>of</strong> <strong>ESRD</strong> treatment.<br />
Total 2007 Medicare spending is calculated from the claims<br />
data, and includes all paid claims for <strong>ESRD</strong> patients in the USRDS<br />
database. Cost aggregation for each patient begins at the first <strong>ESRD</strong><br />
service date. Total 2007 Medicare spending is inflated by 2 percent<br />
to account for incomplete claims, and organ acquisition costs<br />
are estimated with the same methods used in the 1999 <strong>ADR</strong> (pages<br />
149–150). HMO costs are estimated using the total HMO months for<br />
2007 (obtained from the CMS managed care organization file) in<br />
conjunction with the 2007 AAPCC rate.<br />
Non-Medicare EGHP spending is estimated by separately computing<br />
the per year at-risk costs for EGHP and non-EGHP patients,<br />
then multiplying the difference by the EGHP years at risk for 2007.<br />
Patient obligations are estimated as the difference between Medicare<br />
allowable and net payment amounts. Non-Medicare patient<br />
spending is estimated as the number <strong>of</strong> patient months at risk for<br />
non-Medicare patients (determined from the USRDS payor sequence)<br />
multiplied by the AAPCC rate.<br />
Changes in Medicare spending from 2006 to 2007 are obtained<br />
from Table K.2, without the 2 percent adjustment for late claims. Calculations<br />
<strong>of</strong> per person per year (PPPY) at-risk costs are based on<br />
patients for whom Medicare is the primary payor during the study<br />
period (Table K.e), again using non-inflated results. The range for<br />
inflation-adjusted costs is calculated using the overall Consumer Price<br />
Index (2.8 percent) and Medical Consumer Price Index (4.4 percent).<br />
<strong>Data</strong> on costs for vascular access physician/supplier services<br />
(Figures 11.16 and 11.19) are obtained directly from the physician/<br />
supplier Standard Analytical Files (SAF), and do not include any<br />
facility charges. Physician/supplier vascular access procedures and<br />
costs are identified through CPT codes (Table a.b). Because some<br />
CPT codes are not specific to an <strong>ESRD</strong> access (e.g., central venous<br />
catheter, radiological procedures), our selection process requires<br />
that certain CPT codes be accompanied by a renal-related diagnosis<br />
Costs <strong>of</strong> <strong>ESRD</strong><br />
4 APPENDIx A: ANAlyTICAl METHODS<br />
<strong>2009</strong> USRDS Annual <strong>Data</strong> Report<br />
Vol 2<br />
esrd<br />
5<br />
App A<br />
pg 379
5<br />
App A<br />
pg 380<br />
code for inclusion in the analysis (these codes are identified with an<br />
asterisk in Table a.b). PPPY total vascular access costs (Figure 11.18)<br />
are obtained from event-based analyses, and include both physician/supplier<br />
costs as described above, and facility costs that can<br />
be attributed to vascular access services. Facility costs are difficult<br />
to identify. For inpatient facility costs, vascular access procedures<br />
in the inpatient setting (identified from the physician/supplier SAF)<br />
are matched with inpatient claims, and all procedures performed<br />
during a given inpatient stay (admission date through discharge<br />
date) are considered a single vascular access event. Because vascular<br />
access procedures are <strong>of</strong>ten performed when a patient is hospitalized<br />
for another reason, costs for inpatient facilities are included in<br />
the analysis only if the cause <strong>of</strong> hospitalization can be reasonably<br />
attributed to vascular access, using Diagnosis Related Grouping<br />
(DRG) and ICD-9-CM principal procedure codes, or ICD-9-CM principal<br />
diagnosis codes (Table a.c). Such hospitalizations are labeled<br />
“pure” inpatient vascular access events.<br />
For outpatient facility costs, physician/supplier claims with<br />
vascular access procedures performed in the outpatient setting<br />
are linked to outpatient claims, using service dates and CPT codes.<br />
These costs are included in the analysis only if a matching CPT code<br />
is found on both physician/supplier and outpatient claims. Once<br />
again, all procedures and costs for the entire matching outpatient<br />
claim are considered part <strong>of</strong> a single vascular access event. Since<br />
the CPT code is not a required element on outpatient claims, not<br />
all outpatient facility costs for vascular access can be identified.<br />
Events that can be identified in the outpatient claims are labeled<br />
“pure” outpatient vascular access events.<br />
Although vascular access procedures can be identified from<br />
claims data, it is not possible to determine with certainty the type<br />
<strong>of</strong> vascular access being used for dialysis at any given time. In order<br />
to compare overall and vascular access costs by type <strong>of</strong> vascular<br />
access, data are analyzed for the hemodialysis cohort from the CMS<br />
<strong>ESRD</strong> Clinical Performance Measures Project (CPM) for 1999 through<br />
2007. The CPM project collects data annually on a random sample<br />
<strong>of</strong> hemodialysis and peritoneal dialysis patients, including the type<br />
<strong>of</strong> vascular access being used for hemodialysis at the time <strong>of</strong> data<br />
collection. The CPM data for hemodialysis patients are collected<br />
from October through December <strong>of</strong> the year prior to the cohort<br />
a bii<br />
CPT codes for vascular access &<br />
peritoneal dialysis access services<br />
Complication 34101 * , 35190 * , 35321 * , 35458 * ,<br />
35460 * , 35475 * , 35476 * , 35484 * , 35875 * , 35876 * ,<br />
35900 * , 35903 * , 35910 * , 36005 * , 36145, 36534 * ,<br />
36535 * , 36550 * , 36575 * , 36580 * , 36581 * , 36584 * ,<br />
36589 * ,36596 * , 36597 * , 36831, 36832, 36833,<br />
36834 * , 36838, 36860, 36861, 36870, 37190 * ,<br />
37201 * , 37205 * , 37206 * , 37207 * , 37208 * , 37607,<br />
49422, 75790, 75820 * , 75860 * , 75896 * , 75960 * ,<br />
75962 * , 75978 * , 76937 * , 75998 * , 00532 * , 01784 * ,<br />
01844 * , 90939, 90940, G0159, and M0900<br />
Hemodialysis catheter placement 36011 * ,<br />
36488 * , 36489 * , 36490 * , 36491 * , 36533 * , 36555 * ,<br />
36556 * , 36557 * , 36558 * , 36565 * , and 36800<br />
Peritoneal dialysis catheter placement 49419,<br />
49420, and 49421<br />
Synthetic graft placement 36830<br />
Fistula placement 36818, 36819, 36820, 36821,<br />
and 36825<br />
* Requires accompanying renal<br />
diagnosis code for inclusion.<br />
a cii<br />
year (e.g., CPM data were collected from October through December,<br />
2006, for the 2007 cohort). For Figures 11.17–18 we classify patients<br />
by the vascular access in use at the time <strong>of</strong> the CPM data collection,<br />
and aggregate costs for the following calendar year, with followup<br />
until the earliest <strong>of</strong> death, transplant, modality change, or the<br />
end <strong>of</strong> the calendar year. This analysis is limited to patients with<br />
Medicare as primary payor.<br />
For Figure 11.20, prevalent hemodialysis patients from 1998–2006<br />
are matched to the <strong>ESRD</strong> CPM data to obtain the vascular access in<br />
use at the end <strong>of</strong> their prevalent year. Inpatient hospital stays during<br />
the following calendar year (censored at a change in modality<br />
or a placement event for a different type <strong>of</strong> access) are identified as<br />
being for a vascular access infection if the principal diagnosis is<br />
996.62, “Infection <strong>of</strong> Internal Device.” The total payment amount<br />
from that inpatient stay is used to calculate a PPPY cost.<br />
Information about the construction <strong>of</strong> other figures and tables<br />
is provided in the captions.<br />
REFERENCE SECTION K: MEDICARE CLAIMS DATA<br />
Cost information in this section is derived from Medicare inpatient/<br />
outpatient and physician/supplier claims data in the CMS Standard<br />
Analytic Files, which are created annually six months after the end<br />
<strong>of</strong> each calendar year. The data for 2003–2007 are comprised <strong>of</strong><br />
approximately 41 million institutional claims for hospital inpatient<br />
and outpatient facilities, outpatient dialysis facilities, skilled nursing<br />
facilities, hospice facilities, and home health agencies, as well as<br />
over 350 million line items from physician/supplier claims. Claims<br />
data are obtained for all patient identification numbers in the USRDS<br />
database, and the <strong>Renal</strong> Management Information <strong>System</strong> (REMIS)<br />
is used to gather all CMS ID numbers under which patients may have<br />
claims. The claims data are then merged with patient demographic<br />
data and modality information in the USRDS database.<br />
The economic analyses for this section focus on two amounts<br />
found in the claims data: the claim payment amount, which is the<br />
amount <strong>of</strong> the payment made from the Medicare trust fund for<br />
the services covered by the claim record; and the pass-through per<br />
diem amount, which applies to inpatient claims and reimburses the<br />
provider for capital-related costs, direct medical education costs,<br />
and kidney acquisition costs.<br />
DRG & ICD-9-CM codes for vascular access<br />
& peritoneal dialysis access services<br />
DRG codes a<br />
112 Percutaneous cardiovascular procedure 120 Other circulatory system OR procedure<br />
315 Other kidney and urinary tract OR procedure 442 Other OR procedure for injuries with<br />
complication 443 Other OR procedure for injuries without complication 478 Other vascular<br />
procedure with complication 479 Other vascular procedure without complication<br />
ICD-9-CM procedure codes a<br />
38.95 Venous catheterization for renal dialysis 39.27 Arteriovenostomy for renal dialysis<br />
39.42 Revision <strong>of</strong> arteriovenous shunt for renal dialysis 39.43 Removal <strong>of</strong> arteriovenous<br />
shunt for renal dialysis 39.93 Placement <strong>of</strong> vessel-to-vessel cannula 39.94 Replacement <strong>of</strong><br />
vessel-to-vessel cannula 86.07 Placement <strong>of</strong> totally implantable vascular access device<br />
ICD-9-CM diagnosis codes b<br />
996.1 Mechanical complication <strong>of</strong> vascular device, implant, graft 996.56 Mechanical<br />
complication due to peritoneal dialysis catheter 996.62 Infectious complication <strong>of</strong> vascular<br />
device, implant, graft 996.68 Infectious complication due to peritoneal dialysis catheter<br />
996.73 Other complication due to renal dialysis device, implant, graft V56.1 Fitting and<br />
adjustment <strong>of</strong> extracorporeal dialysis catheter V56.2 Fitting and adjustment <strong>of</strong> peritoneal<br />
dialysis catheter<br />
a DRG and procedure codes are used in conjunction to define inpatient pure vascular access events (both must<br />
be present)<br />
b the presence <strong>of</strong> any <strong>of</strong> these diagnosis codes as the “Principal Diagnosis Code” is sufficient to define an<br />
inpatient pure vascular access or peritoneal dialysis access event
a dii<br />
Medicare categories <strong>of</strong> payment<br />
& basis for categorizing claim<br />
Total Sum <strong>of</strong> all payments<br />
Total inpatient Sum <strong>of</strong> all payments originating from the inpatient SAF,<br />
including pass-throughs<br />
Medical DRG Inpatient SAF, DRG<br />
Surgical DRG Inpatient SAF, DRG<br />
Transplant DRG Inpatient SAF, DRG 302 & 512<br />
Other DRG Inpatient SAF, DRG not included in the above categories<br />
Non-transplant pass-throughs Inpatient SAF, DRG not 302 or 512,<br />
calculated from per diem and covered days<br />
Transplant pass-throughs Inpatient SAF, DRG 302, calculated from<br />
per diem and covered days<br />
Total outpatient Sum <strong>of</strong> all payments originating from the Outpatient<br />
SAF<br />
Outpatient hemodialysis Outpatient SAF, hemodialysis revenue<br />
codes<br />
Outpatient peritoneal dialysis Outpatient SAF, peritoneal dialysis<br />
revenue codes<br />
Outpatient other dialysis Outpatient SAF, dialysis revenue codes<br />
other than HD or PD<br />
Outpatient ESA Outpatient SAF, revenue codes and/or HCPCS code<br />
Outpatient Vitamin D hormones Outpatient SAF, revenue and<br />
HCPCS codes<br />
Outpatient iron Outpatient SAF, revenue and HCPCS codes<br />
Outpatient other injectables Outpatient SAF, revenue and HCPCS<br />
codes<br />
Radiology Outpatient SAF, revenue and/or CPT codes<br />
Pharmacy Outpatient SAF, revenue codes<br />
Ambulance Outpatient SAF, revenue codes<br />
Laboratory/pathology Outpatient SAF, revenue and/or CPT codes<br />
Outpatient other Outpatient SAF, does not qualify for any other cost<br />
category<br />
Skilled nursing facility Skilled nursing facility SAF<br />
Home health agency Home health SAF<br />
Hospice Hospice SAF<br />
Total physician/supplier Sum <strong>of</strong> physician/supplier payments<br />
Transplant surgery Physician/supplier SAF, CPT codes<br />
Inpatient surgery Physician/supplier SAF, CPT, and place <strong>of</strong> service<br />
codes<br />
Outpatient surgery Physician/supplier SAF, CPT and place <strong>of</strong> service<br />
codes<br />
E&M nephrologist inpatient Physician/supplier SAF, CPT,<br />
place <strong>of</strong> service and specialty codes<br />
E&M nephrologist outpatient Physician/supplier SAF, CPT,<br />
place <strong>of</strong> service and specialty codes<br />
E&M non-nephrologist inpatient Physician/supplier SAF, CPT,<br />
place <strong>of</strong> service and specialty codes<br />
E&M non-nephrologist outpatient Physician/supplier SAF, CPT,<br />
place <strong>of</strong> service and specialty codes<br />
Dialysis capitation Physician/supplier SAF, CPT and/or type<br />
<strong>of</strong> service codes<br />
Inpatient dialysis Physician/supplier SAF, CPT codes<br />
Home dialysis Physician/supplier SAF, HCPCS and place <strong>of</strong> service<br />
codes<br />
Vascular access Physician/supplier SAF, CPT codes<br />
Peritoneal access Physician/supplier SAF, CPT codes<br />
Physician/supplier ESA Physician/supplier SAF, HCPCS codes<br />
Physician/supplier iron Physician/supplier SAF, HCPCS codes<br />
Immunosuppressive drugs Physician/supplier SAF, HCPCS codes<br />
Durable medical equipment Physician/supplier SAF, HCPCS codes<br />
Physician/supplier radiology Physician/supplier SAF, CPT and<br />
specialty codes<br />
Physician/supplier lab/pathology Physician/supplier SAF, CPT codes<br />
Physician/supplier ambulance Physician/supplier SAF, HCPCS and<br />
place <strong>of</strong> service codes<br />
Other physician/supplier Physician/supplier SAF, does not qualify<br />
for any other category<br />
E&M: Evaluation and management<br />
PAYMENT CATEGORIES<br />
Medicare payments are broken into several categories, as shown in<br />
Table a.d. Estimates <strong>of</strong> costs from the Outpatient SAF are derived for<br />
the individual services provided. Since actual payment amounts are<br />
provided only for the entire claim, cost estimates for dialysis, EPO,<br />
iron, and so forth are calculated from the claim-level “Total Charge,”<br />
the payment amount, and the revenue line-level “Total Charge,” as<br />
follows: payment (line) = [total charge (line) / total charge (claim)]<br />
* payment (claim). In August <strong>of</strong> 2000 CMS added to the Outpatient<br />
SAF a field containing line item payment amounts. According to CMS<br />
documentation, the total <strong>of</strong> these payments may not equal the total<br />
paid amount for the claim. In such cases, each line item cost is discounted<br />
by the ratio <strong>of</strong> the sum <strong>of</strong> line item payment amounts to the<br />
total paid amount for the claim. Since complete data on line item<br />
payments are available starting with the 2001 Outpatient SAF, the estimates<br />
for outpatient payment categories are taken directly from the<br />
claims data for calendar years 2001–2007, with adjustments as noted.<br />
MODEL 1: AS-TREATED ACTUARIAL MODEL<br />
In an as-treated model patients are first classified by their modality<br />
at entry into the analysis, and retain that classification until a<br />
modality change. When a change is encountered in the data, the<br />
beginning modality is censored at the change date plus 60 days,<br />
and a new observation with the new modality is created. The first<br />
60 days after a change are attributed to the previous modality to<br />
account for any carryover effects. If the change is from dialysis to<br />
transplant, however, the modality is censored, and the transplant<br />
modality begins on the date <strong>of</strong> the transplant hospital admission.<br />
In the case <strong>of</strong> changes involving only a change from one type <strong>of</strong><br />
dialysis to another, the new modality must last at least 60 days in<br />
order to be counted. Aggregation <strong>of</strong> Medicare payments is done on<br />
an as-treated basis, attributing all payments to the patient’s modality<br />
at the time <strong>of</strong> the claim.<br />
In Section K <strong>of</strong> the Reference Tables we classify patients into<br />
four as-treated modality categories: hemodialysis, CAPD/CCPD, other<br />
dialysis, and transplant. The “other dialysis” category includes cases<br />
in which the dialysis modality is unknown or is not hemodialysis<br />
or CAPD/CCPD, while the transplant category includes patients who<br />
have a functioning graft at the start <strong>of</strong> the period or who receive a<br />
transplant during the period. Some tables also include categories<br />
for all dialysis (hemodialysis, CAPD/CCPD, and other dialysis) and<br />
all <strong>ESRD</strong> (all-dialysis and transplant).<br />
The study spans the 17 years from January 1, 1991, to December<br />
31, 2007, and <strong>ESRD</strong> patients prevalent on January 1, 1991, or incident<br />
at any time during the period are potentially eligible for inclusion.<br />
The initial study start date for a given patient is defined as the latest<br />
<strong>of</strong> January 1, 1991, the first <strong>ESRD</strong> service date in the USRDS database<br />
for that patient, or the earliest Medicare eligibility date from the<br />
payor sequence. Because it is impossible to characterize the total<br />
cost <strong>of</strong> their care, patients for whom Medicare is the secondary<br />
payor at any time during the study period are classified as MSP for<br />
the duration <strong>of</strong> the MSP status in the payor sequence. If the payor<br />
status changes to Medicare as primary payor, a new sequence begins<br />
at the change date. Patients who are non-Medicare or enrolled in a<br />
Medicare Advantage program are excluded until their payor status<br />
changes to Medicare (either as primary or secondary payor). Patients<br />
classified as MSP are included in Tables K.1–3, and are excluded for<br />
the rest <strong>of</strong> the tables in Section K.<br />
For each modality period, Medicare payments are aggregated<br />
from the modality start date until the earliest <strong>of</strong> death, transplant,<br />
modality change, loss to follow-up, or December 31, 2007. Patients<br />
Costs <strong>of</strong> <strong>ESRD</strong><br />
4 APPENDIx A: ANAlyTICAl METHODS<br />
<strong>2009</strong> USRDS Annual <strong>Data</strong> Report<br />
Vol 2<br />
esrd<br />
5<br />
App A<br />
pg 381
5<br />
App A<br />
pg 382<br />
incurring no inpatient/outpatient or physician/supplier Medicare<br />
costs for the entire period are excluded, and Medicare payment<br />
amounts are linearly prorated for claims that span the start or end<br />
date <strong>of</strong> a modality period or <strong>of</strong> the study itself.<br />
To express costs as dollars per year at risk, total costs during<br />
the follow-up period are divided by the length <strong>of</strong> the period.<br />
Costs per patient year at risk are calculated by patient category,<br />
and stratified by age, gender, race, modality, and diabetic status.<br />
Diabetic status is based on the primary diagnosis, as recorded on<br />
the Medical Evidence form. A patient with a non-diabetic cause<br />
<strong>of</strong> renal failure may have diabetes, but the disease is not judged<br />
to be the cause <strong>of</strong> <strong>ESRD</strong>. Patient age is calculated at the study start<br />
date, and patients with a missing date <strong>of</strong> birth are excluded from<br />
the analysis.<br />
MODEL 2: CATEGORICAL CALENDAR YEAR MODEL<br />
This model, described in the HCFA (now CMS) research report on<br />
<strong>ESRD</strong> (1993–1995), is used for Figure 11.12, and, in the Précis, Table<br />
p.b, as well as Reference Tables K.9–12. With this method, patients<br />
are classified into four mutually exclusive treatment groups:<br />
4 dialysis: <strong>ESRD</strong> patients who are on dialysis for the entire calendar<br />
year, or for that part <strong>of</strong> the year in which they are alive,<br />
<strong>ESRD</strong>, and Medicare entitled.<br />
4 transplant: <strong>ESRD</strong> patients with a kidney transplant during<br />
the calendar year.<br />
4 functioning graft: <strong>ESRD</strong> patients with a functioning graft for<br />
the entire calendar year, or for that part <strong>of</strong> the year in which<br />
they are alive, <strong>ESRD</strong>, and Medicare entitled.<br />
4 graft failure: <strong>ESRD</strong> patients who have had a transplant, but<br />
return to dialysis due to loss <strong>of</strong> graft function during the<br />
calendar year; patients with a graft failure and a transplant<br />
in the same calendar year are classified in the transplant<br />
category.<br />
Tables K.14–18 present estimates <strong>of</strong> per person per year costs<br />
for general Medicare patients, derived from the 5 percent Medicare<br />
sample. The cohorts include those who survive at least the last three<br />
months <strong>of</strong> year one, are continuously enrolled with Medicare inpatient/outpatient<br />
and physician/supplier coverage, are not enrolled<br />
in a managed care program (HMO), and do not have <strong>ESRD</strong> during<br />
year one. Costs for this portion <strong>of</strong> the cohort are aggregated for year<br />
two, with censoring at the earliest <strong>of</strong> death, development <strong>of</strong> <strong>ESRD</strong>,<br />
change in payor status, or the end <strong>of</strong> year two. The cohorts also<br />
include those who survive at least three months <strong>of</strong> year two, with<br />
continuous Medicare inpatient/outpatient and physician/supplier<br />
coverage, and who are not enrolled in an HMO during year two;<br />
costs for this portion <strong>of</strong> the cohort are also aggregated for year two.<br />
Important comorbidities are determined for these cohorts from<br />
Medicare claims using a previously validated method. A patient is<br />
defined as having one <strong>of</strong> these comorbidities if, within the one-year<br />
observation period (year one or year two), he or she has a qualifying<br />
ICD-9-CM diagnosis code on one or more inpatient/outpatient<br />
institutional claims (inpatient, skilled nursing facility, or home<br />
health agency) or two or more institutional outpatient claims and/<br />
or physician/supplier claims. Qualifying diagnosis codes are as<br />
follows: diabetes, 250.xx, 357.2, 362.0x, and 366.41; chronic kidney<br />
disease, 016.0, 095.4, 189.0, 189.9, 223.0, 236.91, 250.4, 271.4, 274.1,<br />
283.11, 403.x1, 404.x2, 404.x3, 440.1, 442.1, 447.3, 572.4, 580–588, 591,<br />
642.1, 646.2, 753.12–753.17, 753.19, 753.2, and 794.4; and cardiovascular<br />
disease, 398.91, 402.x1, 404.x1, 404.x3, 410–414, 420–421, 422.<br />
xx, 423–424, 425.x, 426–427, 428.xx, 429, 430–438, 440–444, 447,<br />
451–453, 557, 785.0–785.3, V42.1, V42.2, V43.3, V45.0, V45.81, V45.82,<br />
and V53.3. Per person per year expenditures are presented for the<br />
1992–1993 through 2006–2007 cohorts. The cost year is always<br />
year two <strong>of</strong> the cohort.<br />
The 2006–2007 general Medicare cohort is also combined with<br />
the <strong>ESRD</strong> period prevalent 2007 cohort for Figure p.1.<br />
EGHP PATIENTS<br />
Several figures in the Précis and Chapter Eleven include data for<br />
EGHP patients. Patients in the MarketScan database who are identified<br />
as <strong>ESRD</strong> (as described previously), are under 65 years <strong>of</strong> age,<br />
and do not have evidence <strong>of</strong> Medicare payments (either as primary<br />
or secondary payor) are included in these analyses. Medicare payments<br />
are identified in the MarkestScan database, and patients are<br />
excluded on the basis <strong>of</strong> these payments in order to obtain a more<br />
accurate estimate <strong>of</strong> <strong>ESRD</strong> costs in the private sector. The payment<br />
amounts presented are the net payments and do not include deductibles<br />
and copayments.<br />
International comparisons<br />
Chapter Twelve<br />
The international data for this <strong>ADR</strong> have been collected from the<br />
following sources, using the data form at the end <strong>of</strong> this section:<br />
4 the Sociedad Argentina de Nefrología (SAN) and Instituto<br />
Nacional Central Unico Coordinador de Ablación e Implante<br />
(INCUCAI)<br />
4 the Australian and New Zealand Dialysis and Transplant<br />
Registry (ANZDATA)<br />
4 the Austria OEDTR<br />
4 the Bangladesh <strong>Renal</strong> Registry<br />
4 the French-Belgian Nephrologists’ Registry<br />
4 Centre Hospitalier Etterbeek-Ixelles, Belgium<br />
4 Clinical Center University <strong>of</strong> Sarajevo, Bosnia, and Herzegovina<br />
4 the Canadian Organ Replacement Registry (CORR)<br />
4 the Chilean <strong>Renal</strong> Registry<br />
4 the Croatian Society <strong>of</strong> Nephrology, Dialysis, and Transplantation<br />
4 the Czech Dialysis Registry<br />
4 the Danish Society <strong>of</strong> Nephrology<br />
4 the ERA-EDTA Registry<br />
4 the Finnish Registry for Kidney Diseases<br />
4 the French <strong>Renal</strong> Epidemiology and Information Network<br />
(REIN) Registry<br />
4 the QuaSi-Niere, Germany<br />
4 the Hellenic <strong>Renal</strong> Registry, Greece<br />
4 the Hong Kong <strong>Renal</strong> Registry<br />
4 the Department <strong>of</strong> Transplantation and Surgery in Hungary<br />
4 the Landspitali University Hospital, Iceland<br />
4 the Transplantation Research Center and Iranian Tissue<br />
Bank, Iran<br />
4 the Israeli <strong>Renal</strong> Registry<br />
4 the Italian Registry <strong>of</strong> Dialysis and Transplantation<br />
4 the Jalisco State Dialysis and Transplant Registry, Mexico<br />
4 the Japanese Society <strong>of</strong> Dialysis Therapy<br />
4 the Korean Society <strong>of</strong> Nephrology <strong>ESRD</strong> registry<br />
4 Registre Néphrologique du Grand Duché de Luxembourg<br />
4 the National <strong>Renal</strong> Registry, Malaysia<br />
4 the Netherlands Dialysis Registry<br />
4 the Norwegian National Hospital<br />
4 the Kidney Foundation <strong>of</strong> Pakistan
4 the Philippines <strong>Renal</strong> Disease Registry Project<br />
4 the Polish <strong>Renal</strong> Registry<br />
4 the Romanian <strong>Renal</strong> Registry<br />
4 the Society <strong>of</strong> Dialysis, Russia<br />
4 the Scottish <strong>Renal</strong> Registry<br />
4 the Shanghai Jiao Tong University<br />
4 the Organización Nacional de Trasplantes, Spain<br />
4 the Swedish <strong>Renal</strong> Registry<br />
4 the Taiwan Society <strong>of</strong> Nephrology<br />
4 the Thai <strong>Renal</strong> Replacement Therapy Registry<br />
4 the Turkish Society <strong>of</strong> Nephrology<br />
4 the UK <strong>Renal</strong> Registry<br />
4 the Uruguayan Registry <strong>of</strong> Dialysis<br />
4 the U.S. Census Bureau International <strong>Data</strong>base<br />
Thank you to all who provided data for this year’s Annual <strong>Data</strong><br />
Report. We are especially grateful to Dr. Kitty Jager and Anneke<br />
Kramer at the ERA-EDTA Registry for their help in coordinating<br />
much <strong>of</strong> the European data presented in this chapter. <strong>Data</strong> for some<br />
countries do not represent 100 percent <strong>of</strong> the <strong>ESRD</strong> population; interpretation<br />
<strong>of</strong> changes in incident and prevalent rates must therefore<br />
be performed with caution. Notations are made in the captions<br />
for those countries reporting data only for dialysis patients. <strong>Data</strong><br />
from Belgium do not include patients younger than 20, and data<br />
on patients with a functioning graft are not included for Argentina,<br />
the Czech Republic, Japan, the Philippines, Shanghai, or Taiwan.<br />
Please note the citation for the Argentinean data: Marinovich<br />
S, Lavorato C, Celia E, Bisignano L, Soratti M, Hansen Krogh D,<br />
Tagliafichi V, Moriñigo C and Rosa Diez G. Registro Argentino de<br />
Diálisis Crónica 2007.<br />
To contribute data from your country’s registry, please complete<br />
the International <strong>Data</strong> Collection Form and return it to the USRDS.<br />
Vascular access<br />
L tables<br />
Tables L.1–3 include period prevalent hemodialysis patients from<br />
1999 to 2007 who have Medicare as their primary payer. Placements<br />
are identified from Medicare claims, and rates represent the total<br />
number <strong>of</strong> events divided by the time at risk. Follow-up time is censored<br />
at death, change in modality, change in payor status, or the<br />
end <strong>of</strong> the prevalent year. Tables L.4–6 include January 1, 2007 point<br />
prevalent hemodialysis patients. Vintage represents the amount <strong>of</strong><br />
time between the first service date and January 1, 2007.<br />
Tables L.7–14 include point prevalent hemodialysis patients with<br />
Medicare as their primary payor who are also in the <strong>ESRD</strong> CPM<br />
report for the corresponding year. Their current access is determined<br />
from the CPM data as the access used at the time <strong>of</strong> the most recent<br />
data collection, i.e., during the months <strong>of</strong> October, November, and<br />
December <strong>of</strong> the year prior to the prevalent year. Complications<br />
and intervention events are obtained from claims during the time<br />
at risk in the prevalent year, which is censored at death, change in<br />
modality, change in payor status, or a claim for the placement <strong>of</strong> a<br />
different hemodialysis vascular access. Patients who have a placement<br />
claim after the time <strong>of</strong> the CPM data collection but prior to<br />
the start <strong>of</strong> the prevalent year are excluded.<br />
Tables L.14–15 include point prevalent peritoneal dialysis patients<br />
with Medicare as primary payor. Complications and intervention<br />
events are obtained from claims during the time at risk in the prevalent<br />
year, which is censored at death, change in modality, change<br />
in payor status, or a claim for the placement <strong>of</strong> a hemodialysis vascular<br />
access.<br />
Census populations<br />
The 2000 <strong>United</strong> <strong>States</strong> Census, available in 2002, introduced a new<br />
race category with additional racial groupings. Census estimates for<br />
1990–1999 were back-calculated based on the actual 2000 census.<br />
For 2000–2006, however, the actual data include racial groups that<br />
do not coincide with those in the <strong>ESRD</strong> data. For 2000–2007 rate<br />
calculations throughout the <strong>ADR</strong>, we thus use the CDC’s Bridged<br />
Race <strong>Data</strong>set, which estimates white, African American, Native<br />
American, and Asian populations. The data and methods for these<br />
estimates are available at http://tinyurl.com/4ezjvr.<br />
Statistical methods<br />
METHODS FOR CALCULATING RATES<br />
The calculation <strong>of</strong> observed rates is straightforward, with some rates<br />
based on counts and others on follow-up time. The <strong>ESRD</strong> incident<br />
rate in 2002, for example, is the observed incident count divided by<br />
the 2002 population size and, if the unit is per million population,<br />
multiplied by one million; the 2002 death rate for prevalent <strong>ESRD</strong><br />
patients is the number <strong>of</strong> deaths in 2002 divided by the total followup<br />
time (patient years) in 2002 <strong>of</strong> the 2002 prevalent patients, and, if<br />
the unit is per thousand patient years, multiplied by one thousand.<br />
Standard errors <strong>of</strong> estimated rates are based on the assumption <strong>of</strong><br />
the data; the observed count has a Poisson or binomial distribution.<br />
model-based rates<br />
Some patient groups may be very small, and their observed rates<br />
therefore unstable. If follow-up time is considered, the hazard <strong>of</strong> an<br />
event may change over time. A model-based method can improve<br />
the stability <strong>of</strong> these estimates and incorporate changes <strong>of</strong> hazard<br />
over time. In this <strong>ADR</strong>, for example, we have used the generalized<br />
linear mixed Poisson model to estimate prevalent patient mortality<br />
rates for Reference Section H.<br />
measurement unit for rates<br />
Both raw and model-based rates are calculated per unit <strong>of</strong> population<br />
(such as per 1,000 patients) or per unit <strong>of</strong> follow-up time (such<br />
as per 1,000 patient years). Calculating rates per unit <strong>of</strong> follow-up<br />
time can account for varying lengths <strong>of</strong> follow-up among patients.<br />
Patient years are calculated as the total number <strong>of</strong> years, or fractions<br />
<strong>of</strong> a year, <strong>of</strong> follow-up time for a group <strong>of</strong> patients.<br />
Take, for example, a calculation <strong>of</strong> 1997 first hospitalization rates<br />
for two groups <strong>of</strong> patients, all receiving dialysis therapy on January<br />
1, 1997. Group A consists <strong>of</strong> three patients: Patient 1 had a first hospitalization<br />
on March 31, 1997; Patient 2 was hospitalized on June<br />
30, 1997; and Patient 3 was on dialysis through December 31, 1997,<br />
with no hospitalizations. Group B also has three patients: Patient<br />
4 was first hospitalized on December 31, 1997; Patient 5 was hospitalized<br />
on September 30, 1997; and Patient 6 was on hemodialysis<br />
the entire year, with no hospitalizations through December 31, 1997.<br />
Patients 1 to 6 contribute 0.25, 0.5, 1.0, 1.0, 0.75, and 1.0 patient<br />
years at risk, respectively. The first hospitalization rate per thousand<br />
patients is 667 for both groups in 1997. But the first hospitalization<br />
rate per thousand patient years at risk is 1,143 for Group A and 727<br />
for Group B (calculated as [2 total events / 1.75 total patient years at<br />
risk] x 1,000 for Group A and [2 total events / 2.75 patient years at<br />
risk] x 1,000 for Group B). The resulting rate is lower for Group B<br />
because <strong>of</strong> the longer total follow-up time.<br />
Rates per unit <strong>of</strong> population may be influenced by the proportion<br />
<strong>of</strong> patients who are followed for only a fraction <strong>of</strong> a year. The<br />
event rate per unit <strong>of</strong> population is likely to be lower, for example,<br />
in a group <strong>of</strong> patients followed for only one month until censoring<br />
Vascular access<br />
4 APPENDIx A: ANAlyTICAl METHODS<br />
<strong>2009</strong> USRDS Annual <strong>Data</strong> Report<br />
Vol 2<br />
esrd<br />
5<br />
App A<br />
pg 383
5<br />
App A<br />
pg 384<br />
than in a group whose patients are each followed for up to a full<br />
year. Rates per unit <strong>of</strong> follow-up time at risk, in contrast, count only<br />
the actual time that a patient is at risk for the event.<br />
METHODS FOR ADJUSTING RATES<br />
Because each cohort contains a different patient mix, unadjusted<br />
event rates may not be comparable across cohorts. Adjusted analyses<br />
make results comparable by reporting rates that would have arisen<br />
had each cohort contained patients with the same distribution <strong>of</strong><br />
confounders — such as age, gender, race, and primary diagnosis — as<br />
the reference population.<br />
direct adjustment<br />
There are several rate adjustment methods, but only the direct<br />
method allows rates to be compared (Pickle LW, White AA). Here<br />
the adjusted rate is derived by applying the observed category-specific<br />
rates to a single standard population, i.e. the rate is a weighted average<br />
<strong>of</strong> the observed category-specific rates, using as weights the proportion<br />
<strong>of</strong> each category in the reference population. Categories are<br />
defined by the adjusting variables. For example, if a rate is adjusted<br />
for race and gender and there are three race groups (white, African<br />
American, and other) and two gender groups, there are six categories:<br />
white males, white females, African American males, African<br />
American females, males <strong>of</strong> other races, and females <strong>of</strong> other races.<br />
Suppose we try to compare state-level incident rates in 2001<br />
after removing the difference caused by race. To do this, we need<br />
to calculate the adjusted incident rate, adjusted for race, for each<br />
state. Because racial distributions in each state are quite different,<br />
we use as reference the national population — here, the population<br />
at the end <strong>of</strong> 2001 — with five race groups (white, African American,<br />
Native American, Asian/Pacific Islander, and other).<br />
Assuming the incident rate <strong>of</strong> state A in 2001 is 173 per million<br />
population, and the race-specific rates and national populations are<br />
as shown in the following table, the adjusted incident rate <strong>of</strong> state<br />
A with the national population as reference is (153 x 75.1%) + (250 x<br />
12.3%) + (303 x 0.9%) + (174 x 3.6%) + (220 x 8%) = 158.73 per million<br />
population. This means that if state A had the same racial distribution<br />
as the entire country, its incident rate would be 158.73 instead<br />
<strong>of</strong> 173. If state B had an adjusted incident rate <strong>of</strong> 205, we could say<br />
that state B had a higher incident rate than state A if they both had<br />
the same racial distribution as the whole country.<br />
Incident rate National<br />
<strong>of</strong> State A Population (%)<br />
White 153 75.1<br />
African American 250 12.3<br />
Native American 303 0.9<br />
Asian/Pacific Islander 174 3.6<br />
Other 220 8.0<br />
This method is used to produce some adjusted incident and prevalent<br />
rates in Chapters Two and Three and in Reference Sections A<br />
and B, as well as in the model-based adjustment method.<br />
model-based adjustment<br />
Under some circumstances there are disadvantages to the direct<br />
adjustment method. Suppose we are calculating mortality rates for<br />
a set <strong>of</strong> groups, and adjusting for potential confounding variables.<br />
If one category in a group has only a few patients or deaths, its estimated<br />
mortality rate will be unstable, likely making the adjusted rate<br />
unstable as well. In addition, if one includes category no patients,<br />
the method is not valid for calculating an adjusted mortality rate for<br />
the group. An attractive alternative is a model-based approach, in<br />
which we find a good model to calculate category-specific estimated<br />
rates for each group and then calculate direct adjusted rates using<br />
these estimates with a given reference population. This method can<br />
also be extended to adjustments with continuous adjusting variables<br />
(Liu et al., 2006). There is, unfortunately, no straightforward<br />
way here to calculate standard errors <strong>of</strong> the adjusted rates for some<br />
models; the bootstrap approach works well, but is time consuming.<br />
In this <strong>ADR</strong> we use model-based adjustments to calculate adjusted<br />
mortality rates; adjusted survival probabilities based on the Cox<br />
regression model; adjusted hospitalization rates and state-level<br />
adjusted incident and prevalent rates using the Poisson model;<br />
adjusted HSA-level incident and prevalent rates based on the Bayesian<br />
spatial hierarchical model, and some other rates, described in<br />
the text on the individual figures.<br />
SURVIVAL PROBABILITIES & MORTALITY RATES<br />
unadjusted survival probabilities<br />
In this <strong>ADR</strong>, unadjusted survival probabilities are calculated using<br />
the Kaplan-Meier method, and corresponding standard errors are<br />
calculated with Greenwood’s formula (Kalbfleisch JD, Prentice RL).<br />
Survival probabilities in Reference Section I are expressed as percentages<br />
from 0 to 100.<br />
adjusted survival probabilities<br />
Adjusted survival probabilities are reported in Reference Sections G<br />
and I, with age, gender, race, and primary diagnosis used as adjusting<br />
risk factors. The model-based adjustment method is used with<br />
survival probabilities predicted from the Cox regression model (Kalbfleisch<br />
JD, Prentice RL). This process yields estimates <strong>of</strong> probabilities<br />
that would have arisen in each year if the patients had had the<br />
same attributes as the reference population. Since the probabilities<br />
in each table are adjusted to the same reference set <strong>of</strong> patient attributes,<br />
any remaining differences among cohorts and years are due<br />
to factors other than age, gender, race, and primary diagnosis. The<br />
adjusted mortality rates for incident cohorts in Reference Section<br />
H are calculated using similar methods.<br />
GENERALIZED LINEAR MODELS<br />
generalized linear mixed model for mortality rates<br />
We use the generalized linear mixed model with log link and Poisson<br />
distribution to calculate mortality and first transplant rates for<br />
prevalent patients. While rates are reported for a year, data from the<br />
previous two years with different weights are also used to improve<br />
the stability <strong>of</strong> the estimates. The generalized linear mixed model<br />
is used as well for SMR calculations, described later in this section.<br />
The generalized linear mixed model, which considers both fixed<br />
and random effects, is implemented using the SAS macro GLIMMIX.<br />
The rates for the intersections <strong>of</strong> age, gender, race, and diagnosis<br />
are estimated using the log linear equation Log (rate) = (fixed<br />
effects) + (random effect). Fixed effects include year, age, gender,<br />
race, and primary diagnosis, and all two-way interactions among<br />
age, gender, race, and primary diagnosis. Assumed to be independently<br />
and identically distributed with a normal distribution, the<br />
random effect is the four-way interaction <strong>of</strong> age, gender, race, and<br />
primary diagnosis. Age is used as a categorical variable in main<br />
effect and four-way interactions, and as a continuous variable in<br />
the two-way interactions.<br />
For tables with mortality rates for both intersecting and marginal<br />
groups we have used a single model to calculate all rates in
each table. The marginal rates are simply the weighted averages <strong>of</strong><br />
the estimated, cross-classified rates, with cell-specific patient years<br />
as weights. For this approach the use <strong>of</strong> a single model means that<br />
GLIMMIX cannot give the standard errors for some <strong>of</strong> these estimated<br />
rates; the bootstrap method is therefore used instead.<br />
The adjusted mortality rates for prevalent cohorts in Section H<br />
are calculated using the direct adjustment method based on the<br />
category-specific mortality rates from the generalized linear mixed<br />
models.<br />
generalized linear model for hospitalization rates<br />
In this <strong>ADR</strong>, hospitalization reference tables present rates <strong>of</strong> total<br />
admissions and hospital days. We use a generalized linear model<br />
with log link and Poisson distribution; the model includes age, gender,<br />
race, primary diagnosis, and their two-way interactions.<br />
To stabilize the estimates, three years <strong>of</strong> data are used with different<br />
weights. Year is also included in the model as a covariate.<br />
The adjusted hospitalization rates are calculated using the direct<br />
adjustment method based on the category-specific admission rate<br />
from the generalized linear models.<br />
STANDARDIZED MORTALITY RATIOS<br />
The standardized mortality ratio (SMR) compares the mortality<br />
<strong>of</strong> a group <strong>of</strong> patients relative to a specific norm, or reference,<br />
after adjusting for some important risk factors. For example, the<br />
state-level SMR is used to compare mortality in prevalent dialysis<br />
patients — after adjusting for age, gender, race, primary diagnosis,<br />
and <strong>ESRD</strong> vintage — in each state using the national dialysis population<br />
in the corresponding year as the reference. An SMR <strong>of</strong> 1.05<br />
for a state indicates that patients in this state have a risk <strong>of</strong> death<br />
approximately five percent higher than that <strong>of</strong> patients in the reference<br />
population <strong>of</strong> all U.S. dialysis patients.<br />
traditional method <strong>of</strong> SMR calculation<br />
The traditional approach used to calculate unit-specific SMRs is<br />
straightforward: produce unit-specific expected death counts and<br />
compute the “observed/expected” ratio. There are two methods<br />
<strong>of</strong> producing unit-specific expected death counts. In the indirect<br />
method, the expected death count is the weighted sum <strong>of</strong> categoryspecific<br />
death rates in the reference population, and the weights<br />
are the category-specific total follow-up times in the units. In the<br />
model-based method, a statistical model is employed to estimate<br />
the category-specific death rate for the reference population, and the<br />
indirect method is then used to produce the expected death count<br />
for each unit based on the estimates <strong>of</strong> category-specific death rates<br />
<strong>of</strong> the reference population from the model.<br />
EXPECTED REMAINING LIFETIMES<br />
The expected remaining lifetime for a patient group is the average <strong>of</strong><br />
the remaining life expectancies for the patients in that group. Some<br />
patients will live longer than, and some will live less than, the average.<br />
Although the average cannot be known until all patients in the<br />
cohort have died, the expected remaining lifetime can be projected<br />
by assuming that patients in the cohort will die at the same rates as<br />
those observed among groups <strong>of</strong> recently prevalent <strong>ESRD</strong> patients.<br />
For a subgroup <strong>of</strong> <strong>ESRD</strong> patients <strong>of</strong> a particular age, the expected<br />
remaining lifetime is calculated using a survival function, estimated<br />
for the group. Let S(A) denote the survival function <strong>of</strong> patients at<br />
time A. Among patients alive at age A, the probability <strong>of</strong> surviving<br />
X more years is S(X|A) = S(A+X)/S(A). For a given starting age A,<br />
the expected remaining lifetime is then equal to the area under the<br />
curve <strong>of</strong> S(X|A) plotted versus X. Because few patients live beyond<br />
100, this area is truncated at the upper age limit A + X = 100.<br />
MAPPING METHODS<br />
Mapping is an important tool for assessing environmental determinants<br />
and illustrating spatial patterns and temporal trends. Geographic<br />
resolution is enhanced by mapping at the level <strong>of</strong> small<br />
regions, but this can increase data instability. The use <strong>of</strong> smoothing<br />
methods, however, can help stabilize data and show geographic<br />
patterns while still maintaining geographic resolution.<br />
Much <strong>of</strong> disease mapping within the <strong>ADR</strong> is by Health Service<br />
Area (HSA), an approach we continue to adopt from the <strong>Atlas</strong> <strong>of</strong><br />
<strong>United</strong> <strong>States</strong> Mortality (Centers for Disease Control and Prevention).<br />
Remaining maps are by state or census division. Each HSA is<br />
a group <strong>of</strong> counties described by the CDC authors as “an area that is<br />
relatively self-contained with respect to hospital care.” The methods<br />
described here have been used for all HSA-level maps in the <strong>ADR</strong>.<br />
Because the distribution <strong>of</strong> age, gender, and race in a population<br />
can affect incident and prevalent <strong>ESRD</strong> rates, we have included maps<br />
in which data are adjusted for these variables as well as smoothed.<br />
Maps by state and census division are not smoothed.<br />
In many figures, data ranges have been standardized to invite<br />
comparisons across years, modalities, or patient characteristics. In<br />
remaining maps, HSAs are divided into quintiles.<br />
Throughout the <strong>ADR</strong>, data in maps and graphs are unadjusted<br />
unless otherwise noted. HSA-level information is mapped according<br />
to the patient’s residence (with the exception <strong>of</strong> some maps <strong>of</strong><br />
organ donation rates in Chapter Seven). Because <strong>of</strong> area size and<br />
limitations in the mapping s<strong>of</strong>tware, data for Puerto Rico and the<br />
U.S. Territories are not included in the maps.<br />
methods for smoothing & adjusting map data<br />
To smooth map data we use a Bayesian spatial hierarchical model<br />
(Waller et al.). This method is a statistical approach that uses the log<br />
linear model (Poisson regression model) to fit the incident counts <strong>of</strong><br />
the regions. The region effects, as random effects, follow the Conditional<br />
Autoregressive (CAR) Normal distribution, and the precision<br />
<strong>of</strong> the effects has a Gamma distribution. The model smooths the<br />
incident counts by borrowing information for each HSA from its<br />
neighbors through the relationship defined by CAR; neighbors, in our<br />
definition, are HSAs sharing a boundary. Smoothed incident rates<br />
are obtained by dividing the predicted counts by the corresponding<br />
population sizes. For adjusted maps, an almost non-informative<br />
prior is assigned to fixed effects <strong>of</strong> age, gender, and race with the<br />
Bayesian model. Adjusted incident rates are calculated using the<br />
model-based adjustment method based on the predicted values<br />
from the Bayesian spatial hierarchical model, with the national<br />
population as reference.<br />
This model is also used to smooth prevalent rates and calculate<br />
some percentages. To smooth maps <strong>of</strong> mean hemoglobin, eGFRs,<br />
and creatinine levels, the model is extended to assume that the<br />
means have a normal distribution.<br />
Miscellaneous<br />
SPECIAL STUDIES & DATA COLLECTION FORMS<br />
The USRDS website includes complete copies <strong>of</strong> the CMS Medical Evidence<br />
(2728) and Death Notification forms (2746); the OPTN Transplant<br />
Candidate Registration form, Kidney Transplant Recipient<br />
Registration form and Kidney Transplant Recipient Follow-up form;<br />
and forms used for data collection in USRDS Special Studies.<br />
Miscellaneous<br />
4 APPENDIx A: ANAlyTICAl METHODS<br />
<strong>2009</strong> USRDS Annual <strong>Data</strong> Report<br />
Vol 2<br />
esrd<br />
5<br />
App A<br />
pg 385
5<br />
App A<br />
pg 386<br />
Bibliography<br />
Volumes One & Two<br />
Analytic and reporting guidelines: the Third National Health<br />
and Nutrition Examination Survey, NHANES III (1988–1994). http://<br />
www.cdc.gov/nchs/data/nhanes/nhanes3/nh3gui.pdf. Accessed<br />
October, 2002.<br />
Arias E. <strong>United</strong> <strong>States</strong> life tables, 2004. National vital statistics<br />
reports 56 (9). Hyattsville, Maryland: National Center for Health<br />
Statistics, 2007.<br />
Boyle JP, Honeycutt AA, Narayan KMV, Hoerger TJ, Geiss LS,<br />
Chen H, Thompson TJ. Projection <strong>of</strong> diabetes burden through 2050.<br />
Diabetes Care 24: 1936–1940, 2001.<br />
Centers for Disease Control and Prevention. NHANES 1999–<br />
2000 data files, available at the National Center for Health Statistics,<br />
http://www.cdc.gov/nchs/about/major/nhanes/nhanes99_00.<br />
htm.<br />
Centers for Disease Control and Prevention. NHANES 2001–2002<br />
<strong>Data</strong> Files, available at National Center for Health Statistics, http://<br />
www.cdc.gov/nchs/about/major/nhanes/nhanes01-02.htm.<br />
Centers for Disease Control and Prevention (CDC). State-specific<br />
incidence <strong>of</strong> diabetes among adults — participating states, 1995–<br />
1997 and 2005–2007. MMWR Morb Mortal Wkly Rep. 2008 Oct 31;<br />
57(43): 1169–73.<br />
Centers for Disease Control and Prevention. The third National<br />
Health and Nutrition Examination Survey (NHANES III 1988–94)<br />
reference manuals and reports [CD-ROM]. Bethesda MD: National<br />
Center for Health Statistics, 2004.<br />
Coca SG, Krumholz HM, Garg AX, Parikh CR. Underrepresentation<br />
<strong>of</strong> renal disease in randomized controlled trials <strong>of</strong> cardiovascular<br />
disease. JAMA 2006; 296(11): 1377–84).<br />
Coresh J, Astor BC, Greene T, Eknoyan G, Levey AS. Prevalence <strong>of</strong><br />
chronic kidney disease and decreased kidney function in the adult<br />
US population: Third National Health and Nutrition Examination<br />
Survey. Am J Kidney Dis 2003 Jan; 41 (1): 1–12.<br />
Coresh J, Selvin E, Stevens LA, Manzi J, Kusek JW, Eggers P,<br />
Van Lente F, Levey AS. Prevalence <strong>of</strong> chronic kidney disease in the<br />
<strong>United</strong> <strong>States</strong>. JAMA 2007, Nov 7; 298 (17): 2038–47.<br />
Daughton DM, Fix AJ: Human Activity Pr<strong>of</strong>ile Test Booklet.<br />
Odessa FL, Psychological Assessment Resources, Inc., 1986.<br />
Draper NR, Smith H. Applied regression analysis. 3d ed. New<br />
York: Wiley, 1998.<br />
Foley RN, Murray AM, Li S, Herzog XA, McBean AM, Eggers PW,<br />
and Collins AJ. Chronic kidney disease and the risk for cardiovascular<br />
disease, renal replacement, and death in the <strong>United</strong> <strong>States</strong> Medicare<br />
population, 1998 to 1999. J Am Soc Nephrol, 2005; 16:489–95.<br />
Gilbertson DT, Liu J, Xue JL, Louis TA, Solid CA, Ebben JP, Collins<br />
AJ. Projecting the number <strong>of</strong> patients with end-stage renal disease<br />
in the <strong>United</strong> <strong>States</strong> to the year 2015. J Am Soc Nephrol 2005 Dec;<br />
16(12): 3736–41. Epub 2005 Nov 2. Erratum in: J Am Soc Nephrol<br />
2006 Feb; 17(2): 591.<br />
Go AS, Chertow GM, Fan D, McCulloch CE, Hsu CY. Chronic<br />
kidney disease and the risks <strong>of</strong> death, cardiovascular events, and<br />
hospitalization. N Engl J Med. 2004 Sep 23; 351(13): 1296–305.<br />
Herzog CA, Li S, Weinhandl ED, Strief JW, Collins AJ, Gilbertson<br />
DT. Survival <strong>of</strong> dialysis patients after cardiac arrest and the<br />
impact <strong>of</strong> implantable cardioverter defibrillators. Kidney Int 2005<br />
Aug; 68(2): 818–25.<br />
Herzog CA, Mangrum JM, Passman R. Sudden cardiac death<br />
and dialysis patients. Semin Dial. 2008 Jul-Aug; 21(4): 300–7. Epub<br />
2008 Jul 8. Review.<br />
Herzog CA, Strief JW, Collins AJ, Gilbertson DT. Cause-specific<br />
mortality <strong>of</strong> dialysis patients after coronary revascularization: why<br />
don't dialysis patients have better survival after coronary intervention?<br />
Nephrol Dial Transplant. 2008 Aug; 23(8): 2629–33. Epub 2008 Feb 25.<br />
Hollingshead AB, Two Factor Index <strong>of</strong> Social Position, New<br />
Haven CT: privately printed 1957.<br />
Johansen KL, Painter P, Kent-Braun JA, Ng AV, Carey S, da Silva<br />
M, Chertow GM. Validation <strong>of</strong> questionnaires to estimate physical<br />
activity and functioning in end-stage renal disease. Kidney Int<br />
59(3): 1121–1127, 2001.<br />
Kalbfleisch JD, Prentice RL. The statistical analysis <strong>of</strong> failure time<br />
data. New York: Wiley, 1980.<br />
Kaplan EL, Meier P. Nonparametric estimation from incomplete<br />
observation. J Amer Stat Assoc 1958; 3: 457–481.
Levey AS, Berg RL, Gassman JJ, Hall PM, Walker WG. Creatinine<br />
filtration, secretion and excretion during progressive renal disease.<br />
Modification <strong>of</strong> Diet in <strong>Renal</strong> Disease (MDRD) Study Group. Kidney<br />
Int Suppl 1989 Nov 27: S73–80.<br />
Levey AS, Bosch JP, Lewis JB, et al. A more accurate method to<br />
estimate glomerular filtration rate from serum creatinine: a new<br />
prediction equation. Modification <strong>of</strong> Diet in <strong>Renal</strong> Disease Study<br />
Group. Ann Intern Med 1999; 130 (6): 461–70.<br />
Levey AS, Coresh J, Greene T, Stevens LA, Zhang YL, Hendriksen<br />
S, Kusek JW, Van Lente F; Chronic Kidney Disease Epidemiology<br />
Collaboration. Using standardized serum creatinine values<br />
in the modification <strong>of</strong> diet in renal disease study equation for estimating<br />
glomerular filtration rate. Ann Intern Med 2006 Aug 15;<br />
145(4): 247–54.<br />
Liu J, Louis TA, Pan W, Ma JZ, Collins AJ. Methods for estimating<br />
and interpreting provider-specific standardized mortality<br />
ratios. J Health Serv and Outcomes Res Methodology Sept 2003;<br />
4 (3): 135–149.<br />
Liu J, Louis TA, Pan W, Ma JZ, Collins AJ. State-level adjusted<br />
<strong>ESRD</strong> incident rates: use <strong>of</strong> observed versus model-predicted category-specific<br />
rates. Kidney Int. 2006 Apr; 69(8): 1459–63.<br />
Mungoile M, Pickle LW, Simonson KH. Application <strong>of</strong> a weighted<br />
head-banging algorithm to mortality data maps. Statistics in Medicine<br />
1999; 18, 3201–3209.<br />
National Committee for Quality Assurance. HEDIS 2008 technical<br />
specifications. Washington DC: National Committee for Quality<br />
Assurance; 2007.<br />
National Kidney Foundation K/DOQI Clinical Practice Guidelines<br />
for Cardiovascular Disease in Dialysis Patients. AJKD 2005;<br />
45: S1–S154 (Suppl 3).<br />
NHANES Analytic Guidelines. http://www.cdc.gov/nchs/data/<br />
nhanes/nhanes_general_guidelines_june_04.pdf.<br />
Pickle LW, Mungiole M, Jones GK, White AA. <strong>Atlas</strong> <strong>of</strong> <strong>United</strong><br />
<strong>States</strong> Mortality. Hyattsville (MD): National Center for Health Statistics;<br />
1996.<br />
Pickle LW, White AA. Effects <strong>of</strong> the choice <strong>of</strong> age-adjustment<br />
method on maps <strong>of</strong> death rates. Statistics in Med 1995; 14, 615–627.<br />
Research Triangle Institute (2004). SUDAAN language manual,<br />
Release 9.0 Research Triangle park. NC: Research Triangle Institute.<br />
SAS Institute Inc. SAS system for mixed models, Cary (NC): SAS<br />
Institute Inc.; 1996.<br />
SAS Institute Inc. SAS/ETS User’s Guide. Cary (NC): SAS Institute<br />
Inc.; 1993.<br />
Schwartz GJ, et al. A simple estimate <strong>of</strong> glomerular filtration<br />
rate in children derived from body length and plasma creatinine.<br />
Pediatrics. 1976 Aug; 58(2): 259–63<br />
Singh AK, Szczech L, Tang KL, Barnhart H, Sapp S, Wolfson M,<br />
Reddan D; CHOIR Investigators. Correction <strong>of</strong> anemia with epoetin<br />
alfa in chronic kidney disease. N Engl J Med 2006, Nov 16;<br />
355 (20): 2085–98.<br />
Stevens LA, Coresh J, Schmid CH, Feldman HI, Froissart M, Kusek<br />
J, Rossert J, Van LF, Bruce RD, III, Zhang YL, Greene T, Levey AS:<br />
Estimating GFR using serum cystatin C alone and in combination<br />
with serum creatinine: a pooled analysis <strong>of</strong> 3,418 individuals with<br />
CKD. Am J Kidney Dis 51: 395–406, 2008.<br />
Tonelli M, Wiebe N, Culleton B, House A, Rabbat C, Fok M,<br />
McAlister F, Garg AX. Chronic kidney disease and mortality risk:<br />
a systematic review. J Am Soc Nephrol. 2006 Jul; 17 (7): 2034–47..<br />
Waller LA, Carlin BP, Xia H, Gelfand AE. Hierarchical spatio-temporal<br />
mapping <strong>of</strong> disease rates. J Amer Stat Assoc 1997; 92, 607–617.<br />
Wanner C, Krane V, März W, Olschewski M, Mann JF, Ruf G,<br />
Ritz E; German Diabetes and Dialysis Study Investigators. Atorvastatin<br />
in patients with type 2 diabetes mellitus undergoing hemodialysis.<br />
N Engl J Med. 2005 Jul 21; 353(3): 238–48.<br />
Xue JL, Ma J, Louis TA, Collins AJ. Forecast <strong>of</strong> the number <strong>of</strong><br />
patients with end-stage renal disease in the <strong>United</strong> <strong>States</strong> to the<br />
year 2010. J Am Soc Nephrol 2001; 12:2753–2758.<br />
Bibliography<br />
4 APPENDIx A: ANAlyTICAl METHODS<br />
<strong>2009</strong> USRDS Annual <strong>Data</strong> Report<br />
Vol 2<br />
esrd<br />
5<br />
App A<br />
pg 387
5<br />
App B<br />
pg 388<br />
Products and services provided by the <strong>United</strong> <strong>States</strong><br />
<strong>Renal</strong> <strong>Data</strong> <strong>System</strong> to support the work <strong>of</strong> the renal<br />
community are detailed in Table b.a. Th e entire<br />
<strong>ADR</strong> is available at www.usrds.org, with Power-<br />
Point slides <strong>of</strong> all fi gures and Excel fi les <strong>of</strong> the data<br />
behind the graphs; included as well are PDF fi les <strong>of</strong> the Researcher’s<br />
Guide. Th e site’s RenDER system allows users to create customized<br />
data sets and regional maps. <strong>Data</strong> on website use are presented<br />
in Figure b.1.<br />
<strong>Data</strong> requests<br />
Making information on <strong>ESRD</strong> available to the renal community<br />
is a primary objective <strong>of</strong> the USRDS, and we are committed to<br />
the timely fulfi llment <strong>of</strong> data requests. In many cases requests<br />
can be answered through data published in the <strong>ADR</strong> or elsewhere.<br />
Requests for data not available in material published by the USRDS,<br />
but that require two hours or less <strong>of</strong> staff time, are fulfi lled by the<br />
Coordinating Center without charge, usually within one week.<br />
More complex requests — requiring more than two hours <strong>of</strong> staff<br />
time — as well as requests for Standard Analysis Files and custom<br />
fi les, must be accompanied by a written proposal (see details<br />
below), and will be completed only upon written approval by the<br />
NIDDK Project Offi cer.<br />
Research files<br />
Th e Coordinating Center maintains a set <strong>of</strong> Standard Analysis Files<br />
(SAFs) to meet diverse research needs and provide easy access to data<br />
used in the <strong>ADR</strong>. Th e SAFs were introduced in 1994, as the NIDDK<br />
began awarding new grants focusing on research using the USRDS<br />
data. Th e result has been an annual increase in the number <strong>of</strong> fi les<br />
provided by the USRDS.<br />
Prior to 1994, all researcher fi les were created for specifi c projects.<br />
Since the introduction <strong>of</strong> the SAFs, however, custom fi les are<br />
generally limited to cases in which a researcher provides a patient<br />
fi nder fi le to be matched with the USRDS database. For more information<br />
on merged data requests, please contact the Coordinating<br />
Center at usrds@usrds.org.<br />
Th e three-CD Core SAF set contains basic patient data, and is<br />
needed to use any <strong>of</strong> the other SAFs. Included are each patient’s<br />
demographic information, payor and treatment history, limited<br />
transplant data, provider data, and all data from the USRDS Special<br />
Studies. Approximately half <strong>of</strong> the researchers using the USRDS<br />
SAFs need only this CD set. Full transplant information is provided<br />
on a separate CD that contains detailed transplant and transplant<br />
follow-up data collected by CMS and UNOS. <strong>Data</strong> on hospital inpatient<br />
stays are found on the hospitalization CD. All Medicare billing<br />
data are available by individual year (see Table b.c).<br />
Standard Analysis Files (SAFs)<br />
SAF use is governed by the USRDS policy on data release for investigator-initiated<br />
research, found later in these appendices. Research<br />
proposals must be approved by a USRDS Project Offi cer, and researchers<br />
must sign the USRDS “Agreement for Release <strong>of</strong> <strong>Data</strong>,” on the<br />
same page. File prices are listed in Table b.c.<br />
Most SAFs provide patient-specifi c data. All patient identifi ers are<br />
removed or encrypted, but data confi dentiality remains a serious concern.<br />
Th e USRDS “Agreement for Release <strong>of</strong> <strong>Data</strong>” describes restrictions<br />
on SAF use and disposition. Th e SAFs include an encrypted<br />
ID number to allow patient data from multiple SAFs to be merged.<br />
CORE CDS<br />
Th e Core Standard Analysis File CDs contain the most frequently<br />
used SAFs, including those from the Special Studies, and are needed<br />
for use <strong>of</strong> the Transplant and Hospital CDs, or any CD based on Medicare<br />
claims data. Included fi les are as follows (also listed in Table b.b).<br />
Patient Contains one record per patient in the USRDS database,<br />
and gives basic demographic and <strong>ESRD</strong>-related data.<br />
Residence A longitudinal record, to ZIP code, <strong>of</strong> residence.<br />
Payor History Contains a new record for each patient at each<br />
change in insurance payor.<br />
Treatment History Modality Sequence Contains a new record for<br />
each patient at each change in modality or dialysis provider.<br />
Medical Evidence Contains full data from the 1995 version <strong>of</strong> the<br />
CMS Medical Evidence form. In April 1995 a new version <strong>of</strong> the form<br />
went into use, with data on comorbidity, employment status, lab<br />
values at initiation, and Hispanic ethnicity.<br />
Transplant Contains basic data for all transplants (reported by<br />
CMS and UNOS), including the date <strong>of</strong> graft failure (detailed transplant<br />
data are contained on a separate transplant CD).<br />
Transplant Wait List Beginning with 2001 data (used in the 2002<br />
<strong>ADR</strong>), this CD has been updated to include basic patient demographic<br />
data and, from UNOS, all unique wait-list periods for each dialysis<br />
patient.<br />
Facility Conducted annually, the CMS End-Stage <strong>Renal</strong> Disease<br />
Facility Survey is the source <strong>of</strong> data for the Facility SAF, which can<br />
be linked to the Facility Cost Report fi les using the USRDS provider<br />
ID. Geographic variables that could identify facilities are deleted.<br />
Th e survey period is January 1 through December 31.<br />
Facility Cost Reports CMS hospital and independent facility cost<br />
reports for 1989–1995 and 1989–1993, respectively, are available as<br />
SAFs. All geographic variables are deleted to ensure confi dentiality.<br />
Th e fi les may be linked to the Facility SAF using the USRDS provider<br />
ID, though analyses at less than a regional or network level are not<br />
possible. Because these fi les are rarely used, additional data will be<br />
added only if there is suffi cient demand.
Dialyzers Th e Case Mix Severity, Case Mix Adequacy, and DMMS<br />
Special Studies collected information on patient dialyzers. SAFs for<br />
these studies describe the dialyzer through a code, which must be<br />
matched to information in the Dialyzer fi le to fi nd the manufacturer<br />
and model along with characteristics such as membrane type<br />
and clearance. We believe that these data, from published sources<br />
available at the time <strong>of</strong> the study, accurately represent the dialyzer<br />
characteristics, but they should be used with caution.<br />
DATA FROM SPECIAL STUDIES<br />
Topics for USRDS Special Studies are approved by the NIDDK, with<br />
recommendations from CMS, the Scientifi c Advisory Committee,<br />
the <strong>ESRD</strong> networks, and the <strong>Renal</strong> Community Council. Design<br />
and sampling plans are developed, samples are selected, and data<br />
collection forms and instructions are draft ed, tested, and fi nalized.<br />
Th e main studies to date are summarized below, and are detailed<br />
in the Researcher’s Guide.<br />
Dialysis Morbidity & Mortality Study (DMMS) Th e DMMS was a USRDS<br />
Special Study in which data on demographics, comorbidity, laboratory<br />
values, treatment, socioeconomic factors, and insurance<br />
were collected, using dialysis records, for a random sample <strong>of</strong> U.S.<br />
patients. Waves 1, 3, and 4 are historical prospective studies in<br />
which data were collected for patients on in-center hemodialysis<br />
on December 31, 1993. <strong>Data</strong> were abstracted from medical records,<br />
and patients were followed to the earliest <strong>of</strong> data abstraction, death,<br />
transplant, change in modality, or transfer to another facility. Wave<br />
2 is a prospective study <strong>of</strong> incident hemodialysis and peritoneal<br />
dialysis patients for 1996 and early 1997.<br />
Case Mix Adequacy Study <strong>of</strong> Dialysis Th e objectives <strong>of</strong> this USRDS<br />
Special Study were to establish the relationship between the dose<br />
<strong>of</strong> delivered dialysis therapy and mortality, determine the strength<br />
<strong>of</strong> this relationship when data are adjusted for comorbidity, assess<br />
how this relationship changes with dialysis dose, assess how this<br />
relationship is aff ected by dialyzer reuse, and examine the impact<br />
<strong>of</strong> diff erent dialysis membranes on patient morbidity and mortality.<br />
Th e study consisted <strong>of</strong> two groups: an incident sample <strong>of</strong> <strong>ESRD</strong><br />
patients who began hemodialysis in 1990, and a prevalent sample<br />
<strong>of</strong> hemodialysis patients whose <strong>ESRD</strong> began prior to 1990. A total <strong>of</strong><br />
7,096 patients from 523 dialysis units were included, with approximately<br />
3,300 patients having both the pre- and post-BUN values<br />
needed to calculate delivered dialysis dose. Ninety-four percent<br />
<strong>of</strong> these cases were matched to the USRDS database. Th e <strong>ESRD</strong> networks<br />
collected these data in conjunction with their Medical Case<br />
Review data abstraction.<br />
Case Mix Severity Study For this USRDS Special Study, data were<br />
collected on 5,255 patients incident in 1986–87 at 328 dialysis units<br />
nationwide. Objectives were to estimate the correlation <strong>of</strong> comorbidity<br />
and other factors existing at the onset <strong>of</strong> <strong>ESRD</strong> to mortality<br />
and hospitalization rates, while adjusting for age, gender, race, and<br />
primary diagnosis; evaluate possible associations <strong>of</strong> these factors<br />
with reported causes <strong>of</strong> death; assess the distribution <strong>of</strong> comorbidity<br />
and other factors among patients on diff erent modalities; and<br />
compare relative mortality rates by treatment modality, adjusting<br />
for comorbid conditions and other factors.<br />
Pediatric Growth & Development Th e objectives <strong>of</strong> the USRDS Pediatric<br />
Growth and Development Study were to establish a baseline<br />
for assessing the relation <strong>of</strong> patient growth and sexual maturation<br />
to modality, and establish a prototype for the ongoing collection<br />
<strong>of</strong> pediatric data. All patients prevalent in 1990 and born<br />
aft er December 31, 1970, were included in the study, a total <strong>of</strong> 3,067<br />
patients at 548 units.<br />
CAPD & Peritonitis Study Th e USRDS CAPD and Peritonitis Study<br />
examined the relation <strong>of</strong> peritonitis episodes in CAPD patients to<br />
connection device technology and other factors. Th e study population<br />
included all patients newly starting CAPD in the fi rst six months<br />
<strong>of</strong> 1989, a maximum <strong>of</strong> 14 patients per dialysis unit. All units providing<br />
CAPD training participated in the study. Th e sample contains<br />
data on 3,385 patients from 706 units.<br />
TRANSPLANT CDS<br />
Due to changes in data collection sources over the years, data related<br />
to transplants are now presented in eight separate SAFs. Th e fi rst two<br />
are included on the Core CD, and the remaining six are included on<br />
two separate Transplant CDs.<br />
4 TX includes minimum details on all transplants from all sources<br />
4 TXWAIT contains one record for each patient in the USRDS<br />
database per wait list event<br />
4 TXHCFA includes transplant information collected by CMS’s<br />
PMMIS system prior to 1994<br />
4 TXUNOS includes transplant information collected since 1987<br />
by UNOS, currently the main source <strong>of</strong> transplant data for<br />
the USRDS<br />
4 TXIRUNOS includes information on immunosuppressive drugs<br />
collected by UNOS at the time <strong>of</strong> transplantation events<br />
4 TXFUHCFA includes transplant follow-up reports collected by<br />
CMS prior to 1994; reports are completed at discharge, six<br />
months, each year post-transplant, and at graft failure<br />
4 TXFUUNOS includes transplant follow-up reports collected by<br />
UNOS since 1988<br />
4 TXIFUNOS includes information on immunosuppressive drugs,<br />
collected by UNOS at follow-up visits<br />
Tables in Reference Sections E and F are produced primarily<br />
from the CMS and UNOS transplant fi les.<br />
In July <strong>of</strong> 1994, CMS and the Health Resources Services Administration<br />
(HRSA) consolidated transplant data into a single collection<br />
by UNOS under its HRSA contract. Expanded transplant data<br />
are shared among HRSA, CMS, and the NIH, and are thus available to<br />
the USRDS. Th is has resulted in the addition <strong>of</strong> data on a substantial<br />
number <strong>of</strong> non-Medicare transplant patients, including children.<br />
CMS and UNOS transplant fi les overlap for 1988–1993, and some<br />
Medical Evidence (ME) forms and institutional claims records<br />
indicate transplants not included in either fi le. To resolve confl icts<br />
among the sources and create the transplant SAF, all UNOS transplants<br />
are fi rst accepted into the fi le, with all pre-1988 CMS transplants<br />
accepted next. CMS transplants from 1988–1993 are then<br />
accepted if there is no transplant in the fi le for that patient within 30<br />
days <strong>of</strong> the CMS transplant (it is common for dates between sources<br />
to diff er by one day). Finally, transplants indicated on the ME form<br />
are accepted if no transplant is listed for the patient within 30 days<br />
<strong>of</strong> the Medical Evidence transplant date.<br />
HOSPITAL CDs<br />
Hospitalization inpatient data are a subset <strong>of</strong> the data in the Institutional<br />
Claims fi le. No payment or cost variables are included on<br />
this two-CD set, which is for researchers who need data on hospital<br />
inpatient stays and on diagnoses and procedures for those stays, but<br />
who do not need payment data.<br />
COMPREHENSIVE DIALYSIS STUDY CD<br />
Th is CD contains data from the Comprehensive Dialysis Study (CDS),<br />
a new USRDS special data collection study to assess rehabilitation/<br />
USRDS products & services<br />
4 APPENDIx B: PRODUCTS & SERVICES<br />
<strong>2009</strong> USRDS Annual <strong>Data</strong> Report<br />
Vol 2<br />
esrd<br />
5<br />
App B<br />
pg 389
5<br />
App B<br />
pg 390<br />
b aii<br />
USRDS products<br />
& services<br />
Reports & guides<br />
Annual <strong>Data</strong> Reports Available from the National Kidney and Urologic<br />
Disease Information Clearinghouse, 3 Information Way, Bethesda, MD<br />
20892-3560; 301.654.4415, nkudic@info.niddk.nih.gov. <strong>ADR</strong> material is<br />
also published in the American Journal <strong>of</strong> Kidney Diseases.<br />
Annual <strong>Data</strong> Report CD Contains the text and graphics <strong>of</strong> the <strong>ADR</strong>,<br />
data tables, PowerPoint slides, and the Researcher’s Guide.<br />
Researcher’s Guide to the USRDS database<br />
Provides a detailed description <strong>of</strong> the USRDS database and <strong>of</strong> the USRDS<br />
Standard Analysis Files; the basic reference for researchers who use<br />
USRDS data fi les.<br />
www.usrds.org<br />
Contains PDF fi les <strong>of</strong> the chapters, reference tables, and the Researcher’s<br />
Guide; PowerPoint slides <strong>of</strong> atlas fi gures and USRDS conference presentations;<br />
Excel fi les <strong>of</strong> the data tables; notices regarding current news and<br />
analyses; links to related Internet sites; and email addresses for contacting<br />
the USRDS.<br />
RenDER<br />
The USRDS <strong>Renal</strong> <strong>Data</strong> Extraction and Referencing (RenDER) <strong>System</strong> is a<br />
querying application that allows users to create data tables and interactive<br />
maps . It can be accessed at www.usrds.org/odr/xrender_home.asp<br />
following a short registration; a tutorial is also available on this site to<br />
help new users.<br />
Requests for data<br />
<strong>Data</strong> requests: two-hour Questions and data requests that are not<br />
answered directly by the <strong>ADR</strong> can be addressed to the Coordinating<br />
Center; those that require less than two hours <strong>of</strong> staff time to fulfi ll will<br />
be processed without charge.<br />
<strong>Data</strong> requests: more than two hours Questions and data requests that<br />
require over two hours <strong>of</strong> staff time must be submitted in writing and<br />
approved by the NIDDK Project Offi cer. Fulfi llment <strong>of</strong> these requests<br />
is subject to staff availability, and costs are assessed on a case-by-case<br />
basis.<br />
Standard Analysis Files SAFs provide patient-specifi c data from<br />
the USRDS to support <strong>ESRD</strong> research. A standard price list has been<br />
established for the fi les (Table b.c), and users must sign a <strong>Data</strong> Release<br />
Agreement with the NIDDK.<br />
Custom data fi les Custom fi les can be created by the Coordinating Center<br />
for projects requiring data other than those provided in the Standard<br />
Analysis Files. An hourly rate <strong>of</strong> $119.57 will be assessed for time spent<br />
on the request, and users must sign a data release agreement with the<br />
NIDDK.<br />
Publications & presentations<br />
Most USRDS research studies result in published papers or presentations<br />
at national meetings. Figures from abstracts and presentations can<br />
be found on the website, while published abstracts and papers can be<br />
found in the relevant journals.<br />
Contact information<br />
<strong>Data</strong> requests & publication orders USRDS Coordinating Center<br />
914 South 8th Street, Suite S-206<br />
Minneapolis, MN 55404<br />
612.347.7776 or 1.888.99USRDS<br />
Fax 612.347.5878<br />
usrds@usrds.org<br />
<strong>Data</strong> fi le contacts Shu-Cheng Chen, MS; schen@usrds.org<br />
Beth Forrest, BBA; bforrest@usrds.org<br />
b bii<br />
Contents <strong>of</strong> the USRDS Core<br />
Standard Analysis CD-ROM<br />
File name unit <strong>of</strong> observation & uses • This two-CD set is needed in<br />
order to use any <strong>of</strong> the other Standard Analysis Files.<br />
Patient one record for each <strong>ESRD</strong> patient • Incidence, prevalence, patient<br />
survival. Most other fi les will need to be linked to this fi le using the<br />
encrypted patient ID.<br />
Residence for each patient, one record for each period in a diff erent<br />
residence • Regional analyses.<br />
Treatment History one record for each period a patient is on one<br />
modality • Modality distribution and treatment patterns.<br />
Payor History one record for each period a patient is covered by one<br />
payor; each patient can have many records • The impact <strong>of</strong> insurance<br />
payors on clinical outcomes.<br />
Medical Evidence one record for each 2728 form fi led (1995 version) •<br />
<strong>ESRD</strong> fi rst service date, initial treatment modality, comorbid conditions,<br />
patient status at start <strong>of</strong> <strong>ESRD</strong>.<br />
Transplant one record for each transplant event; patients can have<br />
multiple events • Transplant and transplant outcome analyses.<br />
Transplant Wait List one or more records for each patient ever on<br />
list • Comparison <strong>of</strong> transplanted patients to dialysis patients who are<br />
transplant candidates. Patient selection to wait list.<br />
Dialysis Morbidity and Mortality (DMMS; Special Study)<br />
Wave 1: 5,670 patients; Wave 2: 4,024 patients; Wave 3: 11,142 patients<br />
Comorbid conditions, adequacy <strong>of</strong> dialysis, dialysis prescription and<br />
other treatment parameters, laboratory test values, nutrition, vascular<br />
access.<br />
Case Mix Adequacy (Special Study) 7,096 patients • Comorbid conditions,<br />
adequacy <strong>of</strong> dialysis, dialysis prescription and other treatment<br />
parameters, laboratory values.<br />
Case Mix Severity (Special Study) 5,255 patients • Comorbid conditions,<br />
adequacy <strong>of</strong> dialysis, dialysis prescription and other treatment<br />
parameters, laboratory values.<br />
Pediatric Growth and Development (Special Study) 3,067<br />
patients • Growth, development, and other issues relating to pediatric<br />
<strong>ESRD</strong> patients.<br />
CAPD Peritonitis (Special Study) 3,385 patients • CAPD and peritonitis.<br />
Facility one record for each year facility has operated • Merge with<br />
the treatment history, transplant, or annual summary SAFs for analyses<br />
involving provider characteristics by encrypted ID.<br />
Facility Cost Reports one record per facility per year (1989–1995) •<br />
Costs and staffi ng <strong>of</strong> dialysis facilities.<br />
Dialyzers information on dialyzer characteristics; to be matched to<br />
patient dialyzer information in other fi les on CD • Relation <strong>of</strong> dialyzer<br />
characteristics to patient outcomes.<br />
CLMCODES one record for each diagnosis, procedure, or HCPCS code<br />
appearing in claims fi les • Frequency <strong>of</strong> occurrence <strong>of</strong> each code. A<br />
starting point for analyses that will use diagnosis and procedure codes.<br />
Formats.SC2 all USRDS-defi ned SAS formats used by SAFs • Format<br />
library used to format values <strong>of</strong> categorical variables.
quality <strong>of</strong> life and nutrition issues in incident dialysis patients. Th e<br />
study was conducted between 2005 and 2008. All 1,677 participants<br />
answered questions on physical activity level, health-related quality<br />
<strong>of</strong> life, and work/disability status during the fi rst six months <strong>of</strong><br />
aft er the initiation <strong>of</strong> <strong>ESRD</strong> therapy. In a subset <strong>of</strong> 400 participants,<br />
dietary intake and nutritional status were also assessed.<br />
DIALYSIS MORBIDITY & MORTALITY CLAIMS CD<br />
Th is CD contains fi les from the Dialysis Morbidity and Mortality<br />
Study, with data extracted from all CMS Medicare payment data<br />
for the study patients. <strong>Data</strong> are followed to the currently reported<br />
claims year.<br />
CASE MIX ADEQUACY CLAIMS CD<br />
Th is CD contains the Case Mix Adequacy Special Study fi le, and<br />
extracts data for the study patients from all CMS Medicare payment<br />
data. Medicare payment data for these patients are followed to the<br />
currently reported claims year. Th is fi le is useful for developing<br />
analyses to be run on full Medicare payment fi les.<br />
MEDICARE PAYMENT DATA CDs<br />
Medicare payment data on institutional claims are available for<br />
pre-1989 through 2007, while data on physician/supplier claims<br />
are available for 1991–2007. Th e 2007 claims will be available, along<br />
with other updated USRDS SAF CDs, by the end <strong>of</strong> <strong>2009</strong>.<br />
Institutional claims consist <strong>of</strong> all inpatient/outpatient claims<br />
(inpatient, outpatient, skilled nursing facility, home health agency,<br />
and hospice), including outpatient dialysis claims. Physician/supplier<br />
claims account for 80 percent <strong>of</strong> claims but only 20 percent<br />
<strong>of</strong> dollars. Th e structure and content <strong>of</strong> the two types <strong>of</strong> claims<br />
diff er, as do the fi les derived from them. Institutional claims are<br />
provided in two types <strong>of</strong> fi les: the Institutional Claims fi le, indicating<br />
claim type, dollar amounts, DRG code, type <strong>of</strong> dialysis involved<br />
(if any), and dates <strong>of</strong> service; and the Institutional Claims Detail<br />
fi le, containing details such as diagnosis and procedure codes.<br />
Many analyses require only the Institutional Claims fi les. Physician/supplier<br />
claims are contained in one type <strong>of</strong> fi le with one<br />
record for each claim line-item. Th e fi le includes dollar amounts,<br />
dates <strong>of</strong> service, diagnosis and procedure codes, and type and<br />
place <strong>of</strong> service.<br />
CLINICAL PERFORMANCE MEASURES SURVEY CDs<br />
Th e Clinical Performance Measures (CPM) data is a CMS project<br />
developed to collect information on the quality <strong>of</strong> care provided<br />
to the dialysis population. Th e data originates from yearly surveys<br />
b 1ii<br />
120<br />
100<br />
80<br />
60<br />
40<br />
20<br />
USRDS data requests<br />
& website visits<br />
<strong>Data</strong><br />
requests,<br />
by<br />
month<br />
0<br />
1/00 1/01 1/02 1/03 1/04 1/05 1/06 1/07 1/08 1/09<br />
<strong>of</strong> approximately 10,000 patients completed by the primary care<br />
facilities, and was formerly known as the <strong>ESRD</strong> Core Indicators<br />
Project. Th is project results in a rich source <strong>of</strong> detailed information,<br />
useful in analyses <strong>of</strong> healthcare delivery in a sample <strong>of</strong> the<br />
dialysis population.<br />
To further expand the value and use <strong>of</strong> the CPM data, we have<br />
linked patient data from the USRDS SAFs, enabling complete claims<br />
extraction from the SAFs for all identifi ed patients. Th e resulting<br />
claims history has been combined with the CPM data to form a<br />
complete mini-set <strong>of</strong> the USRDS data products with supporting fi les.<br />
Th is enables researchers to add patient-level laboratory and dialysis<br />
prescription detail to a broad range <strong>of</strong> healthcare service event<br />
data over many years.<br />
Th e USRDS Coordinating Center has made the CPM data available<br />
as SAFs. Th e dataset contains CPM data collected in surveys from<br />
1994–2007. A listing <strong>of</strong> available fi les and the corresponding costs<br />
can be found in Table b.e, or you may contact the USRDS Coordinating<br />
Center for further information.<br />
DISEASE-BASED COHORT CDs & 5 PERCENT<br />
GENERAL MEDICARE PAYMENT DATA CDs<br />
Three disease-based cohort CD sets — for CKD, diabetes, and<br />
CHF — are built from the 5 percent general Medicare Claims SAFs.<br />
Each CD contains a patient master fi le, a payor sequence fi le, and a<br />
set <strong>of</strong> comorbidity fi les.<br />
Separately, 5 percent general Medicare claims SAFs (inpatinet,<br />
outpatinet, skilled nursing facility, home health, hospice, Part B, and<br />
durable medical equipment) are also available for single or multiple<br />
years from 1992 to 2005. <strong>Data</strong> are derived from the IP claims SAF<br />
fi les. No payment or cost variables are included, so these data are for<br />
researchers who need data on hospital inpatient stays and on diagnoses<br />
and procedures for those stays, but do not need payment data.<br />
PRE-<strong>ESRD</strong> MEDICARE CLAIMS CDs<br />
Th e pre-<strong>ESRD</strong> claims (also known as the back-casted claims) are a<br />
collection <strong>of</strong> Medicare institutional and physician/supplier (Part<br />
B, durable medical equipment) billing records incurred prior to<br />
the onset <strong>of</strong> <strong>ESRD</strong>. Included in these claims are any and all claims<br />
available from Medicare for incident patients during their incident<br />
year and the two prior calendar years.<br />
Th e USRDS has made the pre-<strong>ESRD</strong> data available as SAFs. Th is<br />
dataset includes Medicare claims <strong>of</strong> <strong>ESRD</strong> patients from incident<br />
years 1995–2005. Th e structure <strong>of</strong> the claims fi le is identical to the<br />
<strong>ESRD</strong> claims fi les and organized by calendar year. In addition, a<br />
pre-<strong>ESRD</strong> payor sequence is provided so researchers can determine<br />
Website<br />
visits,<br />
by<br />
month<br />
18,000<br />
15,000<br />
12,000<br />
9,000<br />
6,000<br />
3,000<br />
0<br />
1/00 1/01 1/02 1/03 1/04 1/05 1/06 1/07 1/08 1/09<br />
USRDS products & services<br />
4 APPENDIx B: PRODUCTS & SERVICES<br />
<strong>2009</strong> USRDS Annual <strong>Data</strong> Report<br />
Vol 2<br />
esrd<br />
5<br />
App B<br />
pg 391
5<br />
App B<br />
pg 392<br />
b cii<br />
Standard Analysis Files<br />
CD description Files Price ^<br />
Core CD 4 $1,150 The Core CD is needed in order to use the other CDs.<br />
Transplant CD 2 $300 Detailed transplant data from CMS and UNOS.<br />
Hospital CD 2 $300 The Hospital CD is derived from the Institutional Claims<br />
and Institutional Claims Details CDs. It contains diagnosis<br />
and surgical procedure codes for each stay but does not<br />
include the cost data from the Institutional Claims records.<br />
CDS survey CD TBD Survey information and laboratory values from the<br />
Comprehensive Dialysis Survey<br />
DMMS claims CD set 4 $500 The DMMS claims CD set contains all <strong>of</strong> the Institutional<br />
and Physician/Supplier claims data for the patients in the<br />
USRDS Dialysis Morbidity and Mortality (DMMS) Special<br />
Study. The data from the Special Study data collection<br />
forms are included on the Core CD.<br />
Case Mix Adequacy CD 1 $125 The Case Mix Adequacy Claims claims CD contains all institutional<br />
and physician/supplier claims data for patients in<br />
the USRDS Case Mix Adequacy Special Study. <strong>Data</strong> from<br />
the Special Study data collection forms are included.<br />
Medicare payment data<br />
b dii<br />
Prices for the USRDS Standard Analysis Files (checks must be<br />
made payable to the Minneapolis Medical Research Foundation)<br />
Institutional claims Physician/supplier claims<br />
Claims CDs Details CDs Price CDs Price<br />
pre-1989* 1 1 $250<br />
1989 1 1 $250<br />
1990 1 1 $250<br />
1991 1 2 $375 4 $500<br />
1992 1 2 $375 4 $500<br />
1993 1 2 $375 4 $500<br />
1994 1 2 $375 5 $625<br />
1995 1 3 $500 5 $625<br />
1996 1 3 $500 6 $750<br />
1997 1 3 $500 7 $875<br />
1998 1 3 $500 7 $875<br />
1999 1 3 $500 7 $875<br />
2000 1 5 $750 7 $875<br />
2001 1 6 $875 7 $875<br />
2002 1 6 $875 8 $1,000<br />
2003 1 7 $1,000 9 $1,125<br />
2004 1 8 $1,125 9 $1,125<br />
2005 1 9 $1,250 10 $1,250<br />
2006 1 9 $1,250 10 $1,250<br />
2007 1 13 $1,750 11 $1,375<br />
Pre-<strong>ESRD</strong> claims available for 1993 to 2007; price ranges $200–600/per year and claim type.<br />
Prices subject to change.<br />
A data request applies only to the project<br />
stated in the proposal; a new proposal must be<br />
submitted for each additional use <strong>of</strong> the data<br />
I Research topic title and submission date.<br />
II Background information.<br />
III Study design: objectives, hypothesis(es),<br />
analytical methods.<br />
IV <strong>Data</strong> being requested: 1) List <strong>of</strong> Standard<br />
Analysis Files needed (if multiple years,<br />
please specify), or fi elds needed in<br />
custom data fi le. 2) Description <strong>of</strong> data<br />
security: responsible party, computer<br />
access, etc. 3) Time frame for the project.<br />
4) Statement that data will be returned<br />
to the USRDS or destroyed at the end <strong>of</strong><br />
the project.<br />
V To address patient privacy issues, to be<br />
consistent with HIPAA policies, and to<br />
insure that researchers are adhering<br />
to local privacy standards as well as to<br />
USRDS and CMS privacy policies, the<br />
USRDS now requires IRB approval for all<br />
research proposals. IRB approval is not<br />
required from those requesting aggregate<br />
data.<br />
VI Outline <strong>of</strong> estimated costs <strong>of</strong> requested<br />
data; source <strong>of</strong> funding.<br />
VII Agreement for Release <strong>of</strong> <strong>Data</strong>, signed<br />
by all researchers.<br />
VIII Investigator information. For Principal<br />
Investigator and co-authors, supply:<br />
Name<br />
Affi liation<br />
Business address<br />
Business phone & fax<br />
Email address<br />
Submit to<br />
Paul Eggers, PhD<br />
NIDDK<br />
6707 Democracy Blvd, Room 615<br />
Bethesda, MD 20892-5458<br />
Phone 301.594.8305<br />
Fax 301.480.3510<br />
eggersp@extra.niddk.nih.gov<br />
Prices for the 5 percent Medicare Sample Standard Analysis File CD-ROMs ( checks must be made payable to the Minneapolis Medical Research Foundation)<br />
b dii<br />
Outline for research<br />
proposals using USRDS data<br />
Chronic kidney disease Diabetes CHF<br />
Pt cohort fi nder $750/Hospital fi le $250 Pt cohort fi nder $750/Hospital fi le $250 Pt cohort fi nder $750/Hospital fi le $250<br />
Institutional Physician/supplier Institutional Physician/supplier Institutional Physician/supplier<br />
Claims CDs Details CDs Price CDs Price Claims CDs Details CDs Price CDs Price Claims CDs Details CDs Price CDs Price<br />
1992 1 2 $375 3 $375 1 2 $375 4 $500 1 2 $375 5 $625<br />
1993 1 2 $375 3 $375 1 2 $375 4 $500 1 3 $500 5 $625<br />
1994 1 2 $375 3 $375 1 2 $375 4 $500 1 3 $500 5 $625<br />
1995 1 2 $375 3 $375 1 3 $500 5 $625 1 3 $500 5 $625<br />
1996 1 2 $375 4 $500 1 3 $500 5 $625 1 3 $500 6 $750<br />
1997 1 2 $375 4 $500 1 3 $500 5 $625 1 3 $500 6 $750<br />
1998 1 2 $375 4 $500 1 3 $500 5 $625 1 4 $625 6 $750<br />
1999 1 3 $500 4 $500 1 3 $500 5 $625 1 4 $625 6 $750<br />
2000 1 3 $500 4 $500 1 3 $500 5 $625 1 4 $625 6 $750<br />
2001 1 3 $500 4 $500 1 4 $625 6 $750 1 4 $625 6 $750<br />
2002 1 3 $500 4 $500 1 4 $625 6 $750 1 4 $625 6 $750<br />
2003 1 3 $500 4 $500 1 4 $625 6 $750 1 4 $625 6 $750<br />
2004 1 3 $500 4 $500 1 4 $625 7 $875 1 4 $625 6 $750<br />
2005 1 4 $625 5 $625 1 5 $750 7 $875 1 5 $750 7 $875<br />
2006 1 5 $750 5 $625 1 5 $750 8 $1,000 1 5 $750 7 $875<br />
2007 1 6 $875 5 $625 1 6 $875 8 $1,000 1 5 $750 7 $875
Medicare enrollment for the periods prior to fi rst <strong>ESRD</strong> service date.<br />
A listing <strong>of</strong> available fi les and the corresponding costs can be found<br />
in Table b.e.<br />
FILE MEDIA & FORMATS<br />
SAFs are provided on CDs and DVDs as SAS fi les, and can be used<br />
by SAS on any 486 or Pentium PC with a CD/DVD reader. Th e SAS<br />
format is widely used, easily transported, and largely self-documenting.<br />
SAS is a commercially available data management and<br />
statistical analysis s<strong>of</strong>t ware system that runs on most computers,<br />
and is almost universally available on university computer systems.<br />
Th e SAFs take full advantage <strong>of</strong> the program’s ability to incorporate<br />
detailed documentation into the fi le. Researchers needing another<br />
format or medium must arrange for the conversion.<br />
COSTS<br />
File prices cover fi le reproduction, documentation, administrative<br />
costs, and costs <strong>of</strong> technical support. Prices are subject to change.<br />
DOCUMENTATION<br />
Th e Researcher’s guide to the USRDS database provides most <strong>of</strong> the<br />
SAF documentation. It includes a codebook <strong>of</strong> variables, copies <strong>of</strong><br />
data collection forms used by CMS, UNOS, and the USRDS Special<br />
Studies, and a chapter on using the SAFs in SAS. Th e guide may be<br />
downloaded from the USRDS website, and a copy on CD-ROM will<br />
be sent to researchers with the purchase <strong>of</strong> the SAFs.<br />
<strong>Data</strong> use acknowledgement<br />
Publications using USRDS data should include an acknowledgment<br />
and this notice: Th e data reported here have been supplied by the<br />
<strong>United</strong> <strong>States</strong> <strong>Renal</strong> <strong>Data</strong> <strong>System</strong> (USRDS). Th e interpretation and<br />
reporting <strong>of</strong> these data are the responsibility <strong>of</strong> the author(s) and in<br />
no way should be seen as an <strong>of</strong>fi cial policy or interpretation <strong>of</strong> the<br />
U.S. government.<br />
<strong>Data</strong> release policy<br />
Since the SAFs and custom data fi les contain confi dential, patientspecifi<br />
c data, their release requires the approval process described<br />
here. Investigators may contact the USRDS Project Offi cer (PO) at the<br />
NIDDK to discuss requests before preparing a proposal. To request<br />
and use USRDS data fi les, investigators must provide the PO with a<br />
detailed description <strong>of</strong> the proposed investigation (see Table b.d).<br />
Th e summary must include goals, background data, an in-depth<br />
description <strong>of</strong> study design and methodology, and resources available<br />
for completing the project, and may be the description from a<br />
b eii<br />
Prices for the <strong>ESRD</strong> CPM/USRDS fi les ( checks must be made<br />
payable to the Minneapolis Medical Research Foundation)<br />
<strong>ESRD</strong> CPM Survey data<br />
Includes 1994–2007 pediatric HD survey years, 1995–2007 PD<br />
survey years, & 2000–2007 pediatric HD survey years $1,250<br />
<strong>ESRD</strong> CPM/SAF linked fi les<br />
Core fi les $250<br />
Hospital $150<br />
Transplant $100<br />
DMMS/Case Mix Adequacy claims $100<br />
<strong>ESRD</strong> CPM Medicare participant<br />
Institutional & Physician/Supplier claims<br />
are available for the years pre-1989 through 2004;<br />
$100–300 per year<br />
grant proposal or other application. Th e project must comply with<br />
the Privacy Act <strong>of</strong> 1974, and the summary should provide enough<br />
information to enable assessment <strong>of</strong> compliance. Guidelines for<br />
Privacy Act adherence are found in the “Agreement for Release<br />
<strong>of</strong> <strong>Data</strong>,” later in the appendices. With your completed research<br />
proposal, please include a signed agreement for release <strong>of</strong> information<br />
from each investigator and analyst who will use the data fi les.<br />
Investigators must also indicate needed USRDS SAFs by name.<br />
If these fi les cannot meet requirements <strong>of</strong> the proposed research,<br />
investigators must specify precisely which data elements are needed,<br />
and budget for a substantially higher cost.<br />
Th e investigator and the Coordinating Center (CC) will resolve<br />
any technical questions. Th e investigator will arrange payment<br />
with the CC, and payment must be received before the fi les will be<br />
released. Checks must be made payable to the Minneapolis Medical<br />
Research Foundation.<br />
Th e NIH will review the project for technical merit and for conformity<br />
with the Privacy Act. Th e PO will notify the investigator(s)<br />
in writing <strong>of</strong> the outcome, and if the project is not approved will<br />
discuss reasons for the decision. Th e PO will send a copy <strong>of</strong> the<br />
approval letters to the CC. When payment for the fi les has been<br />
received by the CC, the CC will prepare the fi les and documentation<br />
and send them to the investigator.<br />
Any reports or articles resulting from use <strong>of</strong> USRDS data must be<br />
submitted to the PO prior to submission for publication to assure<br />
adherence to the Privacy Act. Th e PO must respond within 30 days.<br />
If a report or article is determined not to adhere to the Privacy Act,<br />
it shall not be published until compliance is achieved. Assessment<br />
<strong>of</strong> compliance will not depend on the opinions and conclusions<br />
expressed by the investigators, nor will the PO’s approval indicate<br />
government endorsement <strong>of</strong> the investigator’s opinions and conclusions.<br />
All publications using released data must contain the standard<br />
acknowledgement and disclaimer presented above. Investigators<br />
are requested to send copies <strong>of</strong> all fi nal publications resulting from<br />
this research to both the PO and the CC.<br />
Caveats<br />
Th is policy establishes conditions and procedures for the release <strong>of</strong><br />
data from the USRDS, and is intended to ensure that data are made<br />
available to investigators in the pursuit <strong>of</strong> legitimate biomedical,<br />
cost-eff ectiveness, or other economic research.<br />
Th e USRDS will not release data that identify individual patients,<br />
providers, or facilities. Since it might be possible, however, to infer<br />
identity from SAF data, these data are considered confi dential. Th e<br />
USRDS “Agreement for Release <strong>of</strong> <strong>Data</strong>” contains a number <strong>of</strong> general<br />
and specifi c restrictions on the use <strong>of</strong> USRDS data, and investigators<br />
are expected to abide by these restrictions. If individually identifi -<br />
able data are needed, the request should be submitted directly to<br />
CMS. Use <strong>of</strong> these data to identify and/or contact patients, facilities,<br />
or providers is prohibited by USRDS policy and by the Privacy<br />
Act <strong>of</strong> 1974.<br />
Th e USRDS CC will provide data in any <strong>of</strong> the usual media (tape,<br />
disk, or hard copy). Analytical services other than review <strong>of</strong> the<br />
proposal and preparation <strong>of</strong> the data fi le will not be provided under<br />
the USRDS contract, though CC personnel may participate in analyses<br />
funded by other sources.<br />
USRDS products & services<br />
4 APPENDIx B: PRODUCTS & SERVICES<br />
<strong>2009</strong> USRDS Annual <strong>Data</strong> Report<br />
Vol 2<br />
esrd<br />
5<br />
App B<br />
pg 393
5<br />
glossary<br />
pg 394<br />
Acute kidney injury (AKI) Also<br />
known as acute kidney failure or<br />
acute renal failure is a sudden<br />
decline in renal function triggered<br />
by a number <strong>of</strong> acute<br />
occurrances such as shock,<br />
trauma, drug toxicity, or kidney<br />
stones.<br />
Acute myocardial infarction (AMI) An<br />
event causing injury to the heart<br />
muscle.<br />
Adult polycystic kidney disease An inherited<br />
disease in which the kidneys contain<br />
multiple cysts.<br />
Anemia A condition marked by a reduced<br />
number <strong>of</strong> red cells in the<br />
bloodstream.<br />
Angiography A radiographic procedure<br />
where a radio-opaque contrast material<br />
is injected into a blood vessel for<br />
the purpose <strong>of</strong> identifying its anatomy.<br />
Angioplasty A procedure in which a balloon<br />
catheter is inserted into a blocked<br />
or narrowed vessel in order to reopen<br />
the vessel and allow normal blood fl ow.<br />
Angiotensin converting enzyme (ACE) inhibitor<br />
An antihypertensive agent that inhibits<br />
the production <strong>of</strong> angiotensin<br />
II. Can delay progression to diabetes<br />
or kidney disease.<br />
Angiotensin II receptor blocker (ARB) an antihypertensive<br />
agent that inhibits the<br />
actions <strong>of</strong> angiotensin II, a substance<br />
which causes narrowing <strong>of</strong> blood vessels.<br />
Arteriovenous fi stula A type <strong>of</strong> vascular<br />
access used in hemodialysis patients,<br />
and created by the anastomosis <strong>of</strong> the<br />
radial artery and the cephalic vein.<br />
Arteriovenous graft A type <strong>of</strong> vascular access<br />
used in hemodialysis patients and<br />
created via a connection between an<br />
artery and vein using either a native<br />
vessel (saphenous vein) or a synthetic<br />
material such as Tefl on.<br />
Atherosclerotic heart disease (ASHD) A disease<br />
<strong>of</strong> the arteries <strong>of</strong> the heart, characterized<br />
by a thickening and/or loss<br />
<strong>of</strong> elasticity <strong>of</strong> the arterial walls.<br />
Beta blockers Antihypertensive medications<br />
that block production <strong>of</strong> nor-<br />
epinephrine, slowing the heart rate<br />
and preventing the constriction <strong>of</strong><br />
blood vessels.<br />
Blood urea nitrogen (BUN) A by-product<br />
<strong>of</strong> the breakdown <strong>of</strong> amino acids and<br />
endogenous and ingested protein.<br />
Body mass index (BMI) A measure <strong>of</strong><br />
height to weight ratio: weight (kg)/<br />
height (m 2 ).<br />
C-reactive protein A protein produced<br />
by the liver in response to infection or<br />
injury; high levels are associated with<br />
an increased risk <strong>of</strong> heart disease and<br />
stroke.<br />
Calcium channel blockers Antihypertensive<br />
agents that work by blocking the<br />
access <strong>of</strong> calcium to muscle cells in artery<br />
walls.<br />
Cardiac arrest A complete cessation <strong>of</strong><br />
cardiac activity.<br />
Cardiac resynchronization therapy defi brillator<br />
(CRT-D) A device designed to arrest<br />
the fi brillation <strong>of</strong> (heart muscle) by applying<br />
electric shock across the chest,<br />
thus depolarising the heart cells and allowing<br />
normal rhythm to return.<br />
Cardiomyopathy A general diagnostic<br />
term indicating a primary non-infl ammatory<br />
disease <strong>of</strong> the heart muscle.<br />
Catheter A vascular access used in hemodialysis<br />
patients, commonly implanted<br />
into the jugular or subclavian<br />
vein.<br />
Centers for Disease Control & Prevention<br />
(CDC) The lead federal agency for protecting<br />
the health and safety <strong>of</strong> people<br />
at home and abroad; develops and<br />
applies programs designed to improve<br />
the health <strong>of</strong> the people <strong>of</strong> the <strong>United</strong><br />
<strong>States</strong>.<br />
Centers for Medicare and Medicaid Services<br />
(CMS) Formerly the Health Care Financing<br />
Administration (HCFA). Federal<br />
agency that administers the Medicare,<br />
Medicaid, and State Childrens’ Health<br />
insurance programs.<br />
Cerebrovascular accident (CVA) A general<br />
descriptor that encompasses such<br />
problems as stroke and cerebral hemorrhage.<br />
Cerebrovascular disease A disease that<br />
causes narrowing or occlusion <strong>of</strong> the<br />
arteries supplying blood to the brain.<br />
Chain provider A single business entity<br />
that at years end owns or operates<br />
20 or more freestanding dialysis units.<br />
This defi nition applies to all chain affi liation<br />
references in the USRDS Annual<br />
<strong>Data</strong> Reports. An alternative defi nition<br />
from the Centers for Medicare and<br />
Medicaid Services can be found under<br />
“defi nitions” in the Health Care Provider/Supplier<br />
Application Form, CMS 855.<br />
Chronic kidney disease (CKD) A condition<br />
in which there is a progressive loss <strong>of</strong><br />
kidney function which over time may<br />
lead to end-stage renal disease.<br />
Chronic obstructive pulmonary disease (COPD)<br />
A progressive disease characterized<br />
by coughing, wheezing, or diffi culty<br />
in breathing.<br />
Clinical Performance Measures (CPM) Project<br />
Formerly the Core Indicator Project.<br />
A project in which CMS and the<br />
<strong>ESRD</strong> networks cooperatively maintain<br />
a clinical database <strong>of</strong> key elements<br />
related to the quality <strong>of</strong> dialysis care.<br />
These elements are used as indicators<br />
in quality improvement initiatives.<br />
Common Working File (CWF) <strong>System</strong> The<br />
Medicare inpatient/outpatient and<br />
physician/supplier benefit coordination<br />
and claims validation system.<br />
Under the CWF, CMS maintains both<br />
institutional and physician supplier<br />
claims-level data. CWF claims records<br />
are the data source for most claims<br />
and utilization fi les used by the USRDS.<br />
Comprehensive Dialysis Study (CDS) A special<br />
data collection study that focuses<br />
on physical activity level, health-related<br />
quality <strong>of</strong> life, and work/disability<br />
status reported by patients who have<br />
recently started maintenance dialysis.<br />
Congestive heart failure (CHF) A condition<br />
caused by ineff ective pumping <strong>of</strong> the<br />
heart and subsequent fl uid accumulation<br />
in the lungs.<br />
Continuous ambulatory peritoneal dialysis<br />
(CAPD) A type <strong>of</strong> dialysis in which dialysate<br />
is continuously present in the abdominal<br />
cavity. Fluid is exchanged by<br />
using gravity to fi ll and empty the cavity<br />
4–5 -times each day.<br />
Continuous cycler-assisted peritoneal dialysis<br />
(CCPD) A type <strong>of</strong> dialysis in which the<br />
abdominal cavity is fi lled and emptied<br />
<strong>of</strong> dialysate using an automated cycler<br />
machine.<br />
Creatinine A waste product <strong>of</strong> protein<br />
metabolism found in the urine; <strong>of</strong>ten<br />
used to evaluate kidney function.<br />
Abnormally high creatinine levels indicate<br />
kidney failure or renal insuffi -<br />
ciency.<br />
Creatinine clearance Used as an indicator<br />
to predict the onset <strong>of</strong> uremia, which<br />
develops when creatinine clearance<br />
falls below 10 ml/minute/1.73 m 2 .<br />
Darbepoetin alfa (DPO) One <strong>of</strong> a class <strong>of</strong><br />
medications called erythropoietic proteins.<br />
Used to treat anemia in patient<br />
with serious kidney disease.<br />
Death Notifi cation Form (CMS-2746) A form<br />
submitted following the death <strong>of</strong> an<br />
<strong>ESRD</strong> patient, and containing basic patient<br />
demographic information in addition<br />
to information on the primary<br />
cause <strong>of</strong> death.<br />
Diabetes mellitus, insulin-dependent A condition<br />
in which insulin is necessary to<br />
regulate abnormally high levels <strong>of</strong> glucose<br />
(sugar) in the blood.<br />
Diagnosis Related Groups (DRGs) Used by<br />
Medicare to determine payment for inpatient<br />
hospital stays; based on diagnosis,<br />
age, gender, and complications.<br />
Employer group health plan (EGHP) A health<br />
plan <strong>of</strong> or contributed to by an employer,<br />
providing medical care directly or<br />
through other methods such as insurance<br />
or reimbursement to current or<br />
former employees, or to these employees<br />
and their families.<br />
End-stage renal disease (<strong>ESRD</strong>) A condition<br />
in which a person’s kidney function is<br />
inadequate to support life.<br />
Erythropoiesis stimulating agent (ESA)<br />
Used to increase the production <strong>of</strong><br />
red blood cells; includes erythropoietin<br />
(EPO) and darbepoetin alfa (DPO).<br />
Erythropoietin (EPO) A hormone secreted<br />
chiefl y by the adult kidney; acts on<br />
bone marrow to stimulate red cell production.<br />
Also produced in a formulated<br />
version to treat anemia.
<strong>ESRD</strong> Facility Survey <strong>Data</strong> for this survey<br />
are collected annually by CMS from<br />
all facilities certifi ed to provide Medicare-covered<br />
renal dialysis and transplantation.<br />
The survey uses CMS form<br />
2744, and encompasses the full calendar<br />
year. Geographic data are included<br />
to the level <strong>of</strong> facility ZIP code. Each record<br />
contains facility information and<br />
data on the number <strong>of</strong> patients served,<br />
dialysis treatments provided, and kidney<br />
transplants performed. The data<br />
include services to both Medicare and<br />
non-Medicare patients.<br />
<strong>ESRD</strong> networks Regional organizations,<br />
established by law in 1978, contracted<br />
by CMS to perform quality oversight<br />
activities to assure the appropriateness<br />
<strong>of</strong> services and protection for dialysis<br />
patients.<br />
Expanded criteria donors (ECDs) Older kidney<br />
donors or donors whose health<br />
issues in the past would have prevented<br />
their acceptance into the donor<br />
program.<br />
Glomerular fi ltration rate (eGFR) Estimated<br />
rate in ml/min/1.73 m 2 <strong>of</strong> the volume<br />
<strong>of</strong> plasma fi ltered by the kidney. Rates<br />
<strong>of</strong> fi ltration are based on an individual’s<br />
age, gender, and height, and on<br />
levels <strong>of</strong> serum creatinine, blood urea<br />
nitrogen, and serum albumin. GFR is<br />
traditionally considered the best overall<br />
index to determine renal function.<br />
Glycosylated hemoglobin (HbA1c) test Used<br />
to help determine how well a patient’s<br />
diabetes is being controlled, this test<br />
measures the level <strong>of</strong> glucose-bound<br />
hemoglobin in the bloodstream.<br />
Health Maintenance Organization (HMO)<br />
A competitive medical plan, such as<br />
Medicare+Choice, that has contracts<br />
with CMS on a prospective capitation<br />
payment basis for providing healthcare<br />
to Medicare benefi ciaries.<br />
Health Service Area (HSA) A group <strong>of</strong> counties<br />
described by the authors <strong>of</strong> the<br />
CDC <strong>Atlas</strong> <strong>of</strong> <strong>United</strong> <strong>States</strong> Mortality<br />
as “an area that is relatively self-contained<br />
with respect to hospital care.”<br />
Healthy People 2010 A national agenda for<br />
health promotion and disease prevention,<br />
with objectives and goals aimed<br />
at improving the health <strong>of</strong> the American<br />
people (www.health.gov/healthypeople).<br />
Hemodialysis The process <strong>of</strong> removing<br />
toxins from the blood by diffusion<br />
through a semi-permeable membrane.<br />
Hemoglobin Oxygen-carrying protein in<br />
the erythrocyte (red blood cell).<br />
Hepatitis An infl ammation <strong>of</strong> the liver<br />
that may be caused by a viral infec-<br />
tion, poisons, or the use <strong>of</strong> alcohol or<br />
other drugs. Forms include Hepatitis A,<br />
usually transmitted by contaminated<br />
food or water; Hepatitis B, more serious<br />
than Hepatitis A and transmitted<br />
through blood and body fl uids; Hepatitis<br />
C, also transmitted through blood<br />
and body fl uids; and Hepatitis D, which<br />
causes symptoms only when an individual<br />
is already infected with the Hepatitis<br />
B virus.<br />
Hospital-based facility A dialysis unit attached<br />
to or located in a hospital and<br />
licensed to provide outpatient dialysis<br />
services directly to <strong>ESRD</strong> patients.<br />
Implantable cardioverter defi brillator (ICD)<br />
An implantable device designed to arrest<br />
the fi brillation <strong>of</strong> (heart muscle) by<br />
applying electric shock thus depolarizing<br />
the heart cells and allowing normal<br />
rhythm to return.<br />
Incident <strong>ESRD</strong> patient A patient starting<br />
renal replacement therapy for <strong>ESRD</strong><br />
during a calendar year. Excludes patients<br />
with acute renal failure, those<br />
with chronic renal failure who die<br />
before starting <strong>ESRD</strong> treatment, and<br />
those whose treatments are not reported<br />
to CMS.<br />
Incident population The people in a population<br />
who are newly diagnosed with<br />
a disease in a given time period, typically<br />
a year.<br />
Independent unit A unit licensed to provide<br />
outpatient and home maintenance<br />
dialysis, and not affi liated with<br />
a chain.<br />
Ischemic heart disease (ISHD) A disease <strong>of</strong><br />
the heart evidenced by a lowered oxygen<br />
supply to the heart tissue, caused<br />
by occlusion or narrowing <strong>of</strong> the arteries<br />
supplying the heart muscle.<br />
Kidney Disease Outcomes Quality Initiative<br />
(KDOQI) Established in 1995 by the National<br />
Kidney Foundation to improve<br />
patient outcomes and survival by providing<br />
recommendations for optimal<br />
clinical practices in the areas <strong>of</strong> dialysis<br />
adequacy, vascular access, and anemia.<br />
Kt/V An indicator <strong>of</strong> the dialysis dose<br />
per treatment, calculated by multiplying<br />
the urea clearance (K) by the treatment<br />
duration (t) and dividing by the<br />
urea distribution (V). The urea distribution<br />
volume is approximately equal to<br />
the volume <strong>of</strong> total body water.<br />
Medical Evidence form (CMS-2728) A form<br />
which provides source data about<br />
<strong>ESRD</strong> patients, including information<br />
on demographics, primary cause <strong>of</strong> renal<br />
disease, comorbidity, biochemical<br />
data, dialysis treatment, transplant, dialysis<br />
training, employment status, ini-<br />
tial insurance coverage, and fi rst <strong>ESRD</strong><br />
service date.<br />
Medicare as Secondary Payor (MSP) patient<br />
A Medicare benefi ciary with a health<br />
insurer other than Medicare (e.g. an<br />
Employer Group Health Plan) that has<br />
primary responsibility for payment <strong>of</strong><br />
the benefi ciary’s medical bills.<br />
Medicare Current Benefi ciary Survey (MCBS)<br />
An ongoing national survey <strong>of</strong> aged,<br />
disabled, and institutionalized Medicare<br />
beneficiaries. Sponsored by<br />
the Centers for Medicare and Medicaid<br />
Services, and used to study the<br />
health status, health care use and expenditures,<br />
health insurance coverage,<br />
and socioeconomic and demographic<br />
characteristics <strong>of</strong> Medicare benefi<br />
ciaries.<br />
Microalbuminuria A condition in which<br />
small amounts <strong>of</strong> albumin are present<br />
in the urine; indicates early kidney<br />
damage.<br />
Modality A method <strong>of</strong> treatment. Treatment<br />
for end-stage renal disease<br />
(<strong>ESRD</strong>) is comprised <strong>of</strong> three modalities:<br />
hemodialysis, peritoneal dialysis,<br />
and transplantation.<br />
National Health and Nutrition Examination<br />
Survey (NHANES) A survey conducted by<br />
the National Center for Health Statistics<br />
(NCHS) at the Centers for Disease<br />
Control and Prevention; uses home<br />
interviews and health tests to collect<br />
information on health and diet in the<br />
<strong>United</strong> <strong>States</strong>.<br />
National Institutes <strong>of</strong> Health (NIH) The federal<br />
focal point for medical research<br />
in the U.S. and one <strong>of</strong> eight health<br />
agencies <strong>of</strong> the Public Health Services,<br />
which are part <strong>of</strong> the Department<br />
<strong>of</strong> Health and Human Services.<br />
Organ Procurement and Transplantation<br />
Network (OPTN) The unifi ed transplant<br />
network established by the <strong>United</strong><br />
<strong>States</strong> Congress under the National<br />
Organ Transplant Act (NOTA) <strong>of</strong> 1984.<br />
A private, non-pr<strong>of</strong>i t organization administered<br />
by the <strong>United</strong> Network for<br />
Organ Sharing, under contract with<br />
the Health Resources and Services Administration<br />
<strong>of</strong> the U.S. Department <strong>of</strong><br />
Health and Human Services.<br />
Percutaneous coronary intervention (PCI) A<br />
therapeutic procedure to treat the stenotic<br />
(narrowed) coronary arteries <strong>of</strong><br />
the heart found in coronary heart disease.<br />
Commonly known as coronary<br />
angioplasty or simply angioplasty.<br />
Period prevalent patient A patient receiving<br />
treatment for <strong>ESRD</strong> at some<br />
point during a period <strong>of</strong> time, usually<br />
six months or a year. Patients may die<br />
during the period or be point preva-<br />
lent at the end <strong>of</strong> the period. Period<br />
prevalence is a useful measure for cost<br />
analysis, since it indicates total disease<br />
burden over the course <strong>of</strong> a year.<br />
Peripheral vascular disease (PVD) A progressive<br />
disease that causes narrowing or<br />
occlusion <strong>of</strong> the arteries supplying the<br />
extremities <strong>of</strong> the body.<br />
Peritoneal dialysis Dialysis in which fl uid<br />
(dialysate) is introduced into the abdominal<br />
cavity and uremic toxins are<br />
removed across the peritoneum.<br />
Point prevalent patient A patient reported<br />
as receiving treatment for <strong>ESRD</strong> on a<br />
particular day <strong>of</strong> the calendar year (e.g.<br />
December 31).<br />
Program Medical Management and Information<br />
<strong>System</strong> for <strong>ESRD</strong>, and <strong>Renal</strong> Benefi ciary<br />
and Utilization <strong>System</strong> (PMMIS/REBUS) The<br />
major source <strong>of</strong> data for the USRDS.<br />
This CMS fi le incorporates data from<br />
the Medical Evidence form (CMS 2728),<br />
the Death Notifi cation form (CMS 2746),<br />
the Medicare Enrollment <strong>Data</strong>base,<br />
CMS paid claims records, and the UNOS<br />
transplant database.<br />
Prevalent <strong>ESRD</strong> patient A patient on renal<br />
replacement therapy or with a functioning<br />
kidney transplant (regardless<br />
<strong>of</strong> the transplant date). This definition<br />
excludes patients with acute renal<br />
failure, those with chronic renal<br />
failure who die before receiving treatment<br />
for <strong>ESRD</strong>, and those whose <strong>ESRD</strong><br />
treatments are not reported to CMS.<br />
Prevalent population The people in a<br />
population who have a disease at a<br />
given point in time (point prevalence)<br />
or during a given time period (period<br />
prevalence).<br />
Proteinuria The existence <strong>of</strong> protein in<br />
the urine; indicative <strong>of</strong> kidney damage.<br />
Recombinant human growth hormone (rhGH)<br />
Also called somatropin; a substance<br />
identical in its amino acid sequence<br />
to human growth hormone, and used<br />
to treat growth hormone defi ciency.<br />
REMIS CMS’s <strong>Renal</strong> Management Information<br />
<strong>System</strong> (REMIS), which has<br />
replaced the <strong>Renal</strong> Benefi ciary and<br />
Utilization <strong>System</strong> (REBUS). Includes<br />
an operational interface to the SIMS<br />
Central Repository.<br />
Renin Inhibitors A class <strong>of</strong> drugs used to<br />
lower blood pressure by blocking the<br />
renin-angiotensin system which regulates<br />
blood volume and systemic vascular<br />
resistance.<br />
SIMS CMS’s Standard Information Management<br />
<strong>System</strong> (SIMS), which became<br />
operational at the beginning <strong>of</strong> 2000.<br />
Supports CMS reporting requirements<br />
4 GlOSSARy<br />
<strong>2009</strong> USRDS Annual <strong>Data</strong> Report<br />
Vol 2<br />
esrd<br />
5<br />
glossary<br />
pg 395
5<br />
glossary<br />
pg 396<br />
and the business processes <strong>of</strong> the <strong>ESRD</strong><br />
networks; provides communication<br />
and data exchange links for the networks,<br />
CMS, and other parts <strong>of</strong> the<br />
renal community; supplies standard<br />
core data functionality for previous<br />
network data systems; and provides<br />
improved electronic communication<br />
capabilities, data standardization, and<br />
information management tools.<br />
Standard Analysis Files (SAFs) CMS fi les containing<br />
fi nal action Medicare inpatient/<br />
outpatient claims data: Inpatient, Outpatient,<br />
Home Health Agency, Hospice,<br />
Skilled Nursing Facility, Clinical Laboratory,<br />
Durable Medical Equipment, and<br />
5 percent Sample Benefi ciary.<br />
Standardized hospitalization ratio (SHR)<br />
Used to compare hospitalization<br />
rates for a selected group <strong>of</strong> patients<br />
by computing the ratio <strong>of</strong> the group’s<br />
observed hospitalization rate to the<br />
expected hospitalization rate for the<br />
national <strong>ESRD</strong> population.<br />
Standardized mortality ratio (SMR) Used<br />
to compare dialysis patient mortality<br />
rates from year to year. Mortality<br />
rates for a subgroup <strong>of</strong> patients are<br />
compared to a set <strong>of</strong> reference rates,<br />
with adjustments for age, gender, race,<br />
primary diagnosis, and <strong>ESRD</strong> vintage.<br />
Standardized transplantation ratio (STR)<br />
Used to compare transplant rates for<br />
a subgroup <strong>of</strong> patients to national<br />
transplant rates.<br />
abbreviations<br />
A1c glycosylated hemoglobin<br />
AAPCC average annual per capita cost<br />
ACE-I angiotensin converting enzyme<br />
inhibitor<br />
ACR albumin/creatinine ratio<br />
AKI acute kidney injury<br />
AMI acute myocardial infarction<br />
ARB angiotensin receptor blocker<br />
ASHD atherosclerotic heart disease<br />
AV arteriovenous<br />
BMI body mass index<br />
BRFSS Behavioral Risk Factor Surveillance<br />
<strong>System</strong><br />
BUN blood urea nitrogen<br />
CAPD continuous ambulatory peritoneal<br />
dialysis<br />
CCPD continuous cycler peritoneal dialysis<br />
CCR creatinine clearance rate<br />
CDC Centers for Disease Control and<br />
Prevention<br />
CDS Comprehensive Dialysis Study<br />
CHF congestive heart failure<br />
CK cystic kidney disease<br />
CKD chronic kidney disease<br />
CMS Centers for Medicare & Medicaid<br />
Services<br />
COPD chronic obstructive pulmonary disease<br />
CPM Clinical Performance Measures Project<br />
Statins Medications that lower cholesterol<br />
through action on an enzyme in<br />
the liver.<br />
Transient ischemic attacks (TIA) A temporary<br />
loss <strong>of</strong> neurological function<br />
caused by a brief period <strong>of</strong> inadequate<br />
blood supply in a portion <strong>of</strong> the brain<br />
supplied by the carotid or vertebral<br />
basilar arteries.<br />
<strong>United</strong> Network for Organ Sharing (UNOS) A<br />
private, non-pr<strong>of</strong>i t organization that<br />
maintains the organ transplant list for<br />
the nation and coordinates the matching<br />
and distribution <strong>of</strong> organs to patients<br />
awaiting transplant.<br />
Urea reduction ratio (URR) A means <strong>of</strong><br />
measuring dialysis dose by calculating<br />
the change in BUN over the course<br />
<strong>of</strong> a dialysis treatment. URR = (pre-dialysis<br />
– post-dialysis BUN) / pre-dialysis<br />
BUN * 100.<br />
Vintage Time in years that a patient has<br />
had <strong>ESRD</strong>.<br />
Wait list A list <strong>of</strong> patients awaiting an<br />
organ transplant; maintained by the<br />
<strong>United</strong> Network for Organ Sharing<br />
(UNOS).<br />
Some <strong>of</strong> these defi nitions are obtained from<br />
the Mond<strong>of</strong>acto Medical Dictionary, found at<br />
www.mond<strong>of</strong>acto.com/dictionary.<br />
CVA/TIA cerebrovascular accident/transient<br />
ischemic attack<br />
CPT Current Procedure and Terminology<br />
CRT-D cardiac resynchronization therapy<br />
defi brillator<br />
CVD cerebrovascular disease<br />
DM diabetes, diabetic<br />
DPO darbepoetin alfa<br />
DRG diagnosis related group<br />
ECD expanded criteria donor<br />
EGHP employer group health plan<br />
EPO erythropoietin<br />
ESA erythropoiesis stimulating agent<br />
<strong>ESRD</strong> end-stage renal disease<br />
eGFR estimated glomerular fi ltration rate<br />
GN glomerulonephritis<br />
HD hemodialysis<br />
HEDIS Health Plan Employer <strong>Data</strong><br />
Information Set<br />
HMO health maintenance organization<br />
HSA Health Service Area<br />
HTN hypertension<br />
ICD implantable cardioverter defi brillator<br />
ICD-9-CM International Classifi cation <strong>of</strong> Diseases,<br />
9th revision, Clinical Modifi cation<br />
IPD intermittent peritoneal dialysis<br />
ISHD ischemic heart disease<br />
KDOQI Kidney Disease Outcomes Quality<br />
Initiative<br />
MCBS Medicare Current Benefi ciary Survey<br />
ME Medical Evidence form (2728)<br />
MI myocardial infarction<br />
MPP Medicare as primary payor<br />
MSP Medicare as secondary payor<br />
NDM non-diabetic<br />
NHANES National Health and Nutrition<br />
Examination Survey<br />
NKF National Kidney Foundation<br />
OPTN Organ Procurement and<br />
Transplantation Network<br />
PCI percutaneous coronary intervention<br />
PD peritoneal dialysis<br />
PPPM per person per month<br />
PPPY per person per year<br />
PAD peripheral arterial disease<br />
PVD peripheral vascular disease<br />
rhGH recombinant human growth hormone<br />
SHR standardized hospitalization ratio<br />
SMR standardized mortality ratio<br />
STR standardized transplantation ratio<br />
Tx transplant<br />
UNOS <strong>United</strong> Network for Organ Sharing<br />
WHO World Health Organization
<strong>United</strong> <strong>States</strong> <strong>Renal</strong> <strong>Data</strong> <strong>System</strong> (USRDS)<br />
Agreement for Release <strong>of</strong> <strong>Data</strong><br />
Project title _________________________________________________________________________________________________<br />
In this agreement, “Recipient” means __________________________________________________________________________<br />
__________________________________________________________________________<br />
A. Th e National Institute <strong>of</strong> Diabetes and Digestive and Kidney Diseases (NIDDK), through the <strong>United</strong> <strong>States</strong> <strong>Renal</strong> <strong>Data</strong> <strong>System</strong><br />
(USRDS) Coordinating Center (CC), will provide the Recipient with tapes, disks, and/or hard copies containing data extracted from<br />
the USRDS research database.<br />
B. Th e sole purpose <strong>of</strong> providing the data is the conduct <strong>of</strong> legitimate and approved biomedical, cost-eff ectiveness, and/or other economic<br />
research by the Recipient.<br />
C. Th e Recipient shall not use the data to identify individuals on the fi le.<br />
D. Th e Recipient shall not combine or link the data provided with any other collection or source <strong>of</strong> information that may contain information<br />
specifi c to individuals on the fi le, except where written authorization has been obtained through the approval process.<br />
E. Th e Recipient shall not use the data for purposes that are not related to biomedical research, cost-eff ectiveness, or other economic<br />
research. Purposes for which the data may not be used include, but are not limited to,<br />
• the identifi cation and targeting <strong>of</strong> under- or over-served health service markets primarily for commercial benefi t<br />
• the obtaining <strong>of</strong> information about providers or facilities for commercial benefi t<br />
• insurance purposes such as redlining areas deemed to <strong>of</strong>f er bad health insurance risks<br />
• adverse selection (e.g., identifying patients with high risk diagnoses)<br />
Any use <strong>of</strong> the data for research not in the original proposal must be approved by the USRDS Project Offi cer (PO).<br />
F. Th e Recipient shall not publish or otherwise disclose the data in the fi le to any person or organization unless the data have been aggregated<br />
(that is, combined into groupings <strong>of</strong> data such that the data are no longer specifi c to any individuals within each grouping),<br />
and no cells (aggregates <strong>of</strong> data) contain information on fewer than ten individuals or fewer than fi ve providers or facilities. Th e<br />
Recipient shall not publish or otherwise disclose data that identify individual providers or facilities, or from which such identities<br />
could be inferred. However, the Recipient may release data to a contractor for purposes <strong>of</strong> data processing or storage if (1) the Recipient<br />
specifi ed in the research plan submitted to the USRDS Project Offi cer that data would be released to the particular contractor,<br />
or the Recipient has obtained written authorization from the PO to release the data to such contractor, and (2) the contractor has<br />
signed a data release agreement with the PO.<br />
G. A copy <strong>of</strong> any aggregation <strong>of</strong> data intended for publication shall be submitted to the PO for review for compliance with the confi dentiality<br />
provisions <strong>of</strong> this agreement prior to submission for publication and, if not approved, shall not be published until compliance<br />
is achieved. Th e PO must respond within 30 days.<br />
H. Appropriate administrative, technical, procedural, and physical safeguards shall be established by the Recipient to protect the confi<br />
dentiality <strong>of</strong> the data and to prevent unauthorized access to it. Th e safeguards shall provide a level <strong>of</strong> security outlined in OMB<br />
Circular No. A-130, Appendix III — Security <strong>of</strong> Federal Automated Information <strong>System</strong>, which sets forth guidelines for security<br />
plans for automated information systems in Federal agencies.<br />
I. No copies or derivatives shall be made <strong>of</strong> the data in this fi le except as necessary for the purpose authorized in this agreement. Th e<br />
Recipient shall keep an accurate written account <strong>of</strong> all such copies and derivative fi les, which will be furnished upon request to the<br />
PO. Th e USRDS data fi les covered in this data use agreement may be retained by the Recipient until ________________. At the<br />
completion <strong>of</strong> the activities in the research plan, the fi le shall be returned to the USRDS CC at the Recipient’s expense, and any<br />
derivative fi les and copies shall be destroyed.<br />
J. For the purpose <strong>of</strong> inspecting security procedures and arrangements, authorized representatives <strong>of</strong> the PO and/or <strong>of</strong> CMS will, upon<br />
request, be granted access to premises where data in this fi le are kept.
__________________________________________________________________________<br />
Recipient typed name, title, & organization<br />
___________________________________________________________________________<br />
Recipient telephone number<br />
___________________________________________________________________________<br />
Recipient signature & date<br />
___________________________________________________________________________<br />
Contractor typed name, title, & organization, as appropriate<br />
___________________________________________________________________________<br />
Contractor telephone number<br />
___________________________________________________________________________<br />
Contractor signature & date<br />
Lawrence Y. C. Agodoa, MD, NIDDK, NIH or<br />
Paul W. Eggers, PhD, NIDDK, NIH<br />
USRDS Project Offi cer<br />
___________________________________________________________________________<br />
USRDS Project Offi cer signature & date<br />
May 2004
<strong>United</strong> <strong>States</strong> <strong>Renal</strong> <strong>Data</strong> <strong>System</strong> (USRDS)<br />
International <strong>Data</strong> Collection Form<br />
Th is form is designed to solicit information on the population<br />
<strong>of</strong> End-Stage <strong>Renal</strong> Disease (<strong>ESRD</strong>) patients in your country.<br />
Th e information you provide will be returned to you along with<br />
comparable information from other countries participating in the<br />
voluntary eff ort.<br />
Th e form has been changed and expanded to provide more detail<br />
in age-specifi c categories. If you cannot provide data in the age<br />
categories listed, please provide the total numbers. Th e format has<br />
also been changed to more clearly separate incident and prevalent<br />
population counts from transplant counts.<br />
A) Population: the population <strong>of</strong> your country for the most recent<br />
year available<br />
B) Incidence: the count <strong>of</strong> patients who start any form <strong>of</strong> renal<br />
replacement therapy during the year. Th ese are fi rst-time patients<br />
only; patients who start dialysis aft er a failed transplant,<br />
for example, should not be included.<br />
B2) Th e subset <strong>of</strong> total incident patients whose failure is due to<br />
diabetic nephropathy. Subtracting B2 from B1 should give<br />
the total number <strong>of</strong> incident patients for all non-diabetic<br />
nephropathy causes.<br />
C) Prevalence: the point prevalent count <strong>of</strong> patients at the end <strong>of</strong><br />
the calendar year (December 31).<br />
C1) All patients on some form <strong>of</strong> treatment, dialysis or transplantation.<br />
C2) Patients with a functioning kidney transplant as <strong>of</strong> December<br />
31.<br />
C3) All dialysis patients. C2 and C3 should sum to C1 unless<br />
there are lost-to-follow-up patients. If there are lost-t<strong>of</strong>ollow-up<br />
patients, please note this fact and whether these<br />
patients are captured in C2.<br />
C4) All patients treated with in-center hemodialysis as <strong>of</strong><br />
December 31.<br />
C5) All patients treated with CAPD or CCPD as <strong>of</strong> December<br />
31.<br />
C6) All patients treated with home hemodialysis as <strong>of</strong> December<br />
31.<br />
C4, C5, and C6 are subsets <strong>of</strong> all dialysis patients (C3). Th ey<br />
should not total to more than C3. Th ey may, however, sum<br />
to less than C3 due to unknown or other types <strong>of</strong> dialysis.<br />
D) Transplant activity: Th is is meant to be a count <strong>of</strong> transplants,<br />
not transplanted patients. If a patient receives multiple transplants<br />
during the year, all should be counted. If you report only<br />
transplanted patients, please provide these numbers and note<br />
that they refer to patients. D1 (cadaveric transplants) and D2<br />
(living donor transplants) should sum to the total number <strong>of</strong><br />
transplants. If there are a number <strong>of</strong> transplants with unknown<br />
donor types, or if you cannot separate transplants by donor<br />
type, please report the total number <strong>of</strong> transplants.<br />
You may return this form to us by email or fax:<br />
usrds@usrds.org, and 1.612.347.5878.<br />
Country _____________________________<br />
A) Population <strong>of</strong> country<br />
0–19 20–44 45–64 65–74 75+ Total<br />
2005 __________ __________ __________ __________ __________ __________<br />
2006 __________ __________ __________ __________ __________ __________<br />
2007 __________ __________ __________ __________ __________ __________<br />
2008 __________ __________ __________ __________ __________ __________<br />
B1) Incidence: Total number <strong>of</strong> incident (new) patients starting renal replacement therapy during the year<br />
0–19 20–44 45–64 65–74 75+ Total<br />
2005 __________ __________ __________ __________ __________ __________<br />
2006 __________ __________ __________ __________ __________ __________<br />
2007 __________ __________ __________ __________ __________ __________<br />
2008 __________ __________ __________ __________ __________ __________<br />
B2) Incidence: Total number <strong>of</strong> incident patients starting renal replacement therapy during the year due to diabetes<br />
0–19 20–44 45–64 65–74 75+ Total<br />
2005 __________ __________ __________ __________ __________ __________<br />
2006 __________ __________ __________ __________ __________ __________<br />
2007 __________ __________ __________ __________ __________ __________<br />
2008 __________ __________ __________ __________ __________ __________
C1) Prevalence: Total number <strong>of</strong> <strong>ESRD</strong> patients (all treatment categories) at the end <strong>of</strong> the year (December 31)<br />
0–19 20–44 45–64 65–74 75+ Total<br />
2005 __________ __________ __________ __________ __________ __________<br />
2006 __________ __________ __________ __________ __________ __________<br />
2007 __________ __________ __________ __________ __________ __________<br />
2008 __________ __________ __________ __________ __________ __________<br />
C2) Prevalence: Total number <strong>of</strong> <strong>ESRD</strong> patients with a functioning graft at the end <strong>of</strong> the year (December 31)<br />
0–19 20–44 45–64 65–74 75+ Total<br />
2005 __________ __________ __________ __________ __________ __________<br />
2006 __________ __________ __________ __________ __________ __________<br />
2007 __________ __________ __________ __________ __________ __________<br />
2008 __________ __________ __________ __________ __________ __________<br />
C3) Prevalence: Total number <strong>of</strong> <strong>ESRD</strong> patients on dialysis at the end <strong>of</strong> the year (December 31)<br />
0–19 20–44 45–64 65–74 75+ Total<br />
2005 __________ __________ __________ __________ __________ __________<br />
2006 __________ __________ __________ __________ __________ __________<br />
2007 __________ __________ __________ __________ __________ __________<br />
2008 __________ __________ __________ __________ __________ __________<br />
C4) Prevalence: Total number <strong>of</strong> <strong>ESRD</strong> patients on in-center hemodialysis at the end <strong>of</strong> the year (December 31)<br />
0–19 20–44 45–64 65–74 75+ Total<br />
2005 __________ __________ __________ __________ __________ __________<br />
2006 __________ __________ __________ __________ __________ __________<br />
2007 __________ __________ __________ __________ __________ __________<br />
2008 __________ __________ __________ __________ __________ __________<br />
C5) Prevalence: Total number <strong>of</strong> <strong>ESRD</strong> patients on CAPD/CCPD at the end <strong>of</strong> the year (December 31)<br />
0–19 20–44 45–64 65–74 75+ Total<br />
2005 __________ __________ __________ __________ __________ __________<br />
2006 __________ __________ __________ __________ __________ __________<br />
2007 __________ __________ __________ __________ __________ __________<br />
2008 __________ __________ __________ __________ __________ __________<br />
C6) Prevalence: Total number <strong>of</strong> <strong>ESRD</strong> patients on home hemodialysis at the end <strong>of</strong> the year (December 31)<br />
0–19 20–44 45–64 65–74 75+ Total<br />
2005 __________ __________ __________ __________ __________ __________<br />
2006 __________ __________ __________ __________ __________ __________<br />
2007 __________ __________ __________ __________ __________ __________<br />
2008 __________ __________ __________ __________ __________ __________<br />
D1) Transplant: Total number <strong>of</strong> cadaveric transplants during the year<br />
0–19 20–44 45–64 65–74 75+ Total<br />
2005 __________ __________ __________ __________ __________ __________<br />
2006 __________ __________ __________ __________ __________ __________<br />
2007 __________ __________ __________ __________ __________ __________<br />
2008 __________ __________ __________ __________ __________ __________<br />
D2) Transplant: Total number <strong>of</strong> living donor transplants during the year<br />
0–19 20–44 45–64 65–74 75+ Total<br />
2005 __________ __________ __________ __________ __________ __________<br />
2006 __________ __________ __________ __________ __________ __________<br />
2007 __________ __________ __________ __________ __________ __________<br />
2008 __________ __________ __________ __________ __________ __________
DEPARTMENT OF HEALTH AND HUMAN SERVICES Form Approved<br />
CENTERS FOR MEDICARE & MEDICAID SERVICES OMB No. 0938-0046<br />
END STAGE RENAL DISEASE MEDICAL EVIDENCE REPORT<br />
MEDICARE ENTITLEMENT AND/OR PATIENT REGISTRATION<br />
A. COMPLETE FOR ALL <strong>ESRD</strong> PATIENTS Check one: Initial Re-entitlement Supplemental<br />
1. Name (Last, First, Middle Initial)<br />
2. Medicare Claim Number 3. Social Security Number 4. Date <strong>of</strong> Birth<br />
5. Patient Mailing Address (Include City, State and Zip) 6. Phone Number<br />
( )<br />
t<br />
Prior<br />
Curren<br />
MM DD YYYY<br />
7. Sex<br />
8. Ethnicity<br />
9. Country/Area <strong>of</strong> Origin or Ancestry<br />
Male Female Not Hispanic or Latino Hispanic or Latino (Complete Item 9)<br />
10. Race (Check all that apply)<br />
11. Is patient applying for <strong>ESRD</strong><br />
White Asian<br />
Medicare coverage?<br />
Black or African American<br />
American Indian/Alaska Native<br />
Native Hawaiian or Other Pacific Islander*<br />
Yes No<br />
Print Name <strong>of</strong> Enrolled/Principal Tribe _________________ *complete Item 9<br />
12. Current Medical Coverage (Check all that apply)<br />
13. Height<br />
14. Dry Weight 15. Primary Cause <strong>of</strong> <strong>Renal</strong><br />
Medicaid Medicare Employer Group Health Insurance INCHES _______ OR<br />
POUNDS _______ OR Failure (Use code from back <strong>of</strong> form)<br />
DVA Medicare Advantage Other None CENTIMETERS _______<br />
KILOGRAMS _______<br />
16. Employment Status (6 mos prior and 17. Co-Morbid Conditions (Check all that apply currently and/or during last 10 years) *See instructions<br />
current status) a. Congestive heart failure n. Malignant neoplasm, Cancer<br />
b. Atherosclerotic heart disease ASHD o. Toxic nephropathy<br />
c. Other cardiac disease p. Alcohol dependence<br />
Unemployed<br />
Employed Full Time<br />
Employed Part Time<br />
d.<br />
e.<br />
f.<br />
g.<br />
Cerebrovascular disease, CVA, TIA*<br />
Peripheral vascular disease*<br />
History <strong>of</strong> hypertension<br />
Amputation<br />
q.<br />
r.<br />
s.<br />
t.<br />
Drug dependence*<br />
Inability to ambulate<br />
Inability to transfer<br />
Needs assistance with daily activities<br />
Homemaker<br />
h. Diabetes, currently on insulin u. Institutionalized<br />
Retired due to Age/Preference<br />
Retired (Disability)<br />
Medical Leave <strong>of</strong> Absence<br />
i.<br />
j.<br />
k.<br />
l.<br />
Diabetes, on oral medications<br />
Diabetes, without medications<br />
Diabetic retinopathy<br />
Chronic obstructive pulmonary disease v.<br />
1. Assisted Living<br />
2. Nursing Home<br />
3. Other Institution<br />
Non-renal congenital abnormality<br />
Student<br />
18. Prior to <strong>ESRD</strong> therapy:<br />
m. Tobacco use (current smoker) w. None<br />
a. Did patient receive exogenous erythropoetin or equivalent?<br />
Yes No Unknown If Yes, answer: 6-12 months >12 months<br />
b. Was patient under care <strong>of</strong> a nephrologist?<br />
Yes No Unknown If Yes, answer: 6-12 months >12 months<br />
c. Was patient under care <strong>of</strong> kidney dietitian?<br />
Yes No Unknown If Yes, answer: 6-12 months >12 months<br />
d. What access was used on first outpatient dialysis:<br />
AVF Graft Catheter Other<br />
If not AVF, then: Is maturing AVF present?<br />
Yes No<br />
Is maturing graft present?<br />
Yes No<br />
19. Laboratory Values Within 45 Days Prior to the Most Recent <strong>ESRD</strong> Episode. (Lipid Pr<strong>of</strong>ile within 1 Year <strong>of</strong> Most Recent <strong>ESRD</strong> Episode).<br />
LABORATORY TEST VALUE DATE LABORATORY TEST VALUE DATE<br />
a.1. Serum Albumin (g/dl) ___ . ___ d. HbA1c<br />
___ ___ . ___%<br />
a.2. Serum Albumin Lower Limit ___ . ___<br />
e. Lipid Pr<strong>of</strong>ile TC<br />
___ ___ ___<br />
a.3. Lab Method Used (BCG or BCP)<br />
LDL<br />
___ ___ ___<br />
b. Serum Creatinine (mg/dl) ___ ___ . ___<br />
HDL<br />
___ ___<br />
c. Hemoglobin (g/dl) ___ ___ . ___<br />
TG<br />
___ ___ ___ ___<br />
B. COMPLETE FOR ALL <strong>ESRD</strong> PATIENTS IN DIALYSIS TREATMENT<br />
20. Name <strong>of</strong> Dialysis Facility<br />
21. Medicare Provider Number (for item 20)<br />
22. Primary Dialysis Setting<br />
Home Dialysis Facility/Center SNF/Long Term Care Facility<br />
24. Date Regular Chronic Dialysis Began<br />
26. Has patient been informed <strong>of</strong> kidney transplant options?<br />
Yes No<br />
FORM CMS-2728-U3 (06/04) EF(03/2005)<br />
MM DD YYYY<br />
Medical Evidence form<br />
(2728), 2005 version<br />
23. Primary Type <strong>of</strong> Dialysis<br />
Hemodialysis (Sessions per week____/hours per session____)<br />
CAPD CCPD Other<br />
25. Date Patient Started Chronic<br />
Dialysis at Current Facility MM DD YYYY<br />
27. If patient NOT informed <strong>of</strong> transplant options, please check all that apply:<br />
Medically unfit Patient declines information<br />
Unsuitable due to age Patient has not been assessed<br />
Psychologically unfit Other
Medical Evidence form<br />
(2728), 2005 version<br />
C. COMPLETE FOR ALL KIDNEY TRANSPLANT PATIENTS<br />
28. Date <strong>of</strong> Transplant 29. Name <strong>of</strong> Transplant Hospital 30. Medicare Provider Number for Item 29<br />
MM DD YYYY<br />
Date patient was admitted as an inpatient to a hospital in preparation for, or anticipation <strong>of</strong>, a kidney transplant prior to the date <strong>of</strong><br />
actual transplantation.<br />
31. Enter Date<br />
MM DD YYYY<br />
34. Current Status <strong>of</strong> Transplant (if functioning, skip items 36 and 37)<br />
Functioning Non-Functioning<br />
36. If Non-Functioning, Date <strong>of</strong> Return to Regular Dialysis<br />
MM DD YYYY<br />
32. Name <strong>of</strong> Preparation Hospital 33. Medicare Provider number for Item 32<br />
35. Type <strong>of</strong> Donor:<br />
Deceased Living Related Living Unrelated<br />
37. Current Dialysis Treatment Site<br />
Home Dialysis Facility/Center SNF/Long Term Care Facility<br />
D. COMPLETE FOR ALL <strong>ESRD</strong> SELF-DIALYSIS TRAINING PATIENTS (MEDICARE APPLICANTS ONLY)<br />
38. Name <strong>of</strong> Training Provider<br />
40. Date Training Began<br />
MM DD YYYY<br />
42. This Patient is Expected to Complete (or has completed) Training<br />
and will Self-dialyze on a Regular Basis.<br />
Yes No<br />
39. Medicare Provider Number <strong>of</strong> Training Provider (for Item 38)<br />
41. Type <strong>of</strong> Training Hemodialysis a. Home b. In Center<br />
CAPD CCPD Other<br />
43. Date When Patient Completed, or is Expected to Complete, Training<br />
MM DD YYYY<br />
I certify that the above self-dialysis training information is correct and is based on consideration <strong>of</strong> all pertinent medical,<br />
psychological, and sociological factors as reflected in records kept by this training facility.<br />
44. Printed Name and Signature <strong>of</strong> Physician personally familiar with the patient’s training 45. UPIN <strong>of</strong> Physician in Item 44<br />
a.) Printed Name b.) Signature c.) Date MM DD YYYY<br />
E. PHYSICIAN IDENTIFICATION<br />
46. Attending Physician (Print) 47. Physician’s Phone No. 48. UPIN <strong>of</strong> Physician in Item 46<br />
( )<br />
PHYSICIAN ATTESTATION<br />
I certify, under penalty <strong>of</strong> perjury, that the information on this form is correct to the best <strong>of</strong> my knowledge and belief. Based on diagnostic<br />
tests and laboratory findings, I further certify that this patient has reached the stage <strong>of</strong> renal impairment that appears irreversible and<br />
permanent and requires a regular course <strong>of</strong> dialysis or kidney transplant to maintain life. I understand that this information is intended for<br />
use in establishing the patient’s entitlement to Medicare benefits and that any falsification, misrepresentation, or concealment <strong>of</strong> essential<br />
information may subject me to fine, imprisonment, civil penalty, or other civil sanctions under applicable Federal laws.<br />
49. Attending Physician’s Signature <strong>of</strong> Attestation (Same as Item 46) 50. Date<br />
51. Physician Recertification Signature 52. Date<br />
53. Remarks<br />
F. OBTAIN SIGNATURE FROM PATIENT<br />
MM DD YYYY<br />
MM DD YYYY<br />
I hereby authorize any physician, hospital, agency, or other organization to disclose any medical records or other<br />
information about my medical condition to the Department <strong>of</strong> Health and Human Services for purposes <strong>of</strong> reviewing my<br />
application for Medicare entitlement under the Social Security Act and/or for scientific research.<br />
54. Signature <strong>of</strong> Patient (Signature by mark must be witnessed.) 55. Date<br />
G. PRIVACY STATEMENT<br />
MM DD YYYY<br />
The collection <strong>of</strong> this information is authorized by Section 226A <strong>of</strong> the Social Security Act. The information provided will be used to determine if an individual is entitled to<br />
Medicare under the End Stage <strong>Renal</strong> Disease provisions <strong>of</strong> the law. The information will be maintained in system No. 09-70-0520, “End Stage <strong>Renal</strong> Disease Program<br />
Management and Medical Information <strong>System</strong> (<strong>ESRD</strong> PMMIS)”, published in the Federal Register, Vol. 67, No. 116, June 17, 2002, pages 41244-41250 or as updated and<br />
republished. Collection <strong>of</strong> your Social Security number is authorized by Executive Order 9397. Furnishing the information on this form is voluntary, but failure to do so may<br />
result in denial <strong>of</strong> Medicare benefits. Information from the <strong>ESRD</strong> PMMIS may be given to a congressional <strong>of</strong>fice in response to an inquiry from the congressional <strong>of</strong>fice made<br />
at the request <strong>of</strong> the individual; an individual or organization for research, demonstration, evaluation, or epidemiologic project related to the prevention <strong>of</strong> disease or<br />
disability, or the restoration or maintenance <strong>of</strong> health. Additional disclosures may be found in the Federal Register notice cited above. You should be aware that P.L.100-503,<br />
the Computer Matching and Privacy Protection Act <strong>of</strong> 1988, permits the government to verify information by way <strong>of</strong> computer matches.<br />
FORM CMS-2728-U3 (06/04) EF(03/2005)
LIST OF PRIMARY CAUSES OF END STAGE RENAL DISEASE<br />
Item 15. Primary Cause <strong>of</strong> <strong>Renal</strong> Failure should be completed by the attending physician from the list below. Enter the<br />
ICD-9-CM code to indicate the primary cause <strong>of</strong> end stage renal disease. If there are several probable causes <strong>of</strong> renal failure,<br />
choose one as primary. Code effective as <strong>of</strong> September 2003.<br />
DIABETES<br />
25040 Diabetes with renal manifestations Type 2<br />
25041 Diabetes with renal manifestations Type 1<br />
GLOMERULONEPHRITIS<br />
5829 Glomerulonephritis (GN)<br />
(histologically not examined)<br />
5821 Focal glomerulosclerosis, focal sclerosing GN<br />
5831 Membranous nephropathy<br />
58321 Membranoproliferative GN type 1, diffuse MPGN<br />
58322 Dense deposit disease, MPGN type 2<br />
58381 IgA nephropathy, Berger’s disease<br />
(proven by immun<strong>of</strong>luorescence)<br />
58382 IgM nephropathy (proven by immun<strong>of</strong>luorescence)<br />
5834 With lesion <strong>of</strong> rapidly progressive GN<br />
5800 Post infectious GN, SBE<br />
5820 Other proliferative GN<br />
SECONDARY GN/VASCULITIS<br />
7100 Lupus erythematosus, (SLE nephritis)<br />
2870 Henoch-Schonlein syndrome<br />
7101 Scleroderma<br />
28311 Hemolytic uremic syndrome<br />
4460 Polyarteritis<br />
4464 Wegener’s granulomatosis<br />
58392 Nephropathy due to heroin abuse and related drugs<br />
44620 Other Vasculitis and its derivatives<br />
44621 Goodpasture’s syndrome<br />
58391 Secondary GN, other<br />
INTERSTITIAL NEPHRITIS/PYELONEPHRITIS<br />
9659 Analgesic abuse<br />
5830 Radiation nephritis<br />
9849 Lead nephropathy<br />
5909 Nephropathy caused by other agents<br />
27410 Gouty nephropathy<br />
5920 Nephrolithiasis<br />
5996 Acquired obstructive uropathy<br />
5900 Chronic pyelonephritis, reflux nephropathy<br />
58389 Chronic interstitial nephritis<br />
58089 Acute interstitial nephritis<br />
5929 Urolithiasis<br />
27549 Other disorders <strong>of</strong> calcium metabolism<br />
HYPERTENSION/LARGE VESSEL DISEASE<br />
40391 Unspecified with renal failure<br />
4401 <strong>Renal</strong> artery stenosis<br />
59381 <strong>Renal</strong> artery occlusion<br />
59383 Cholesterol emboli, renal emboli<br />
FORM CMS-2728-U3 (06/04) EF(03/2005)<br />
CYSTIC/HEREDITARY/CONGENITAL DISEASES<br />
75313 Polycystic kidneys, adult type (dominant)<br />
75314 Polycystic, infantile (recessive)<br />
75316 Medullary cystic disease, including nephronophthisis<br />
7595 Tuberous sclerosis<br />
7598 Hereditary nephritis, Alport’s syndrome<br />
2700 Cystinosis<br />
2718 Primary oxalosis<br />
2727 Fabry’s disease<br />
7533 Congenital nephrotic syndrome<br />
5839 Drash syndrome, mesangial sclerosis<br />
75321 Congenital obstruction <strong>of</strong> ureterpelvic junction<br />
75322 Congenital obstruction <strong>of</strong> uretrovesical junction<br />
75329 Other Congenital obstructive uropathy<br />
7530 <strong>Renal</strong> hypoplasia, dysplasia, oligonephronia<br />
75671 Prune belly syndrome<br />
75989 Other (congenital malformation syndromes)<br />
NEOPLASMS/TUMORS<br />
Medical Evidence form<br />
(2728), 2005 version<br />
1890 <strong>Renal</strong> tumor (malignant)<br />
1899 Urinary tract tumor (malignant)<br />
2230 <strong>Renal</strong> tumor (benign)<br />
2239 Urinary tract tumor (benign)<br />
23951 <strong>Renal</strong> tumor (unspecified)<br />
23952 Urinary tract tumor (unspecified)<br />
20280 Lymphoma <strong>of</strong> kidneys<br />
20300 Multiple myeloma<br />
20308 Other immuno proliferative neoplasms<br />
(including light chain nephropathy)<br />
2773 Amyloidosis<br />
99680 Complications <strong>of</strong> transplanted organ unspecified<br />
99681 Complications <strong>of</strong> transplanted kidney<br />
99682 Complications <strong>of</strong> transplanted liver<br />
99683 Complications <strong>of</strong> transplanted heart<br />
99684 Complications <strong>of</strong> transplanted lung<br />
99685 Complications <strong>of</strong> transplanted bone marrow<br />
99686 Complications <strong>of</strong> transplanted pancreas<br />
99687 Complications <strong>of</strong> transplanted intestine<br />
99689 Complications <strong>of</strong> other specified transplanted organ<br />
MISCELLANEOUS CONDITIONS<br />
28260 Sickle cell disease/anemia<br />
28269 Sickle cell trait and other sickle cell (HbS/Hb other)<br />
64620 Post partum renal failure<br />
042 AIDS nephropathy<br />
8660 Traumatic or surgical loss <strong>of</strong> kidney(s)<br />
5724 Hepatorenal syndrome<br />
5836 Tubular necrosis (no recovery)<br />
59389 Other renal disorders<br />
7999 Etiology uncertain
Medical Evidence form<br />
(2728), 1995 version<br />
U.S. DEPARTMENT OF HEALTH & HUMAN SERVICES FORM APPROVED<br />
CENTERS FOR MEDICARE & MEDICAID SERVICES OMB NO. 0938-0046<br />
END STAGE RENAL DISEASE MEDICAL EVIDENCE REPORT<br />
MEDICARE ENTITLEMENT AND/OR PATIENT REGISTRATION<br />
A. COMPLETE FOR ALL <strong>ESRD</strong> PATIENTS<br />
1. Name (Last, First, Middle Initial)<br />
2. Health Insurance Claim Number 3. Social Security Number<br />
4. Full Address (Include City, State, and Zip) 5. Phone Number<br />
CMS-2728-U3 (6-97)<br />
6. Date <strong>of</strong> Birth<br />
_________/_________/_________<br />
MM DD YYYY<br />
7. Sex 8. Ethnicity<br />
■ Male ■ Female ■ Hispanic: Mexican ■ Hispanic: Other ■ Non-Hispanic<br />
9. Race (Check one box only) 10. Medical Coverage (Check all that apply)<br />
■ White<br />
■ Black<br />
■ Mid-East/Arabian<br />
■ Indian sub-Continent<br />
a. ■ Medicaid<br />
b. ■ DVA<br />
e. ■ Other Medical Insurance<br />
f. ■ None<br />
■ American Indian/Alaskan Native ■ Other, specify _____ c. ■ Medicare<br />
■ Asian<br />
________________ d. ■ Employer Group Health Insurance<br />
■ Pacific Islander<br />
■ Unknown<br />
11. Is Patient Applying for <strong>ESRD</strong> Medicare Coverage? (if YES, enter address <strong>of</strong> Social Security <strong>of</strong>fice)<br />
■ Yes ■ No<br />
CITY STATE ZIP<br />
12. Primary Cause <strong>of</strong> <strong>Renal</strong> Failure (Use code from back <strong>of</strong> form) 13. Height 14. Dry Weight<br />
17. Was pre-dialysis/transplant EPO administered?<br />
■ Yes ■ No<br />
INCHES OR CENTIMETERS<br />
18. Laboratory Values Prior to First Dialysis Treatment or Transplant *See Instructions.<br />
LABORATORY TEST VALUE DATE<br />
LABORATORY TEST VALUE DATE<br />
a. Hematocrit (%)<br />
e. Serum Creatinine (mg/dl)<br />
b. Hemoglobin (g/dl)*<br />
f. Creatinine Clearance (ml/min)*<br />
c. Serum Albumin (g/dl)<br />
g. BUN (mg/dl)*<br />
d. Serum Albumin Lower Limit (g/dl)<br />
h. Urea Clearance (ml/min)*<br />
B. COMPLETE FOR ALL <strong>ESRD</strong> PATIENTS IN DIALYSIS TREATMENT<br />
19. Name <strong>of</strong> Provider 20. Medicare Provider Number<br />
_________/_________/_________<br />
MM DD YY<br />
( )<br />
POUNDS OR KILOGRAMS<br />
15. Employment Status (6 mos. prior and 16. Co-Morbid Conditions (Check ALL that apply currently or during last 10 years) *See instructions<br />
current status) a. ■ Congestive heart failure<br />
k. ■ Diabetes, currently on insulin<br />
b. ■ Ischemic heart disease, CAD* l. ■ Chronic obstructive pulmonary disease<br />
■ ■ Unemployed<br />
■ ■ Employed Full Time<br />
■ ■ Employed Part Time<br />
■ ■ Homemaker<br />
■ ■ Retired due to Age/Preference<br />
■ ■ Retired (Disability)<br />
■ ■ Medical Leave <strong>of</strong> Absence<br />
■ ■ Student<br />
c. ■ Myocardial infarction<br />
d. ■ Cardiac arrest<br />
e. ■ Cardiac dysrhythmia<br />
f. ■ Pericarditis<br />
g. ■ Cerebrovascular disease, CVA, TIA*<br />
h. ■ Peripheral vascular disease*<br />
i. ■ History <strong>of</strong> hypertension<br />
j. ■ Diabetes (primary or contributing)<br />
m. ■ Tobacco use (current smoker)<br />
n. ■ Malignant neoplasm, Cancer<br />
o. ■ Alcohol dependence<br />
p. ■ Drug dependence*<br />
q. ■ HIV positive status ■ Can’t Disclose<br />
r. ■ AIDS ■ Can’t Disclose<br />
s. ■ Inability to ambulate<br />
t. ■ Inability to transfer<br />
Prior<br />
Current<br />
21. Primary Dialysis Setting 22. Primary Type <strong>of</strong> Dialysis<br />
■ Hospital Inpatient ■ Dialysis Facility/Center ■ Home ■ Hemodialysis ■ IPD ■ CAPD ■ CCPD ■ Other<br />
23. Date Regular Dialysis Began 24. Date Patient Started Chronic Dialysis at Current Facility<br />
_________/_________/_________<br />
_________/_________/_________<br />
MM DD YY<br />
MM DD YY<br />
25. Date Dialysis Stopped 26. Date <strong>of</strong> Death<br />
_________/_________/_________<br />
MM DD YY
C. COMPLETE FOR ALL KIDNEY TRANSPLANT PATIENTS<br />
27. Date <strong>of</strong> Transplant 28. Name <strong>of</strong> Transplant Hospital 29. Medicare Provider Number for Item 28<br />
Date patient was admitted as an inpatient to a hospital in preparation for, or anticipation <strong>of</strong>, a kidney transplant prior to the<br />
date <strong>of</strong> actual transplantation.<br />
30. Enter Date 31. Name <strong>of</strong> Preparation Hospital 32. Medicare Provider Number for Item 31<br />
_________/_________/_________<br />
MM DD YY<br />
33. Current Status <strong>of</strong> Transplant<br />
■ Functioning ■ Non-Functioning<br />
34. If Nonfunctioning, Date <strong>of</strong> Return To Regular Dialysis 35. Current Dialysis Treatment Site<br />
_________/_________/_________<br />
MM DD YY<br />
■ Hospital Inpatient ■ Dialysis Facility/Center ■ Home<br />
D. COMPLETE FOR ALL <strong>ESRD</strong> SELF-DIALYSIS TRAINING PATIENTS (MEDICARE APPLICANTS ONLY)<br />
36. Name <strong>of</strong> Training Provider 37. Medicare Provider Number <strong>of</strong> Training Provider<br />
38. Date Training Began 39. Type <strong>of</strong> Training<br />
_________/_________/_________<br />
MM DD YY<br />
■ Hemodialysis ■ IPD ■ CAPD ■ CCPD<br />
40. This Patient is Expected to Complete (or has completed) Training<br />
and Will Self-dialyze on a Regular Basis.<br />
41. Date When Patient Completed, or is Expected to Complete, Training<br />
■ Yes ■ No<br />
_________/_________/_________<br />
MM DD YY<br />
I certify that the above self-dialysis training information is correct and is based on consideration <strong>of</strong> all pertinent<br />
medical, psychological, and sociological factors as reflected in records kept by this training facility.<br />
42. Printed Name and Signature <strong>of</strong> Physician Personally Familiar with the Patient's Training 43. UPIN <strong>of</strong> Physician in Item 42<br />
E. PHYSICIAN IDENTIFICATION<br />
44. Attending Physician (Print) 45. Physician's Phone No. 46. UPIN <strong>of</strong> Physician in Item 44<br />
PHYSICIAN ATTESTATION<br />
I certify, under penalty <strong>of</strong> perjury, that the information on this form is correct to the best <strong>of</strong> my knowledge and belief.<br />
Based on diagnostic tests and laboratory findings, I further certify that this patient has reached the stage <strong>of</strong> renal<br />
impairment that appears irreversible and permanent and requires a regular course <strong>of</strong> dialysis or kidney transplant to<br />
maintain life. I understand that this information is intended for use in establishing the patient's entitlement to<br />
Medicare benefits and that any falsification, misrepresentation, or concealment <strong>of</strong> essential information may subject<br />
me to fine, imprisonment, civil penalty, or other civil sanctions under applicable Federal laws.<br />
47. Attending Physician's Signature <strong>of</strong> Attestation (Same as Item 44) 48. Date<br />
49. Remarks<br />
F. OBTAIN SIGNATURE FROM PATIENT<br />
I hereby authorize any physician, hospital, agency, or other organization to disclose any medical records or other<br />
information about my medical condition to the Department <strong>of</strong> Health and Human Services for purposes <strong>of</strong> reviewing<br />
my application for Medicare entitlement under the Social Security Act and/or for scientific research.<br />
50. Signature <strong>of</strong> Patient (Signature by Mark Must Be Witnessed.) 51. Date<br />
G. PRIVACY ACT STATEMENT<br />
The collection <strong>of</strong> this information is authorized by section 226A <strong>of</strong> the Social Security Act. The information provided will be used to determine if an individual is entitled to Medicare under the End Stage<br />
<strong>Renal</strong> Disease provisions <strong>of</strong> the law. The information will be maintained in system No. 09-70-0520, "End Stage <strong>Renal</strong> Disease Program Management and Medical Information <strong>System</strong> (<strong>ESRD</strong> PMMIS)",<br />
published in the Privacy Act Issuance, 1991 Compilation, Vol. 1, pages 436–437, December 31, 1991, or as updated and republished. Collection <strong>of</strong> your Social Security number is authorized by<br />
Executive Order 9397. Furnishing the information on this form is voluntary, but failure to do so may result in denial <strong>of</strong> Medicare benefits. Information from the <strong>ESRD</strong> PMMIS may be given to a<br />
congressional <strong>of</strong>fice in response to an inquiry from the congressional <strong>of</strong>fice made at the request <strong>of</strong> the individual; an individual or organization for a research, demonstration, evaluation, or<br />
epidemiologic project related to the prevention <strong>of</strong> disease or disability, or the restoration or maintenance <strong>of</strong> health. Additional disclosures may be found in the Federal Register notice cited above.<br />
You should be aware that P.L. 100-503, the Computer Matching and Privacy Protection Act <strong>of</strong> 1988, permits the government to verify information by way <strong>of</strong> computer matches.<br />
H. FOR <strong>ESRD</strong> NETWORK USE ONLY IN CASES REFERRED TO <strong>ESRD</strong> MEDICAL REVIEW BOARD<br />
52. Network Confirmed as <strong>ESRD</strong> 53. Authorized Signature 54. Date 55. Network Number<br />
■ Yes ■ No<br />
CMS-2728-U3 (6-97)<br />
_________/_________/_________<br />
MM DD YY<br />
( )<br />
_________/_________/_________<br />
MM DD YY<br />
Medical Evidence form<br />
(2728), 1995 version<br />
_________/_________/_________<br />
MM DD YY<br />
_________/_________/_________<br />
MM DD YY
Medical Evidence form<br />
(2728), 1995 version<br />
Item 12. Primary Cause <strong>of</strong> <strong>Renal</strong> Failure should be completed by the attending physician from the list below. Enter the<br />
ICD-9-CM code plus the letter code to indicate the primary cause <strong>of</strong> end stage renal disease. If there are several probable<br />
causes <strong>of</strong> renal failure, choose one as primary.<br />
CMS-2728-U3 (6-97)<br />
LIST OF PRIMARY CAUSES OF END STAGE RENAL DISEASE<br />
ICD-9 LTR NARRATIVE ICD-9 LTR NARRATIVE<br />
DIABETES<br />
25000 A Type II, adult-onset type or unspecified type diabetes<br />
25001 A Type I, juvenile type, ketosis prone diabetes<br />
GLOMERULONEPHRITIS<br />
5829 A Glomerulonephritis (GN)<br />
(histologically not examined)<br />
5821 A Focal glomerulosclerosis, focal sclerosing GN<br />
5831 A Membranous nephropathy<br />
5832 A Membranoproliferative GN type 1, diffuse MPGN<br />
5832 C Dense deposit disease, MPGN type 2<br />
58381 B IgA nephropathy, Berger’s disease<br />
(proven by immun<strong>of</strong>luorescence)<br />
58381 C IgM nephropathy (proven by immun<strong>of</strong>luorescence)<br />
5804 B Rapidly progressive GN<br />
5834 C Goodpasture’s Syndrome<br />
5800 C Post infectious GN, SBE<br />
5820 A Other proliferative GN<br />
SECONDARY GN/VASCULITIS<br />
7100 E Lupus erythematosus, (SLE nephritis)<br />
2870 A Henoch-Schonlein syndrome<br />
7101 B Scleroderma<br />
2831 A Hemolytic uremic syndrome<br />
4460 C Polyarteritis<br />
4464 B Wegener’s granulomatosis<br />
5839 C Nephropathy due to heroin abuse and related drugs<br />
4462 A Vasculitis and its derivatives<br />
5839 B Secondary GN, other<br />
INTERSTITIAL NEPHRITIS/PYELONEPHRITIS<br />
9659 A Analgesic abuse<br />
5830 B Radiation nephritis<br />
9849 A Lead nephropathy<br />
5909 A Nephropathy caused by other agents<br />
27410 A Gouty nephropathy<br />
5920 C Nephrolithiasis<br />
5996 A Acquired obstructive uropathy<br />
5900 A Chronic pyelonephritis, reflux nephropathy<br />
58389 B Chronic interstitial nephritis<br />
58089 A Acute interstitial nephritis<br />
5929 B Urolithiasis<br />
2754 A Nephrocalcinosis<br />
HYPERTENSION/LARGE VESSEL DISEASE<br />
4039 D <strong>Renal</strong> disease due to hypertension<br />
(no primary renal disease)<br />
4401 A <strong>Renal</strong> artery stenosis<br />
59381 B <strong>Renal</strong> artery occlusion<br />
59381 E Cholesterol emboli, renal emboli<br />
CYSTIC/HEREDITARY/CONGENITAL DISEASES<br />
75313 A Polycystic kidneys, adult type (dominant)<br />
75314 A Polycystic, infantile (recessive)<br />
75316 A Medullary cystic disease, including nephronophthisis<br />
7595 A Tuberous sclerosis<br />
7598 A Hereditary nephritis, Alport’s syndrome<br />
2700 A Cystinosis<br />
2718 B Primary oxalosis<br />
2727 A Fabry’s disease<br />
7533 A Congenital nephrotic syndrome<br />
5839 D Drash syndrome, mesangial sclerosis<br />
7532 A Congenital obstructive uropathy<br />
7530 B <strong>Renal</strong> hypoplasia, dysplasia, oligonephronia<br />
7567 A Prune belly syndrome<br />
7598 B Hereditary/familial nephropathy<br />
NEOPLASMS/TUMORS<br />
1890 B <strong>Renal</strong> tumor (malignant)<br />
1899 A Urinary tract tumor (malignant)<br />
2230 A <strong>Renal</strong> tumor (benign)<br />
2239 A Urinary tract tumor (benign)<br />
2395 A <strong>Renal</strong> tumor (unspecified)<br />
2395 B Urinary tract tumor (unspecified)<br />
20280 A Lymphoma <strong>of</strong> kidneys<br />
2030 A Multiple myeloma<br />
2030 B Light chain nephropathy<br />
2773 A Amyloidosis<br />
99680 A Complication post bone marrow or other transplant<br />
MISCELLANEOUS CONDITIONS<br />
28260 A Sickle cell disease/anemia<br />
28269 A Sickle cell trait and other sickle cell (HbS/Hb other)<br />
64620 A Post partum renal failure<br />
0429 A AIDS nephropathy<br />
8660 A Traumatic or surgical loss <strong>of</strong> kidney(s)<br />
5724 A Hepatorenal syndrome<br />
5836 A Tubular necrosis (no recovery)<br />
59389 A Other renal disorders<br />
7999 A Etiology uncertain
Medical Evidence form<br />
(2728), 1987 version
Death Notification form<br />
(2746), 2006 version<br />
DEPARTMENT OF HEALTH AND HUMAN SERVICES Form Approved<br />
CENTERS FOR MEDICARE & MEDICAID SERVICES OMB No. 0938-0448<br />
1. Patient’s Last Name First MI 2. Medicare Claim Number<br />
3. Patient’s Sex<br />
a. ■ Male b. ■ Female<br />
4. Date <strong>of</strong> Birth<br />
■■ _ _ / _ _ / _ _ _ _<br />
Month Month Day Day Year Year<br />
5. Social Security Number<br />
6. Patient’s State <strong>of</strong> Residence 7. Place <strong>of</strong> Death 8. Date <strong>of</strong> Death<br />
a. ■ Hospital<br />
b. ■ Dialysis Unit<br />
c. ■ Home e. ■ Other<br />
d. ■ Nursing Home<br />
_ _ / _ _ / _ _ _ _<br />
Month Day Year<br />
9. Modality at Time <strong>of</strong> Death<br />
a. ■ Incenter Hemodialysis b. ■ Home Hemodialysis c. ■ CAPD d. ■ CCPD e. ■ Transplant f. ■ Other<br />
10. Provider Name and Address (Street) 11. Provider Number<br />
Provider Address (City/State)<br />
12. Causes <strong>of</strong> Death (enter codes from list on back <strong>of</strong> form)<br />
a. Primary Cause _ _ _<br />
b. Were there secondary causes?<br />
■ No<br />
■ Yes, specify: _ _ _ _ _ _ _ _ _ _ _ _<br />
C. If cause is other (98) please specify:___________________________________________________________________■■<br />
■ ■■■ ■■■ ■■■<br />
13. <strong>Renal</strong> replacement therapy discontinued prior to death: ■ Yes ■ No<br />
If yes, check one <strong>of</strong> the following:<br />
a. ■ Following HD and/or PD access failure<br />
b. ■ Following transplant failure<br />
c. ■ Following chronic failure to thrive<br />
d. ■ Following acute medical complication<br />
e. ■ Other<br />
<strong>ESRD</strong> DEATH NOTIFICATION<br />
END STAGE RENAL DISEASE MEDICAL INFORMATION SYSTEM<br />
f. Date <strong>of</strong> last dialysis treatment _ _ / _ _ / _ _ _ _ ■■ ■■ ■■■■<br />
Month Day Year<br />
15. If deceased ever received a transplant:<br />
a. Date <strong>of</strong> most recent transplant _ _ / _ _ / _ _ _ _ ■ Unknown<br />
Month Day Year<br />
b. Type <strong>of</strong> transplant received<br />
■ Living Related ■ Living Unrelated ■ Deceased ■ Unknown<br />
c. Was graft functioning (patient not on dialysis) at time <strong>of</strong> death?<br />
■ Yes ■ No ■ Unknown<br />
d. Did transplant patient resume chronic maintenance dialysis prior to death?<br />
■ Yes ■ No ■ Unknown<br />
14. Was discontinuation <strong>of</strong> renal replacement<br />
therapy after patient/family request to stop<br />
dialysis?<br />
■ Yes ■ No<br />
■ Unknown ■ Not Applicable<br />
16. Was patient receiving Hospice care prior<br />
to death?<br />
■ Yes ■ No<br />
■ Unknown<br />
17. Name <strong>of</strong> Physician (Please print complete name) 18. Signature <strong>of</strong> Person Completing This Form Date<br />
This report is required by law (42, U.S.C. 426; 20 CFR 405, Section 2133). Individually identifiable patient information will not be<br />
disclosed except as provided for in the Privacy Act <strong>of</strong> 1974 (5 U.S.C. 5520; 45 CFR Part 5a).<br />
Form CMS-2746-U2 (08/06) EF 08/2006
CARDIAC<br />
23 Myocardial infarction, acute<br />
25 Pericarditis, incl. Cardiac tamponade<br />
26 Atherosclerotic heart disease<br />
27 Cardiomyopathy<br />
28 Cardiac arrhythmia<br />
29 Cardiac arrest, cause unknown<br />
30 Valvular heart disease<br />
31 Pulmonary edema due to exogenous fluid<br />
32 Congestive Heart Failure<br />
VASCULAR<br />
35 Pulmonary embolus<br />
36 Cerebrovascular accident including<br />
intracranial hemorrhage<br />
37 Ischemic brain damage/Anoxic encephalopathy<br />
38 Hemorrhage from transplant site<br />
39 Hemorrhage from vascular access<br />
40 Hemorrhage from dialysis circuit<br />
41 Hemorrhage from ruptured vascular aneurysm<br />
42 Hemorrhage from surgery (not 38, 39, or 41)<br />
43 Other hemorrhage (not 38-42, 72)<br />
44 Mesenteric infarction/ischemic bowel<br />
INFECTION<br />
33 Septicemia due to internal vascular access<br />
34 Septicemia due to vascular access catheter<br />
45 Peritoneal access infectious complication, bacterial<br />
46 Peritoneal access infectious complication, fungal<br />
47 Peritonitis (complication <strong>of</strong> peritoneal dialysis)<br />
48 Central nervous system infection (brain abscess,<br />
meningitis, encephalitis, etc.)<br />
51 Septicemia due to peripheral vascular disease,<br />
gangrene<br />
52 Septicemia, other<br />
61 Cardiac infection (endocarditis)<br />
62 Pulmonary infection (pneumonia, influenza)<br />
63 Abdominal infection (peritonitis (not comp <strong>of</strong> PD),<br />
perforated bowel, diverticular disease, gallbladder)<br />
70 Genito-urinary infection (urinary tract infection,<br />
pyelonephritis, renal abscess)<br />
<strong>ESRD</strong> DEATH NOTIFICATION FORM<br />
LIST OF CAUSES<br />
LIVER DISEASE<br />
64 Hepatitis B<br />
71 Hepatitis C<br />
65 Other viral hepatitis<br />
66 Liver-drug toxicity<br />
67 Cirrhosis<br />
68 Polycystic liver disease<br />
69 Liver failure, cause unknown or other<br />
GASTRO-INTESTINAL<br />
72 Gastro-intestinal hemorrhage<br />
73 Pancreatitis<br />
75 Perforation <strong>of</strong> peptic ulcer<br />
76 Perforation <strong>of</strong> bowel (not 75)<br />
METABOLIC<br />
24 Hyperkalemia<br />
77 Hypokalemia<br />
78 Hypernatremia<br />
79 Hyponatremia<br />
100 Hypoglycemia<br />
101 Hyperglycemia<br />
102 Diabetic coma<br />
95 Acidosis<br />
ENDOCRINE<br />
96 Adrenal insufficiency<br />
97 Hypothyroidism<br />
103 Hyperthyroidism<br />
OTHER<br />
80 Bone marrow depression<br />
81 Cachexia/failure to thrive<br />
82 Malignant disease, patient ever on<br />
Immunosuppressive therapy<br />
83 Malignant disease (not 82)<br />
84 Dementia, incl. dialysis dementia, Alzheimer’s<br />
85 Seizures<br />
87 Chronic obstructive lung disease (COPD)<br />
88 Complications <strong>of</strong> surgery<br />
89 Air embolism<br />
104 Withdrawal from dialysis/uremia<br />
90 Accident related to treatment<br />
91 Accident unrelated to treatment<br />
92 Suicide<br />
93 Drug overdose (street drugs)<br />
94 Drug overdose (not 92 or 93)<br />
98 Other cause <strong>of</strong> death<br />
99 Unknown<br />
Death Notification form<br />
(2746), 2006 version<br />
According to the Paperwork Reduction Act <strong>of</strong> 1995, no persons are required to respond to a collection <strong>of</strong> information unless it displays a valid OMB control number.<br />
The valid OMB control number for this information collection is 0938-0448. The time required to complete this information collection is estimated to average 30<br />
minutes per response, including the time to review instructions, search existing data resources, gather the data needed, and complete and review the information<br />
collection. If you have any comments concerning the accuracy <strong>of</strong> the time estimate(s) or suggestions for improving this form, please write to: CMS, Attn: PRA<br />
Reports Clearance Officer, 7500 Security Boulevard, Baltimore, Maryland 21244-1850.<br />
Form CMS-2746-U2 (08/06) EF 08/2006
Death Notification form<br />
(2746), 2004 version<br />
DEPARTMENT OF HEALTH AND HUMAN SERVICES Form Approved<br />
CENTERS FOR MEDICARE & MEDICAID SERVICES OMB No. 0938-0448<br />
3. Patient’s Sex<br />
a. ■ Male b. ■ Female<br />
4. Date <strong>of</strong> Birth<br />
■■ _ _ / _ _ / _ _ _ _<br />
5. Social Security Number<br />
Month Month Day DayYear Year<br />
6. Patient’s State <strong>of</strong> Residence 7. Place <strong>of</strong> Death 8. Date <strong>of</strong> Death<br />
a. ■ Hospital c. ■ Home e. ■ Other<br />
b. ■ Dialysis Unit d. ■ Nursing Home<br />
9. Modality at Time <strong>of</strong> Death<br />
a. ■ Incenter Hemodialysis b. ■ Home Hemodialysis c. ■ CAPD d. ■ CCPD e. ■ Transplant f. ■ Other<br />
■<br />
■<br />
■ ■■■ ■■■ ■■■<br />
If yes, check one <strong>of</strong> the following:<br />
a. ■ Following HD and/or PD access failure<br />
b. ■ Following transplant failure<br />
c. ■ Following chronic failure to thrive<br />
d. ■ Following acute medical complication<br />
e. ■ Other<br />
<strong>ESRD</strong> DEATH NOTIFICATION<br />
END STAGE RENAL DISEASE MEDICAL INFORMATION SYSTEM<br />
1. Patient’s Last Name First MI 2. Medicare Claim Number<br />
■ ■<br />
15. If deceased ever received a transplant:<br />
■<br />
Month Day Year<br />
b. Type <strong>of</strong> transplant received<br />
■ Living Related ■ Living Unrelated ■ Deceased ■ Unknown<br />
c. Was graft functioning (patient not on dialysis) at time <strong>of</strong> death?<br />
■ Yes ■ No ■ Unknown<br />
d. Did transplant patient resume chronic maintenance dialysis prior to death?<br />
■ Yes ■ No ■ Unknown<br />
■ ■<br />
■ ■<br />
■■ ■■ ■■■■<br />
_ _ / _ _ / _ _ _ _<br />
Month Day Year<br />
10. Provider Name and Address (Street) 11. Provider Number<br />
Provider Address (City/State)<br />
12. Causes <strong>of</strong> Death (enter codes from list on back <strong>of</strong> form)<br />
a. Primary Cause _ _ _<br />
b. Were there secondary causes?<br />
No<br />
Yes, specify: _ _ _ _ _ _ _ _ _ _ _ _<br />
C. If cause is other (98) please specify:___________________________________________________________________■■<br />
13. <strong>Renal</strong> replacement therapy discontinued prior to death: Yes No<br />
f. Date <strong>of</strong> last dialysis treatment _ _ / _ _ / _ _ _ _<br />
Month Day Year<br />
a. Date <strong>of</strong> most recent transplant _ _ / _ _ / _ _ _ _ Unknown<br />
14. Was discontinuation <strong>of</strong> renal replacement<br />
therapy after patient/family request to stop<br />
dialysis?<br />
Yes No<br />
Unknown Not Applicable<br />
16. Was patient receiving Hospice care prior<br />
to death?<br />
■ ■<br />
■ Unknown<br />
Yes No<br />
17. Name <strong>of</strong> Physician (Please print complete name) 18. Signature <strong>of</strong> Person Completing This Form Date<br />
This report is required by law (42, U.S.C. 426; 20 CFR 405, Section 2133). Individually identifiable patient information will not be<br />
disclosed except as provided for in the Privacy Act <strong>of</strong> 1974 (5 U.S.C. 5520; 45 CFR Part 5a).<br />
Form CMS-2746-U3 (10/04) Previous Versions Obsolete EF (08/2004)
<strong>ESRD</strong> DEATH NOTIFICATION FORM<br />
LIST OF CAUSES<br />
CARDIAC LIVER DISEASE<br />
23 Myocardial infarction, acute 64 Hepatitis B<br />
25 Pericarditis, incl. Cardiac tamponade 71 Hepatitis C<br />
26 Atherosclerotic heart disease 65 Other viral hepatitis<br />
27 Cardiomyopathy 66 Liver-drug toxicity<br />
28 Cardiac arrhythmia 67 Cirrhosis<br />
29 Cardiac arrest, cause unknown 68 Polycystic liver disease<br />
30 Valvular heart disease 69 Liver failure, cause unknown or other<br />
31 Pulmonary edema due to exogenous fluid<br />
32 Congestive Heart Failure GASTRO-INTESTINAL<br />
72 Gastro-intestinal hemorrhage<br />
VASCULAR 73 Pancreatitis<br />
35 Pulmonary embolus 75 Perforation <strong>of</strong> peptic ulcer<br />
36 Cerebrovascular accident including 76 Perforation <strong>of</strong> bowel (not 75)<br />
intracranial hemorrhage<br />
37 Ischemic brain damage/Anoxic encephalopathy METABOLIC<br />
38 Hemorrhage from transplant site 24 Hyperkalemia<br />
39 Hemorrhage from vascular access 77 Hypokalemia<br />
40 Hemorrhage from dialysis circuit 78 Hypernatremia<br />
41 Hemorrhage from ruptured vascular aneurysm 79 Hyponatremia<br />
42 Hemorrhage from surgery (not 38, 39, or 41) 100 Hypoglycemia<br />
43 Other hemorrhage (not 38-42, 72) 101 Hyperglycemia<br />
44 Mesenteric infarction/ischemic bowel 102 Diabetic coma<br />
95 Acidosis<br />
INFECTION<br />
33 Septicemia due to internal vascular access ENDOCRINE<br />
34 Septicemia due to vascular access catheter 96 Adrenal insufficiency<br />
45 Peritoneal access infectious complication, bacterial 97 Hypothyroidism<br />
46 Peritoneal access infectious complication, fungal 103 Hyperthyroidism<br />
47 Peritonitis (complication <strong>of</strong> peritoneal dialysis)<br />
48 Central nervous system infection (brain abscess, OTHER<br />
meningitis, encephalitis, etc.) 80 Bone marrow depression<br />
51 Septicemia due to peripheral vascular disease, 81 Cachexia/failure to thrive<br />
gangrene 82 Malignant disease, patient ever on<br />
52 Septicemia, other Immunosuppressive therapy<br />
61 Cardiac infection (endocarditis) 83 Malignant disease (not 82)<br />
62 Pulmonary infection (pneumonia, influenza) 84 Dementia, incl. dialysis dementia, Alzheimer’s<br />
63 Abdominal infection (peritonitis (not comp <strong>of</strong> PD), 85 Seizures<br />
perforated bowel, diverticular disease, gallbladder) 87 Chronic obstructive lung disease (COPD)<br />
70 Genito-urinary infection (urinary tract infection, 88 Complications <strong>of</strong> surgery<br />
pyelonephritis, renal abscess) 89 Air embolism<br />
104 Withdrawal from dialysis/uremia<br />
90 Accident related to treatment<br />
91 Accident unrelated to treatment<br />
92 Suicide<br />
93 Drug overdose (street drugs)<br />
94 Drug overdose (not 92 or 93)<br />
98 Other cause <strong>of</strong> death<br />
99 Unknown<br />
According to the Paperwork Reduction Act <strong>of</strong> 1995, no persons are required to respond to a collection <strong>of</strong> information unless it displays a valid OMB control number.<br />
The valid OMB control number for this information collection is 0938-0448. The time required to complete this information collection is estimated to average 30<br />
minutes per response, including the time to review instructions, search existing data resources, gather the data needed, and complete and review the information<br />
collection. If you have any comments concerning the accuracy <strong>of</strong> the time estimate(s) or suggestions for improving this form, please write to: CMS, Attn: PRA<br />
Reports Clearance Officer, 7500 Security Boulevard, Baltimore, Maryland 21244-1850.<br />
Form CMS-2746-U3 (10/04) Previous Versions Obsolete EF (08/2004)<br />
Death Notification form<br />
(2746), 2004 version
Death Notification form<br />
(2746), 1996 version<br />
DEPARTMENT OF HEALTH AND HUMAN SERVICES<br />
CENTERS FOR MEDICARE & MEDICAID SERVICES<br />
1. PATIENT'S LAST NAME FIRST MI 2. HEALTH INSURANCE CLAIM NUMBER<br />
3. PATIENT'S SEX<br />
a. Male b. Female<br />
7. PROVIDER NAME AND ADDRESS (CITY AND STATE)<br />
a. Hospital b. Dialysis c. Home d. Other<br />
11. CAUSES OF DEATH (Enter code form List <strong>of</strong> Causes below.)<br />
b. Were there No<br />
(1)<br />
a. Primary Cause Secondary Causes? Yes, Specify (2)<br />
CARDIAC<br />
23 Myocardial infarction, acute<br />
24 Hyperkalemia<br />
25 Pericarditis, incl. cardiac tamponade<br />
26 Atherosclerotic heart disease<br />
27 Cardiomyopathy<br />
28 Cardiac arrhythmia<br />
29 Cardiac arrest, cause unknown<br />
30 Valvular heart disease<br />
31 Pulmonary edema due to exogenous fluid<br />
VASCULAR<br />
35 Pulmonary embolus<br />
36 Cerebrovascular accident including<br />
intracranial hemorrhage<br />
37 Ischemic brain damage/Anoxic<br />
encephalopathy<br />
38 Hemorrhage from transplant site<br />
39 Hemorrhage from vascular access<br />
40 Hemorrhage from dialysis circuit<br />
41 Hemorrhage from ruptured vascular aneurysm<br />
42 Hemorrhage from surgery (not 38, 39 or 41)<br />
43 Other hemorrhage (not Codes 38-42, 72)<br />
44 Mesenteric infarction/ischemic bowel<br />
c. ■ Following chronic failure to thrive<br />
14. REMARKS<br />
4. PATIENT'S STATE OF RESIDENCE 5. DATE OF BIRTH 6. DATE OF DEATH<br />
8. PROVIDER NUMBER 9. PLACE OF DEATH (Check one)<br />
10. WAS AN AUTOPSY PERFORMED?<br />
LIST OF CAUSES<br />
INFECTION<br />
49 Septicemia, due to vascular access<br />
50 Septicemia, due to peritonitis<br />
51 Septicemia, due to peripheral vascular<br />
disease, gangrene<br />
52 Septicemia, other<br />
53 Pulmonary infection (bacterial)<br />
54 Pulmonary infection (fungal)<br />
55 Pulmonary infection (other)<br />
56 Viral Infection, CMV<br />
57 Viral Infection, Other (not 64 or 65)<br />
58 Tuberculosis<br />
59 A.I.D.S.<br />
60 Infections, other<br />
LIVER DISEASE<br />
64 Hepatitis B<br />
65 Other viral hepatitis<br />
66 Liver-drug toxicity<br />
67 Cirrhosis<br />
68 Polycystic liver disease<br />
69 Liver failure, cause unknown other<br />
a. Yes b. No<br />
(3)<br />
(4)<br />
GASTRO-INTESTINAL (see also 50)<br />
72 Gastro-intestinal hemorrhage<br />
73 Pancreatitis<br />
74 Fungal peritonitis<br />
75 Perforation <strong>of</strong> peptic ulcer<br />
76 Perforation <strong>of</strong> bowel (not 75)<br />
FORM APPROVED<br />
OMB N0. 0938-0448<br />
<strong>ESRD</strong> DEATH NOTIFICATION<br />
END STAGE RENAL DISEASE MEDICAL INFORMATION SYSTEM<br />
According to the Paperwork Reduction Act <strong>of</strong> 1995, no persons are required to respond to a collection <strong>of</strong> information unless it displays a valid OMB control number. The valid OMB control number for this information<br />
collection is 0938-0448. The time required to complete this information collection is estimated to average 17 minutes per response, including the time to review instructions, search existing data resources, gather<br />
the data needed, and complete and review the information collection. If you have any comments concerning the accuracy <strong>of</strong> the time estimate(s) or suggestions for improving this form, please write to: CMS, 7500<br />
Security Boulevard, N2-14-26, Baltimore, Maryland 21244-1850.<br />
12. FOR ALL DEATHS INDICATE YES/NO<br />
<strong>Renal</strong> replacement therapy discontinued prior to death: ■ Yes ■ No<br />
If Yes, check one <strong>of</strong> the following:<br />
a. ■ Following HD and/or PD access failure<br />
b. ■ Following transplant failure<br />
d. ■ Following acute medical<br />
complication<br />
e. ■ Other<br />
MONTH DAY YEAR MONTH DAY YEAR<br />
OTHER<br />
80 Bone marrow depression<br />
81 Cachexia<br />
82 Malignant disease, patient ever on<br />
immunosuppressive therapy<br />
83 Malignant disease (not 82)<br />
84 Dementia, incl. dialysis dementia, Alzheimer's<br />
85 Seizures<br />
86 Diabetic coma, hyperglycemia, hypoglycemia<br />
87 Chronic obstructive lung disease (COPD)<br />
88 Complications <strong>of</strong> surgery<br />
89 Air embolism<br />
90 Accident related to treatment<br />
91 Accident unrelated to treatment<br />
92 Suicide<br />
93 Drug overdose (street drugs)<br />
94 Drug overdose (not 92 or 93)<br />
98 Other identified cause <strong>of</strong> death, please specify:<br />
_____________________________________<br />
99 Unknown<br />
13. IF DECEASED RECEIVED A TRANSPLANT<br />
a. Date <strong>of</strong> most recent transplant<br />
MONTH DAY YEAR<br />
b. Was kidney functioning (patient not on dialysis) at time<br />
<strong>of</strong> death? ■ Yes ■ No ■ Unknown<br />
c. Did transplant patient resume chronic maintenance<br />
dialysis prior to death? ■ Yes ■ No<br />
15. NAME OF PHYSICIAN 16. SIGNATURE OF PERSON COMPLETING THIS FORM DATE<br />
This report is required by law (42, U.S.C. 426; 20 CFR 405, Section 2133). Individually identifable patient information will not be disclosed<br />
except as provided for in the Privacy Act <strong>of</strong> 1974 (5 U.S.C. 5520; 45 CFR Part 5a).<br />
Form CMS-2746-U3 (8-96)
DEPARTMENT OF HEALTH AND HUMAN SERVICES<br />
CENTERS FOR MEDICARE & MEDICAID SERVICES<br />
END STAGE RENAL DISEASE MEDICAL INFORMATION SYSTEM<br />
<strong>ESRD</strong> FACILITY SURVEY (DIALYSIS UNITS ONLY)<br />
DIALYSIS PATIENTS<br />
Patients Receiving Care<br />
Beginning <strong>of</strong> Survey Period<br />
Total<br />
Incenter Home Fields 01<br />
thru 02<br />
Incenter<br />
Home<br />
Patient Eligibility Status<br />
End <strong>of</strong> Survey Period<br />
Incenter Dialysis Treatments<br />
(Include Training Treatments)<br />
DIALYSIS PATIENTS AND TREATMENTS<br />
Started<br />
for first<br />
time ever<br />
01 02 03 04A<br />
04B<br />
Hemo-<br />
Dialysis<br />
Incenter<br />
Dialysis<br />
Other Hemo-<br />
Dialysis<br />
Currently<br />
enrolled<br />
in<br />
Medicare<br />
Medicare<br />
application<br />
pending<br />
TREATMENT AND STAFFING<br />
Non-<br />
Medicare<br />
Additions During Survey Period<br />
Restarted<br />
CAPD CCPD Other Fields 14<br />
thru 19<br />
Transferred<br />
from<br />
other<br />
dialysis<br />
unit<br />
Returned<br />
after<br />
transplantation<br />
Patients Receiving Care at End <strong>of</strong> Survey Period<br />
Total<br />
Self-Dialysis Training<br />
Incenter<br />
Dialysis<br />
Hemodialysis Other<br />
05A<br />
05B<br />
06A<br />
06B<br />
Hemo-<br />
Dialysis<br />
Hemodialysis Patients Dialyzing<br />
More Than 4 Times Per Week<br />
Home Dialysis<br />
FOR THE PERIOD<br />
Losses During Survey Period<br />
REMARKS REGARDING INFORMATION PROVIDED ON THIS SURVEY SHOULD BE ENTERED ON THE LAST PAGE OF THE SURVEY<br />
This report is required by law (42 USC 426; 42 CFR 405.2133). Individually identifiable patient information will not be disclosed except as provided for in the Privacy Act <strong>of</strong> 1974<br />
(5 USC 5520; 45 CFR, Part 5a).<br />
Form CMS-2744A (02/04)<br />
Deaths<br />
Recovered<br />
kidney<br />
function<br />
Received<br />
transplant<br />
Total<br />
Home<br />
Dialysis<br />
CAPD CCPD Other Fields 21<br />
thru 24<br />
Transferred<br />
to<br />
other dialysis<br />
unit<br />
14 15 16 17 18 19 20 21 22 23 24 25 26<br />
27 28 29<br />
36<br />
37<br />
30A<br />
30B<br />
Discontinued<br />
dialysis<br />
Total<br />
Patients<br />
Fields 20<br />
and 25<br />
COMPLETED BY (Name) DATE TITLE TELEPHONE NO.<br />
07A<br />
07B<br />
Setting Day Nocturnal<br />
Incenter<br />
Home<br />
31A<br />
31B<br />
08A<br />
08B<br />
09A<br />
09B<br />
10A<br />
10B<br />
11A<br />
11B<br />
Form Approved<br />
OMB No. 0938-0447<br />
Facility Physical Address<br />
(If different than mailing address) Suite/Room Street City State/Zip Code<br />
Number <strong>of</strong> Dialysis Stations: Facility Telephone: ( )<br />
Facility Ownership Type: Pr<strong>of</strong>it Non-Pr<strong>of</strong>it<br />
Facility Local/National Affiliation/Chain Information<br />
(i.e. Gambro, etc.)<br />
Types <strong>of</strong> dialysis services <strong>of</strong>fered:<br />
Incenter Hemodialysis Peritoneal Dialysis Home Hemodialysis Training<br />
Does your facility <strong>of</strong>fer a dialysis shift that starts at 5:00 p.m. or later?<br />
Yes No<br />
Patients<br />
aged 18<br />
through 54<br />
Vocational Rehabilitation<br />
Patients<br />
receiving<br />
services<br />
from Voc<br />
Rehab<br />
Patients<br />
Employed<br />
full-time or<br />
part-time<br />
32 33 34<br />
Patients<br />
attending<br />
school<br />
full-time or<br />
part-time<br />
Staffing<br />
Number <strong>of</strong> Staff Number <strong>of</strong> Open Pos.<br />
Position<br />
a. RNs<br />
b. LPN/LVNs<br />
c. PCTs<br />
d. APNs<br />
e. Dietitians<br />
f. Social Workers<br />
Full Time Part Time Full Time Part Time<br />
38 39 40 41<br />
<strong>ESRD</strong> Facility Survey<br />
(2744), 2004 version<br />
35<br />
12A<br />
12B<br />
Other<br />
(LTFU)<br />
13A<br />
13B
<strong>ESRD</strong> Facility Survey<br />
(2744), 2004 version<br />
DEPARTMENT OF HEALTH AND HUMAN SERVICES<br />
CENTERS FOR MEDICARE & MEDICAID SERVICES<br />
END STAGE RENAL DISEASE MEDICAL INFORMATION SYSTEM<br />
<strong>ESRD</strong> FACILITY SURVEY (TRANSPLANT CENTERS ONLY)<br />
PATIENTS TRANSPLANTED<br />
AND DONOR TYPE<br />
REMARKS/COMMENTS<br />
Living<br />
Related<br />
Donor<br />
KIDNEY TRANSPLANTS PERFORMED<br />
Patients<br />
who<br />
received<br />
transplant<br />
at this<br />
facility<br />
42<br />
Transplant Procedures Performed<br />
at This Facility<br />
Living<br />
Unrelated<br />
Donor<br />
Deceased<br />
Donor<br />
Currently<br />
enrolled<br />
in<br />
Medicare<br />
Total<br />
Fields 47<br />
thru 49<br />
47 48 49 50<br />
Eligibility Status <strong>of</strong> Patients<br />
Transplanted at this Facility<br />
During the Survey Period<br />
Medicare<br />
application<br />
pending<br />
FOR THE PERIOD<br />
TO BE COMPLETED BY<br />
KIDNEY TRANSPLANT CENTERS ONLY<br />
Non-Medicare<br />
U.S. Res.<br />
Dialysis<br />
COMPLETED BY (Name) DATE TITLE TELEPHONE NO.<br />
Form Approved<br />
OMB No. 0938-0447<br />
This report is required by law (42 USC 426; 42 CFR 405.2133). Individually identifiable patient information will not be disclosed except as provided for in the Privacy Act <strong>of</strong> 1974<br />
(5 USC 5520; 45 CFR, Part 5a).<br />
Form CMS-2744B (02/04)<br />
Other<br />
43 44 45 46<br />
Patients Awaiting<br />
Transplant<br />
51 52<br />
Nondialysis
access, dialysis. See vascular access<br />
ACE inhibitors<br />
acute kidney injury and 126<br />
CKD 78<br />
<strong>ESRD</strong> 215<br />
pre-<strong>ESRD</strong> 112, 114, 115<br />
acute kidney injury (AKI)<br />
dialysis and 129<br />
<strong>ESRD</strong> aft er 127–129<br />
hospitalization and<br />
126–129<br />
laboratory testing 126<br />
mortality and 128, 129<br />
patient characteristics 122, 123<br />
physician care 126<br />
prescription drug therapy and 126<br />
preventive care and 127<br />
rates 124, 125, 127<br />
acute myocardial infarction (AMI)<br />
CKD 98–103<br />
<strong>ESRD</strong> 209, 313, 315–317<br />
admission rates. See hospitalization:<br />
admissions<br />
albumin/creatinine ratio (ACR): CKD<br />
38, 40, 41, 46, 47, 53–57<br />
albumin, serum: <strong>ESRD</strong> 322, 323<br />
alpha-1 acid glycoprotein 323<br />
anemia treatment<br />
CKD 79<br />
<strong>ESRD</strong><br />
dialysis unit affi liation and 329<br />
hemoglobin levels and 199, 264<br />
at initiation 247<br />
iron therapy 264, 265<br />
in pediatric patients 303<br />
pre-<strong>ESRD</strong> 113<br />
angioplasty: <strong>ESRD</strong> 269, 278<br />
angiotensin receptor blockers (ARBs)<br />
acute kidney injury and 126<br />
CKD 78<br />
<strong>ESRD</strong> 215<br />
pre-<strong>ESRD</strong> 112, 114, 115<br />
antibiotics: <strong>ESRD</strong> 228, 229<br />
antibody induction medications:<br />
<strong>ESRD</strong> 292<br />
antimetabolites: <strong>ESRD</strong> 292<br />
arthritis: CKD 40, 41<br />
atherosclerotic heart disease (ASHD).<br />
See cardiovascular disease<br />
bacteremia/septicemia<br />
CKD 88, 89<br />
<strong>ESRD</strong><br />
hospitalization and 275<br />
vascular access and 269<br />
Bayesian hospitalization ratios: <strong>ESRD</strong><br />
334, 335<br />
Bayesian mortality ratios: <strong>ESRD</strong><br />
334, 335<br />
to Volumes One & Two <strong>of</strong><br />
the <strong>2009</strong> <strong>ADR</strong>. Pages 17–138 are<br />
found in Volume One, & pages<br />
189–354 in Volume Two.<br />
beta blockers<br />
CKD 78<br />
pre-<strong>ESRD</strong> 112, 114, 115<br />
body mass index: <strong>ESRD</strong> 230 322<br />
bypass, coronary: <strong>ESRD</strong> 278<br />
calcineurin inhibitors: <strong>ESRD</strong> 292<br />
calcium channel blockers<br />
CKD 78<br />
pre-<strong>ESRD</strong> 112, 114, 115<br />
calcium/phosphorus testing<br />
CKD 76<br />
<strong>ESRD</strong> 330<br />
pre-<strong>ESRD</strong> 110<br />
cancer: CKD 40, 66, 67, 68<br />
CAPD. See dialysis<br />
cardiac arrest. See<br />
also cardiovascular disease<br />
CKD 98–100, 102, 103<br />
<strong>ESRD</strong> 313, 314, 316, 317<br />
cardiac resynchronization therapy<br />
CKD 98, 99, 101–103<br />
<strong>ESRD</strong> 313, 315–317<br />
cardiovascular disease: CKD<br />
across datasets 66, 67<br />
albumin/creatinine ratio and 41<br />
CKD claims and 74<br />
CKD prevalence and 38<br />
CKD stage and 38, 40, 41, 68<br />
diagnoses and procedures 98–103<br />
expenditures 103, 133–135, 137<br />
glomerular fi ltration rate and 41<br />
hospitalization and 86<br />
microalbumin testing and 73<br />
nephrologist claims and 74<br />
patient distribution 37, 61<br />
cardiovascular disease: <strong>ESRD</strong><br />
diagnoses and procedures 313–317<br />
expenditures 193, 317, 341<br />
hospitalization and 200, 226, 227,<br />
274, 275, 278, 294, 306, 341<br />
modality and 313, 316, 317<br />
mortality and 209, 218, 223–225,<br />
279, 307<br />
in pediatric patients 306, 307<br />
in transplant recipients 294<br />
catheters: <strong>ESRD</strong> 245, 246, 268, 269,<br />
278, 305, 343<br />
placement rates 116, 211<br />
CBC testing: <strong>ESRD</strong> 330<br />
CCPD. See dialysis<br />
cerebrovascular accident/transient<br />
ischemic attack (CVA/TIA)<br />
CKD 66, 98, 99, 100–103<br />
<strong>ESRD</strong> 313–317<br />
cholesterol<br />
CKD 44, 45, 80, 81<br />
<strong>ESRD</strong> 248<br />
chronic obstructive pulmonary<br />
disease (COPD): CKD<br />
across datasets 66, 67<br />
albumin/creatinine ratio and 41<br />
CKD prevalence and 38<br />
CKD stage and 40, 41<br />
expenditures 133–135<br />
glomerular fi ltration rate and 41<br />
hospitalization and 86<br />
patient distribution 37, 61<br />
CKD claims<br />
prior to <strong>ESRD</strong> 108<br />
probability <strong>of</strong> 74<br />
CKD stage<br />
cardiovascular disease and 98, 99,<br />
102, 103<br />
clinical and biochemical<br />
parameters and 42, 43<br />
comorbidity and 38, 40, 44, 45<br />
expenditures and 103<br />
hospitalization and 86<br />
ICD-9-CM codes 64, 65, 68<br />
metabolic abnormalities and 68, 69<br />
survival and 102<br />
Comprehensive Dialysis Study<br />
318–323<br />
congestive heart failure (CHF)<br />
CKD 98–100, 102, 103<br />
<strong>ESRD</strong> 313, 314, 316, 317<br />
coronary angiography: CKD 97<br />
coronary revascularization<br />
CKD 98, 99, 101–103<br />
<strong>ESRD</strong> 313, 315–317<br />
C-reactive protein: <strong>ESRD</strong> 323<br />
creatinine, serum<br />
acute kidney injury 126<br />
CKD 38–40, 42, 44–47, 51–57, 76<br />
<strong>ESRD</strong> 248<br />
pre-<strong>ESRD</strong> 110<br />
cystatin C: CKD 37–39, 43–47, 51–57<br />
cystic kidney disease: <strong>ESRD</strong><br />
at initiation 208<br />
modality and 254, 256<br />
patient counts 194, 237, 239<br />
rates <strong>of</strong> <strong>ESRD</strong> due to 194, 237, 239<br />
transplantation and 212<br />
darbepoetin. See erythropoiesis<br />
stimulating agents (ESAs)<br />
DCD donors 289<br />
death. See mortality<br />
declot procedures: <strong>ESRD</strong> 269<br />
diabetes: CKD<br />
across datasets 66<br />
albumin/creatinine ratio and 41<br />
CKD claims and 74<br />
CKD prevalence and 38<br />
CKD stage and 38, 40, 41, 44, 45<br />
expenditures 133–135, 137<br />
glomerular fi ltration rate and 41<br />
microalbumin testing and 73<br />
nephrologist claims and 74<br />
patient distribution 37, 61<br />
prescription drug therapy and 81<br />
diabetes: <strong>ESRD</strong><br />
cardiovascular disease and 193<br />
comprehensive monitoring 333<br />
<strong>ESRD</strong> networks and 240<br />
expenditures 193<br />
at initiation 208, 351<br />
international comparisons 351<br />
microalbumin testing 216<br />
modality and 254, 256<br />
monitoring, recommended 263,<br />
266, 331<br />
patient counts 194, 237, 239<br />
prescription drug therapy and 215<br />
preventive care 215, 263, 266, 331<br />
rates <strong>of</strong> <strong>ESRD</strong> due to 194, 214, 219,<br />
231, 237, 239, 240<br />
survival and 277<br />
transplantation and 212, 289, 295<br />
transplant wait list and 212<br />
diabetes: general population 208, 230<br />
diabetes: pre-<strong>ESRD</strong><br />
prescription drug therapy and<br />
114, 115<br />
dialysis<br />
acute kidney injury and 129<br />
adequacy 199, 263<br />
cardiovascular disease and 313–317<br />
<strong>ESRD</strong> network populations 241<br />
expenditures 202, 203, 332, 340, 342<br />
hospitalization and 200, 274, 275<br />
infection and 274, 275<br />
international comparisons 353<br />
mortality and 201, 273, 276<br />
patient counts<br />
incident 194–196, 253, 254<br />
pediatric 194, 254, 256, 300<br />
prevalent 194–196, 256<br />
patient employment 318, 319<br />
patient rates<br />
incident 194, 196, 197, 254, 255<br />
pediatric 194, 254, 256<br />
prevalent 194, 196, 197, 256, 257<br />
patients returning from transplant<br />
195, 295<br />
patients starting or restarting<br />
195, 295<br />
physical activity 320–323<br />
survival and 201, 277<br />
transplantation and 290<br />
dialysis unit affi liation<br />
changes over time 327, 328<br />
clinical monitoring and 330<br />
hemoglobin levels and 329<br />
hospitalization ratios and 334, 335<br />
4 INDEx<br />
<strong>2009</strong> USRDS Annual <strong>Data</strong> Report<br />
Vol 2<br />
esrd<br />
5<br />
index<br />
pg 415
5<br />
index<br />
pg 416<br />
iron therapy and 329<br />
modality and 254, 256<br />
mortality ratios and 334, 335<br />
patient counts and 327, 328<br />
preventive care and 331<br />
time managed 328<br />
transfusions and 329<br />
unit counts and 328<br />
dietitian care, pre-<strong>ESRD</strong> 210, 302<br />
diuretics: CKD 79, 113<br />
donation rates, transplant 288<br />
drug therapy, prescription<br />
acute kidney injury and 126<br />
CKD 78, 79<br />
<strong>ESRD</strong> 203, 215<br />
pre-<strong>ESRD</strong> 112–115<br />
ECD donors 287, 289<br />
echocardiograms: CKD 97<br />
employment 318, 319<br />
erythropoiesis stimulating agents<br />
(ESAs): CKD 79<br />
erythropoiesis stimulating agents<br />
(ESAs): <strong>ESRD</strong><br />
expenditures 203, 332, 342<br />
hemoglobin levels and 264<br />
at initiation 247<br />
in pediatric patients 303<br />
pre-<strong>ESRD</strong> use 198<br />
weekly dose 264<br />
erythropoiesis stimulating agents<br />
(ESAs): pre-<strong>ESRD</strong> 113<br />
<strong>ESRD</strong> networks<br />
HP2010 objectives and 218, 219<br />
patient counts, growth in 240<br />
providers and 328<br />
expected remaining lifetimes: <strong>ESRD</strong><br />
276<br />
expenditures. See also Medicare<br />
expenditures<br />
expenditures: CKD<br />
cardiovascular disease 103, 133,<br />
135, 137<br />
chronic obstructive pulmonary<br />
disease 133–135<br />
diabetes 133–135, 137<br />
overall 136, 193<br />
expenditures: <strong>ESRD</strong><br />
before and aft er initiation 203<br />
cardiovascular disease and 317<br />
injectables 203<br />
inpatient 342<br />
non-Medicare 339, 340<br />
outpatient 342<br />
overall 193, 202, 203<br />
physician/supplier 342<br />
during transition to <strong>ESRD</strong> 341<br />
expenditures: pre-<strong>ESRD</strong> 135<br />
eye examinations, diabetic: <strong>ESRD</strong> 215,<br />
218, 263, 266, 331, 333<br />
ferritin testing: <strong>ESRD</strong> 330<br />
Ferrlecit: <strong>ESRD</strong> 329<br />
fi stulas, arteriovenous. See<br />
also vascular access<br />
<strong>ESRD</strong> 245, 246, 263, 268, 278, 305,<br />
343<br />
prior to <strong>ESRD</strong> 116, 211<br />
glomerular fi ltration rate, estimated<br />
(eGFR): CKD<br />
CKD prevalence and 38, 40, 53<br />
CKD screening and 38<br />
clinical and biochemical<br />
parameters and 42, 43, 52,<br />
54, 55<br />
mortality and 47<br />
patient distribution and 39, 52, 53<br />
renal function measures and 54, 55<br />
risk factors and 41<br />
glomerular fi ltration rate, estimated<br />
(eGFR): <strong>ESRD</strong><br />
at initiation 246, 248, 249, 302<br />
in pediatric patients 302<br />
in transplant recipients 291, 293<br />
glomerulonephritis: <strong>ESRD</strong><br />
<strong>ESRD</strong> networks and 240<br />
at initiation 208<br />
modality and 254, 256<br />
patient counts 194, 237, 239<br />
rates <strong>of</strong> <strong>ESRD</strong> due to 194, 237, 239,<br />
240<br />
survival and 277<br />
transplantation and 212, 289<br />
glycosylated hemoglobin (A1c): CKD<br />
HP2010 guidelines and 215, 218<br />
prescription drug therapy and 81<br />
testing 77<br />
glycosylated hemoglobin (A1c): <strong>ESRD</strong><br />
dialysis unit affi liation and 331<br />
expenditures 333<br />
guidelines, patients meeting 263,<br />
266<br />
at initiation 248<br />
recommended testing 331<br />
glycosylated hemoglobin (A1c)<br />
testing: aft er acute kidney<br />
injury 127<br />
glycosylated hemoglobin (A1c)<br />
testing: pre-<strong>ESRD</strong> 111<br />
graft failure 295<br />
graft s, arteriovenous. See<br />
also vascular access<br />
<strong>ESRD</strong> 245, 246, 268, 278, 305, 343<br />
prior to <strong>ESRD</strong> 117, 211<br />
half-lives, graft 293<br />
Healthy People 2010<br />
arteriovenous fi stula use 211, 218<br />
cardiovascular mortality rates<br />
209, 218<br />
diabetic counseling in CKD patients<br />
210, 218<br />
diabetic preventive care 215, 218<br />
incident rates 208, 218<br />
incident rates, diabetes 214, 219<br />
targets 207, 218, 219<br />
transplant recipients 213, 218<br />
transplant wait list 212, 218<br />
vaccinations 217, 218<br />
hematocrit. See anemia treatment;<br />
hemoglobin<br />
hemodialysis, home 258, 259<br />
hemoglobin A1c. See glycosylated<br />
hemoglobin (A1c)<br />
hemoglobin: CKD<br />
testing 42, 43, 55, 77<br />
hemoglobin: <strong>ESRD</strong><br />
anemia treatment and 247, 264, 329<br />
dialysis unit affi liation and 329<br />
ESA treatment and 199, 247, 264<br />
aft er initiation 247<br />
at initiation 246–249, 303<br />
monthly 199, 264<br />
overshooting <strong>of</strong> target levels 263<br />
patient distribution by 199, 249,<br />
264<br />
in pediatric patients 303<br />
pre-<strong>ESRD</strong> nephrologist care and<br />
246<br />
target levels 263<br />
hemoglobin: pre-<strong>ESRD</strong> 111<br />
hepatitis B vaccinations: <strong>ESRD</strong> 267,<br />
304, 331<br />
hepatitis C: CKD 40, 41, 68<br />
hospitalization: acute kidney injury<br />
126, 127, 128, 129<br />
hospitalization: CKD<br />
admissions 66, 68, 85–87<br />
for bacteremia/septicemia 88, 89<br />
cardiovascular disease and 86, 87<br />
chronic obstructive pulmonary<br />
disease and 86<br />
CKD stage and 68<br />
days 66, 68<br />
hypertension and 86<br />
infection and 87<br />
for pneumonia 88, 89<br />
predictors 86<br />
for urinary tract infection 88, 89<br />
hospitalization: <strong>ESRD</strong><br />
admissions 274, 275, 278<br />
all-cause 200, 274, 275, 341<br />
for bacteremia/septicemia 275<br />
cardiovascular disease and 200,<br />
226, 227, 294, 341<br />
cause-specifi c 200, 278<br />
for cellulitis 275<br />
dialysis unit affi liation and 334, 335<br />
expenditures 341<br />
fi rst-year 226, 227<br />
hospital days 274<br />
infection and 200, 226, 227, 278,<br />
294<br />
modality and 274, 275<br />
in pediatric patients 306<br />
for peritonitis 275<br />
for pneumonia 275<br />
ratios 334, 335<br />
in transplant recipients 294<br />
vascular access and 200, 274, 275,<br />
278<br />
hyperlipidemia: CKD 44, 45<br />
hypertension: CKD<br />
across datasets 66<br />
albumin/creatinine ratio and 41<br />
CKD prevalence and 38<br />
CKD stage and 38, 40, 41, 44, 45, 68<br />
glomerular fi ltration rate and 41<br />
hospitalization and 86<br />
hypertension: <strong>ESRD</strong><br />
<strong>ESRD</strong> networks and 240<br />
at initiation 208<br />
modality and 254, 256<br />
patient counts 194, 237, 239<br />
rates <strong>of</strong> <strong>ESRD</strong> due to 194, 237, 239,<br />
240<br />
survival and 277<br />
transplantation and 212, 289<br />
immunizations<br />
CKD 127<br />
<strong>ESRD</strong> 217, 219, 263, 267, 304, 331<br />
immunosuppression medications<br />
292<br />
implantable cardioverter<br />
defi brillators<br />
CKD 98, 99, 101–103<br />
<strong>ESRD</strong> 313, 315–317<br />
incidence: CKD<br />
ICD-9-CM codes and 64, 65<br />
patient rates 63<br />
incidence: <strong>ESRD</strong><br />
aft er acute kidney injury 128, 129<br />
diabetes and 214, 219, 231, 237<br />
<strong>ESRD</strong> network populations 240, 241<br />
international comparisons 347, 348,<br />
350, 351<br />
mean age and 240<br />
median age and 237<br />
modality and 194, 196, 197, 254, 255,<br />
300, 301<br />
patient counts 194, 196, 236, 237, 254<br />
pediatric 194, 236, 254, 300, 301<br />
patient rates 194, 196, 197, 208, 218,<br />
236, 237, 254, 347, 350<br />
pediatric 194, 208, 236, 254<br />
by payor 237<br />
primary diagnosis and 194, 237<br />
projections 235<br />
infection: CKD<br />
hospitalization and 87–89<br />
infection: <strong>ESRD</strong><br />
access and 269, 275<br />
hospitalization and 200, 226, 227,<br />
274, 275, 278, 294, 306<br />
mortality and 223–225, 279, 307<br />
in pediatric patients 305–307<br />
in transplant recipients 294<br />
vascular access 305<br />
INFeD: <strong>ESRD</strong> 329<br />
infl uenza vaccinations<br />
aft er acute kidney injury 127<br />
<strong>ESRD</strong> 217, 219, 263, 267, 304, 331<br />
expenditures 333<br />
injectables: <strong>ESRD</strong> 203, 342<br />
insurance coverage: <strong>ESRD</strong><br />
at initiation 255<br />
modality and 255, 257<br />
transplantation and 290<br />
iron saturation testing: <strong>ESRD</strong> 330<br />
iron therapy: <strong>ESRD</strong><br />
aft er initiation 264, 265<br />
dialysis unit affi liation and 329<br />
expenditures<br />
203, 332, 342<br />
in pediatric patients 303<br />
KDOQI targets 263<br />
Kt/V 199, 263<br />
lifetimes, expected remaining: <strong>ESRD</strong><br />
276<br />
lipid lowering agents<br />
CKD 78<br />
<strong>ESRD</strong> 215<br />
pre-<strong>ESRD</strong> 112, 114, 115<br />
lipid testing: CKD<br />
probability <strong>of</strong> 77<br />
recommended monitoring 215, 219<br />
lipid testing: <strong>ESRD</strong><br />
in diabetic patients 215, 219<br />
dialysis unit affi liation and 331<br />
expenditures 333<br />
guidelines, patients meeting 263,<br />
266, 331<br />
lipid testing: pre-<strong>ESRD</strong> 111<br />
liver disease: CKD 66, 68<br />
low density lipoprotein (LDL): CKD<br />
80, 81<br />
Medicare expenditures: CKD<br />
cardiovascular disease 135, 137<br />
chronic obstructive pulmonary<br />
disease 135<br />
diabetes 135, 137<br />
overall 135, 137, 193<br />
Medicare expenditures: <strong>ESRD</strong><br />
for clinical services 332<br />
dialysis 202, 203<br />
growth in 194<br />
home health 340<br />
hospice 340<br />
injectables 203, 332, 342<br />
inpatient 202, 340–342<br />
laboratory 332<br />
modality and 194, 202<br />
outpatient 202, 340, 342<br />
overall 202, 203, 339–341<br />
physician/supplier 202, 340, 342<br />
preventive care 333<br />
skilled nursing 340<br />
Pages 17–138 are found<br />
in Volume One, & pages<br />
189–354 in Volume Two.
during transition to <strong>ESRD</strong> 135, 341<br />
transplant 202<br />
vascular access 343<br />
metabolic abnormalities: CKD 68, 69<br />
microalbumin testing<br />
acute kidney injury 126<br />
CKD 73<br />
<strong>ESRD</strong> 216<br />
modality: <strong>ESRD</strong><br />
cardiovascular disease and 313,<br />
316, 317<br />
expenditures and 202, 340, 342<br />
aft er graft failure 295<br />
hemoglobin levels and 303<br />
home therapies 258, 259<br />
hospitalization and 274, 275<br />
international comparisons 353<br />
iron therapy and 303<br />
mortality and 201, 273<br />
patient counts 194, 195, 254, 256,<br />
300, 301<br />
patient distribution 255, 257<br />
survival and 201, 277<br />
mortality: acute kidney injury 128,<br />
129<br />
mortality: CKD<br />
albumin/creatinine ratio and 47<br />
all-cause 90, 91<br />
glomerular fi ltration rate and 47<br />
predictors <strong>of</strong> 90, 92<br />
relative risk <strong>of</strong> 91, 93<br />
aft er stroke 93<br />
mortality: <strong>ESRD</strong><br />
all-cause 201, 223, 276, 277<br />
cardiovascular disease and 209,<br />
218, 223–225, 279<br />
cause-specifi c 279<br />
dialysis unit affi liation and 334, 335<br />
fi rst-year 223–225<br />
infection and 223–225, 279<br />
modality and 201, 273, 276<br />
in pediatric patients 307<br />
PRA and 290<br />
ratios 334, 335<br />
in transplant recipients 290, 295<br />
vintage and 201, 273<br />
in wait-listed patients 287<br />
mTOR use 292<br />
nephrologist care, pre-<strong>ESRD</strong> 74, 108,<br />
210, 218, 246, 302<br />
networks. See <strong>ESRD</strong> networks<br />
NHANES population<br />
CKD prevalence and 38<br />
CKD screening sensitivity in 38<br />
CKD stage and 40, 41<br />
clinical and biochemical<br />
parameters in 42, 43, 52,<br />
54–57<br />
comorbidities in 40<br />
odds <strong>of</strong> CKD in 38<br />
patient characteristics 52<br />
patient distribution 37, 52, 53<br />
renal function measures 54–57<br />
nuclear imaging: CKD 97<br />
panel reactive antibody (PRA) 286,<br />
290<br />
parathyroid hormone (PTH) testing<br />
CKD 76<br />
<strong>ESRD</strong> 330<br />
pre-<strong>ESRD</strong> 110<br />
pediatric patients: <strong>ESRD</strong><br />
anemia treatment in 303<br />
cardiovascular disease 306, 307<br />
diabetes in 214<br />
ESA use in 303<br />
growth hormone use in 299<br />
height <strong>of</strong> 299<br />
hemoglobin in 303<br />
hospitalization 306<br />
infection in 305–307<br />
iron therapy and 303<br />
lipid levels in 302<br />
modality in 300, 301<br />
mortality 307<br />
patient counts<br />
incident 194, 236, 254, 300, 301<br />
prevalent 194, 238, 256, 300, 301<br />
patient rates<br />
incident 194, 208, 214, 236, 254<br />
prevalent 194, 238, 256<br />
pre-<strong>ESRD</strong> care 302<br />
preventive care 304<br />
survival 307<br />
transplantation in 213<br />
transplant wait list and 212<br />
vaccinations in 304<br />
vascular access in 305<br />
peripheral artery disease (PAD)<br />
CKD 66, 98, 99, 100–103<br />
<strong>ESRD</strong> 313, 314, 316, 317<br />
peritoneal dialysis catheter<br />
placement 117<br />
peritonitis: <strong>ESRD</strong> 269, 275<br />
phosphate binders<br />
CKD 79<br />
pre-<strong>ESRD</strong> 113<br />
physical activity 320, 321, 322, 323<br />
physician care<br />
acute kidney injury and 126, 127<br />
CKD 75, 103<br />
<strong>ESRD</strong> 317<br />
pre-<strong>ESRD</strong> 74, 108, 109, 210, 218,<br />
246, 302<br />
pneumococcal pneumonia<br />
vaccinations: <strong>ESRD</strong> 217, 263,<br />
267, 304, 331, 333<br />
pneumonia<br />
CKD 88, 89<br />
<strong>ESRD</strong> 275<br />
pre-<strong>ESRD</strong> care<br />
CKD claims 108<br />
dietitian care 210, 302<br />
ESA use 247, 303<br />
laboratory testing 110, 111<br />
nephrologist care 210, 218, 246, 302<br />
in pediatric patients 302<br />
physician visits 74, 108, 109, 210,<br />
218, 246, 302<br />
prescription drug therapy 112,<br />
114, 115<br />
vascular access 116, 117<br />
prescription drug therapy<br />
acute kidney injury and 126<br />
antibiotics 228, 229<br />
CKD 78, 79<br />
<strong>ESRD</strong> 203, 215, 228, 229<br />
pre-<strong>ESRD</strong> 112–115<br />
prevalence: CKD<br />
by estimated glomerular fi ltration<br />
rate 39<br />
ICD-9-CM codes and 64, 65<br />
by identifi cation method 38<br />
patient rates 62, 63<br />
prevalence: <strong>ESRD</strong><br />
diabetes and 239<br />
<strong>ESRD</strong> network populations 241<br />
international comparisons 352<br />
mean age and 240<br />
median age and 239<br />
modality and 194, 196, 197, 256, 257<br />
patient counts 194, 196, 238, 239,<br />
253, 256<br />
pediatric 194, 238, 256, 300, 301<br />
unit affi liation and 328<br />
patient rates 194, 196, 197, 238, 239,<br />
256, 347<br />
pediatric 194, 238, 256<br />
international comparisons 347, 352<br />
primary diagnosis and 194, 239<br />
projections 235<br />
preventive care: acute kidney injury<br />
127<br />
preventive care: CKD 210, 215, 219<br />
preventive care: <strong>ESRD</strong><br />
diabetic 215, 263, 266, 331<br />
expenditures 333<br />
guidelines 263<br />
in pediatric patients 304<br />
vaccinations 217, 219, 263, 267, 331<br />
projections <strong>of</strong> <strong>ESRD</strong> counts and<br />
costs 235<br />
prothrombin time: <strong>ESRD</strong> 330<br />
rates, disease. See incidence;<br />
prevalence; transplantation<br />
recombinant growth hormone:<br />
<strong>ESRD</strong> 299<br />
screening sensitivity: CKD 38, 46<br />
statins<br />
acute kidney injury and 126<br />
CKD 81<br />
stents, coronary: <strong>ESRD</strong> 278<br />
steroids: <strong>ESRD</strong> 292<br />
stroke<br />
CKD 92, 93<br />
<strong>ESRD</strong> 280, 281<br />
survival. See also mortality<br />
CKD 102<br />
<strong>ESRD</strong> 201, 277, 307, 316<br />
<strong>of</strong> pediatric patients 307<br />
in transplant recipients 201, 293<br />
transfusions, blood: <strong>ESRD</strong> 199, 329<br />
transplantation<br />
cardiovascular disease and 294,<br />
313, 316, 317<br />
DCD donors 289<br />
delayed graft function 291<br />
diabetes and 289, 295<br />
donation 288<br />
ECD donors 289<br />
ECD kidneys 287<br />
<strong>ESRD</strong> network populations 241<br />
expenditures 202, 340–342<br />
glomerular fi ltration rate and<br />
291, 293<br />
glomerulonephritis and 289<br />
graft survival 295<br />
half-lives 293<br />
hospitalization and 200, 274, 275,<br />
294<br />
hypertension and 289<br />
immunosuppression 292<br />
infection and 294<br />
international comparisons 354, 355<br />
mortality and 194, 201, 273, 276,<br />
287, 295<br />
multi-organ transplants 290<br />
patient counts<br />
incident 194, 196, 253, 254<br />
pediatric 194, 254, 256, 300<br />
prevalent 194, 196, 253, 256<br />
patient rates<br />
incident 194, 196, 197, 254<br />
pediatric 194, 254, 256<br />
prevalent 194, 196, 197, 256<br />
patients returning to dialysis<br />
from 195<br />
PRA level and 286, 290<br />
primary non-function 293<br />
prior organ transplants 290<br />
projections 235<br />
rates 285, 289<br />
retransplantation 295<br />
returning to dialysis from 295<br />
survival and 201, 277, 293<br />
wait list for 196, 212, 218, 253, 285,<br />
286, 287<br />
wait time for 196, 285, 286<br />
within three years <strong>of</strong> registration<br />
213, 219<br />
transplant options, pre-<strong>ESRD</strong><br />
information on 210<br />
triglycerides: <strong>ESRD</strong> 248<br />
units. See dialysis unit affi liation<br />
urea reduction ratio (URR) 199, 263<br />
urinary tract infection: CKD 88, 89<br />
vaccinations<br />
CKD 127<br />
<strong>ESRD</strong> 217, 219, 263, 267, 304, 331, 333<br />
vascular access<br />
current access 211, 218, 268, 269<br />
cystic kidney disease and 245<br />
diabetes and 245<br />
events and complications 269<br />
expenditures 343<br />
fi rst access 211, 263<br />
glomerulonephritis and 245<br />
hospitalization and 200, 274, 275,<br />
278<br />
hypertension and 245<br />
infection and 305<br />
at initiation 198, 245, 246, 305<br />
nephrologist care and 246<br />
in pediatric patients 305<br />
physical activity and 321<br />
pre-<strong>ESRD</strong> 116, 117<br />
pre-<strong>ESRD</strong> nephrologist care and 198<br />
Ven<strong>of</strong>er: <strong>ESRD</strong> 329<br />
vintage, patient: <strong>ESRD</strong><br />
mortality and 201, 273, 277<br />
vitamin D hormone<br />
CKD 79<br />
<strong>ESRD</strong> 203, 332, 342<br />
pre-<strong>ESRD</strong> 113<br />
wait list for transplantation 196, 212,<br />
253, 285, 286, 287<br />
wait time for transplantation 196,<br />
285, 286<br />
walking disability 280, 281<br />
4 INDEx<br />
<strong>2009</strong> USRDS Annual <strong>Data</strong> Report<br />
Vol 2<br />
esrd<br />
5<br />
index<br />
pg 417
leonardo da vinci
credits<br />
sandro botticelli<br />
andrea<br />
mantegna<br />
image<br />
mike bentley<br />
[istockphoto]<br />
vittore<br />
carpaccio<br />
carlo crivelli<br />
antonello<br />
da messina<br />
benozzo gozzoli<br />
nikolay staykov<br />
[istockphoto]<br />
albrecht dürer<br />
lorenzo lotto<br />
peter zelei<br />
[istockphoto]<br />
erhard ratdolt<br />
michael<br />
wolgemut<br />
dave smith<br />
[istockphoto]<br />
timothy<br />
woodring<br />
[istockphoto]
colophon<br />
Designed by Robert Slimbach, Adobe Jenson Pro is<br />
based on the work <strong>of</strong> Renaissance typographer Nicolas<br />
Jenson (1420–1480). Jenson is credited with creating and<br />
cutting the fi rst roman typeface, and with transforming<br />
the design <strong>of</strong> type into an art form. Th e italized letters<br />
in Jenson Pro are a nod to printer Aldus Manutius<br />
(1449/50–1515) and his skilled typecutter Francesco<br />
Griff o (1450–1518), who crafted the fi rst italic typeface.<br />
P22 da Vinci Forward, designed by Denis Kegler and<br />
Richard Kegler for the P22 type foundry, replicates<br />
the handwriting <strong>of</strong> Leonardo da Vinci (1452–1519).<br />
In his extensive notebooks da Vinci used mirror<br />
writing — handwriting which fl owed from right to left.<br />
Th e letters used as drop caps were designed by Luca<br />
Pacioli (1446/7–1517), a mathematician who taught<br />
and collaborated with da Vinci. Pacioli’s De divina<br />
proportione includes a st udy <strong>of</strong> the mathematics <strong>of</strong> the<br />
golden ratio, or golden rect angle, which is closely tied<br />
to the Fibonacci curve (disp layed on this page). Studied<br />
by ancient Greek mathematicians, defi ned in Euclid’s<br />
Elements, and long admired for its aest hetically pleasing<br />
properties, the golden ratio has been employed by artist s,<br />
architect s, and book designers since the Renaissance.<br />
fi nisce