2009 ADR v2 Atlas of ESRD - United States Renal Data System
2009 ADR v2 Atlas of ESRD - United States Renal Data System
2009 ADR v2 Atlas of ESRD - United States Renal Data System

You also want an ePaper? Increase the reach of your titles
YUMPU automatically turns print PDFs into web optimized ePapers that Google loves.
5<br />
App A<br />
pg 366<br />
REFERENCE SECTION A<br />
The Reference Tables present parallel sets <strong>of</strong> counts and rates for<br />
incidence (Section A) and December 31 point prevalence (Section B).<br />
Section B also presents annual period prevalent counts and counts<br />
<strong>of</strong> lost-to-follow-up patients. Because the U.S. population figures<br />
(shown in Reference Section M) used in the <strong>ADR</strong> include only residents<br />
<strong>of</strong> the 50 states and the District <strong>of</strong> Columbia, tables also focus<br />
on patients from these areas. Exceptions are Tables A.1, A.a, A.6, A.8,<br />
A.10, and A.c, all <strong>of</strong> which present data specific to patients in Puerto<br />
Rico and the Territories, or include these patients in the patient<br />
population. Age is computed as <strong>of</strong> the beginning <strong>of</strong> <strong>ESRD</strong> therapy.<br />
Rates in Table A.9 are calculated using the model-based method<br />
(described in the Statistical Methods section later in this appendix),<br />
and adjusted for age, race, and gender, with the 2005 national<br />
population as reference.<br />
REFERENCE SECTION B<br />
With the exception <strong>of</strong> Tables B.1, B.6, B.8, and B.10, these tables<br />
focus on patients in the 50 states and the District <strong>of</strong> Columbia. Age<br />
is calculated as <strong>of</strong> December 31. Table B.9 is constructed similarly<br />
to Table A.9.<br />
Patient characteristics<br />
Chapter Three; C tables<br />
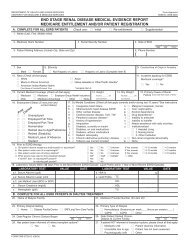
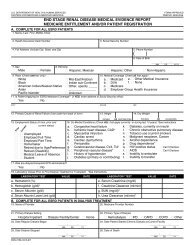
<strong>Data</strong> used in this chapter are obtained from the ME form.<br />
Figure 3.1 includes 2007 incident hemodialysis patients with ME<br />
forms. Access type and primary cause are identified from the ME<br />
form, and data exclude patients with unknown access type.<br />
Figure 3.5 includes incident hemodialysis patients who have valid<br />
EPO claims during each <strong>of</strong> the first four months after initiation.<br />
Treatment modalities<br />
Chapter Four; D tables<br />
Chapter Four and the associated reference tables describe the treatment<br />
modalities <strong>of</strong> all known <strong>ESRD</strong> patients, both Medicare and<br />
non-Medicare, who are not classified as lost-to-follow-up or having<br />
recovered renal function (RRF). The RRF event, introduced in<br />
the 2007 <strong>ADR</strong>, is defined as an event that occurs within the first 180<br />
days <strong>of</strong> <strong>ESRD</strong> initiation and lasts for at least 90 days. Unless noted<br />
otherwise, incident and point prevalent cohorts without the 60-day<br />
stable modality rule are used in the analyses. Treatment modalities<br />
are defined here as follows:<br />
4 center hemodialysis: hemodialysis treatment received at a<br />
dialysis center<br />
4 center self-hemodialysis: hemodialysis administered by the<br />
patient at a dialysis center; a category usually combined with<br />
center hemodialysis<br />
4 home hemodialysis: hemodialysis administered by the patient<br />
at home; cannot always be reliably identified in the database<br />
4 CAPD: continuous ambulatory peritoneal dialysis; usually<br />
combined with CCPD<br />
4 CCPD: continuous cycling peritoneal dialysis; usually combined<br />
with CAPD<br />
4 peritoneal dialysis: analyses typically consist <strong>of</strong> CAPD and<br />
CCPD only, unless stated otherwise<br />
4 other peritoneal dialysis: primarily intermittent peritoneal<br />
dialysis (IPD), a small category except among very young children;<br />
usually combined with unknown dialysis and uncertain<br />
dialysis to form an other/unknown dialysis category<br />
4 uncertain dialysis: a period in which the dialysis type is<br />
unknown or multiple modalities occur but none last 60<br />
days; usually combined with other peritoneal dialysis (IPD)<br />
and unknown dialysis to form an other/unknown dialysis<br />
category<br />
4 unknown dialysis: a period in which the dialysis modality<br />
is not known (e.g. when dialysis sessions are performed in<br />
a hospital); usually combined with other peritoneal dialysis<br />
(IPD) and uncertain dialysis to form an other/unknown<br />
dialysis category<br />
4 renal transplantation: a functioning graft from either a living<br />
donor (a blood relative or other living person) or a cadaveric<br />
donor<br />
4 death: a category not appearing in the year-end modality<br />
tables, which report only living patients, but used as an outcome<br />
(e.g. in tables showing living patients followed for a<br />
period <strong>of</strong> time for their modality treatment history)<br />
Modality and provider characteristics are presented in Figures 4.3<br />
and 4.6. For a description <strong>of</strong> the provider data used in these figures,<br />
please see the discussion <strong>of</strong> Chapter Ten. All provider-related figures<br />
include only dialysis patients. Figures 4.4 and 4.7 show modality<br />
and payor information, while Tables c–d and Figures 4.9–14 provide<br />
a closer look at the demographic and geographic variations <strong>of</strong><br />
home hemodialysis patients.<br />
Rates by age are adjusted for gender and race, rates by gender are<br />
adjusted for age and race, rates by race and ethnicity are adjusted<br />
for age and gender, and rates by primary diagnosis are adjusted for<br />
age, gender, and race.<br />
REFERENCE SECTION D<br />
Reference Section D is divided into four sections. The first, Tables<br />
D.1–11 and D.15–16, provides counts and percentages — by demographics,<br />
geographic location, and treatment modality — <strong>of</strong> incident<br />
and prevalent patients alive at the end <strong>of</strong> each year. Age is computed<br />
as <strong>of</strong> the start <strong>of</strong> <strong>ESRD</strong> for incident patients, and as <strong>of</strong> December 31<br />
for point prevalent patients.<br />
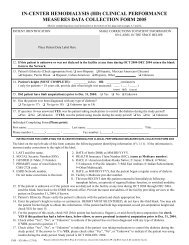
Table D.12 shows modality at day 90 and two years after first<br />
service for all incident Medicare patients beginning renal replacement<br />
therapy from 2003 to 2005. The 90-day rule is used to exclude<br />
patients who die during the first 90 days <strong>of</strong> <strong>ESRD</strong>, and age is computed<br />
as <strong>of</strong> the first <strong>ESRD</strong> service date.<br />
The third section, Tables D.13–14, presents counts <strong>of</strong> prevalent<br />
patients alive at the end <strong>of</strong> each year, by <strong>ESRD</strong> exposure time and<br />
modality. Table D.13 shows counts by the number <strong>of</strong> years <strong>of</strong> <strong>ESRD</strong>,<br />
while Table D.14 presents counts by the number <strong>of</strong> years on the end<strong>of</strong>-year<br />
treatment modality. For the duration <strong>of</strong> <strong>ESRD</strong> exposure, zero<br />
should be read as less than one year, one as at least one full year but<br />
less than two, and so on.<br />
The fourth section, Tables D.17–22, presents counts <strong>of</strong> incident<br />
and prevalent patients alive at the end <strong>of</strong> selected years (i.e. 1999,<br />
2003, 2007), by demographic characteristics, payor category, and<br />
treatment modality. Again, age is computed as <strong>of</strong> the start <strong>of</strong> <strong>ESRD</strong><br />
for incident patients, and as <strong>of</strong> December 31 for point prevalent<br />
patients. The definitions <strong>of</strong> payor categories can be found under<br />
“<strong>Data</strong>base definitions” at the beginning <strong>of</strong> this appendix.<br />
Clinical care & preventive health<br />
Chapter Five<br />
In Figure 5.1, for both Kt/V measurements, 2005 <strong>ESRD</strong> CPM data<br />
are used to calculate a mean Kt/V value for each patient from the<br />
1–3 values present for each, and the percent <strong>of</strong> patients with a mean<br />
Kt/V over a certain threshold is determined. For prevalent hemo-