2009 ADR v2 Atlas of ESRD - United States Renal Data System
2009 ADR v2 Atlas of ESRD - United States Renal Data System
2009 ADR v2 Atlas of ESRD - United States Renal Data System

Create successful ePaper yourself
Turn your PDF publications into a flip-book with our unique Google optimized e-Paper software.
5<br />
App A<br />
pg 378<br />
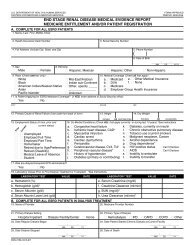
The number <strong>of</strong> cardiovascular conditions (congestive heart failure,<br />
atherosclerotic heart disease, other cardiac disease, cerebrovascular<br />
disease, peripheral vascular disease), along with data on<br />
diabetes as primary cause <strong>of</strong> renal failure, COPD, and hemoglobin<br />
and serum albumin values, are obtained from the ME form.<br />
Employment status is obtained from question 73 <strong>of</strong> the Patient<br />
Questionnaire: “Are you now working for pay (receiving taxable<br />
wages)? If yes, full-time or part-time?”<br />
Information on the kind <strong>of</strong> work employed patients were doing<br />
is obtained from question 74 <strong>of</strong> the Patient Questionnaire: “If yes<br />
(now working for pay), what kind <strong>of</strong> work are you doing now?” Jobs<br />
were classified into occupational status categories 1 (high) to 7 (low)<br />
using the Hollingshead occupational status scale.<br />
<strong>Data</strong> on patient-reported ability to work is obtained from question<br />
72 <strong>of</strong> the Patient Questionnaire: “Are you now able to work<br />
for pay?”<br />
<strong>Data</strong> on receipt <strong>of</strong> disability income is obtained from question 75<br />
<strong>of</strong> the Patient Questionnaire: “Are you receiving disability benefits<br />
(SSDI, SSI) from Social Security?”<br />
The Adjusted Activity Score is obtained from responses to the<br />
94-item Human Activity Pr<strong>of</strong>ile, reproduced for use in the CDS with<br />
permission <strong>of</strong> the author. The Adjusted Activity Score is defined as a<br />
measure <strong>of</strong> usual daily activities, and is interpreted as providing the<br />
best estimate <strong>of</strong> an individual’s average level <strong>of</strong> energy expenditure.<br />
PHYSICAL ACTIVITY & LABORATORY MARKERS OF<br />
NUTRITION & INFLAMMATION AMONG CDS PARTICIPANTS<br />
Participants in the CDS were asked about physical activity using the<br />
94-item Human Activity Pr<strong>of</strong>ile (HAP), which has been previously<br />
shown to correlate with physical activity measured by accelerometry<br />
and with physical performance among patients with end-stage renal<br />
disease (Johansen et al.). The HAP provides a survey <strong>of</strong> activities<br />
across a broad range <strong>of</strong> energy requirements. The activity items are<br />
ranked based on estimated metabolic equivalents, i.e., the approximate<br />
amount <strong>of</strong> oxygen consumed by an average person at rest, with<br />
item 1 being the activity requiring the least energy expenditure and<br />
item 94 requiring the greatest energy expenditure. For each item, the<br />
respondent indicates whether he or she is still doing, has stopped<br />
doing, or never did the activity. The Maximum Activity Score (MAS)<br />
is the highest oxygen-demanding activity that the respondent still<br />
performs. The Adjusted Activity Score (AAS) is determined by subtracting<br />
from the MAS the total number <strong>of</strong> activities the respondent<br />
has stopped doing that have numbers lower than the MAS. The AAS<br />
is interpreted as a measure <strong>of</strong> usual physical activity level.<br />
Other variables are obtained from the CDS or from the ME form<br />
(2728). Vascular access type was ascertained directly from CDS participants.<br />
The Medical Outcomes Study Short Form 12-item survey<br />
(SF-12) was administered in its entirety as part <strong>of</strong> the CDS Patient<br />
Questionnaire. Self-reported physical functioning was assessed<br />
using the Physical Component Summary (PCS) score <strong>of</strong> the SF-12.<br />
Under the direction <strong>of</strong> the Nutrition Special Studies Center,<br />
serum specimens were obtained in conjunction with routine<br />
monthly laboratory studies for the subset <strong>of</strong> CDS participants<br />
chosen to participate in the Nutrition substudy. One 15 ml tube<br />
<strong>of</strong> blood was drawn for serum isolation and then shipped on dry<br />
ice via overnight delivery to the laboratory in Davis, California.<br />
Serum was separated upon receipt and aliquoted for analysis and<br />
for storage in a repository. One aliquot was analyzed for C-reactive<br />
protein (CRP), prealbumin, albumin, and alpha 1 acid glycoprotein<br />
(AAG) by rate nephelometry using a Beckmann Array nephelometer.<br />
All nephelometric measures were made in duplicate in<br />
each <strong>of</strong> two optical systems. The average <strong>of</strong> these values is used<br />
for calculations.<br />
Physical activity level is compared between or among groups<br />
using Mann-Whitney U tests for two groups or Kruskal Wallis<br />
one-way analysis <strong>of</strong> variance for three or more groups. Differences<br />
reported in the text are based on a two-sided p-value <strong>of</strong> less than 0.05.<br />
Providers<br />
Chapter Ten; J tables<br />
The USRDS continues to use its new definition <strong>of</strong> a dialysis chain.<br />
Throughout the atlas and in Reference Section J, we now define a<br />
chain-affiliated unit as one <strong>of</strong> a group <strong>of</strong> 20 or more freestanding<br />
dialysis units which are owned or operated by a corporation at the<br />
end <strong>of</strong> a year. The affiliation category <strong>of</strong> “small dialysis organization,”<br />
or SDO, includes all organizations meeting our definition <strong>of</strong><br />
a chain but having 20 or more but fewer than 100 units.<br />
In previous years, chain affiliation was determined from the<br />
“Provider Name” field <strong>of</strong> the CMS Annual Facility Survey, the “Chain<br />
Name” field <strong>of</strong> the CMS Dialysis Facility Compare database, and the<br />
“Chain Organization Name” field <strong>of</strong> the CMS Independent <strong>Renal</strong><br />
Facility Cost Report. Currently, however, it is determined solely<br />
from the “Provider Name” field <strong>of</strong> the Facility Survey.<br />
<strong>Data</strong> are obtained from the Facility Survey (for 1988–2007), the<br />
Cost Report (Form 265-94, for 1994–2000), the CMS Dialysis Facility<br />
Compare (DFC) database (for 2001–2007), and the CDC National<br />
Surveillance <strong>of</strong> Dialysis-Associated Diseases in the <strong>United</strong> <strong>States</strong><br />
(for 1988–2002, excluding 1998, when the CDC did not conduct a<br />
survey). The CDC discontinued the National Surveillance <strong>of</strong> Dialysis-<br />
Associated Diseases after 2002. In 2007, there were 5,240 facilities<br />
in the Facility Survey.<br />
A facility’s hospital-based or freestanding status is determined<br />
from the third and fourth digits <strong>of</strong> the provider number assigned<br />
to each dialysis unit by CMS. For years prior to 2002, we determine<br />
facility pr<strong>of</strong>it status through the ownership type field on the<br />
CMS survey. In the 2002 CMS survey the pr<strong>of</strong>it status variable was<br />
dropped, so for that and subsequent years we use the pr<strong>of</strong>it status<br />
field <strong>of</strong> the DFC. There are, however, a small number <strong>of</strong> facilities<br />
in the CMS survey that are not in the DFC database; these facilities<br />
have an unknown pr<strong>of</strong>it status, and are omitted from any graph<br />
showing pr<strong>of</strong>it status.<br />
For provider-specific analyses, unless otherwise specified, the<br />
dialysis provider for individual patients is assigned as follows: for<br />
prevalent studies, the patient is assigned to the facility providing<br />
dialysis services at the prevalent date, as determined from the treatment<br />
history. For incident analyses, the patient is assigned to the<br />
facility providing dialysis services at the incident date, as determined<br />
from the treatment history. In either case, if provider data<br />
are unavailable from the patient’s treatment history, the patient is<br />
assigned to “unknown provider” or excluded, depending on the<br />
analysis.<br />
ANEMIA TREATMENT & VASCULAR ACCESS<br />
Figure 10.5 includes period prevalent dialysis patients in 2002 and<br />
2007. <strong>Data</strong> for mean hemoglobin include only patients with valid<br />
EPO claims. A mean is calculated for each patient from all valid<br />
claims during the year. Chain affiliation is defined at the final patient<br />
claim <strong>of</strong> the year.<br />
Figure 10.6 illustrates the prevalence <strong>of</strong> IV iron administration,<br />
by dialysis unit affiliation and product type. The cohort consists <strong>of</strong><br />
patients initiating <strong>ESRD</strong> therapy at least 90 days prior to the start<br />
<strong>of</strong> 2007, and receiving dialysis on December 31, 2006. All patients