Restek Advantage - LECO Australia
Restek Advantage - LECO Australia
Restek Advantage - LECO Australia

You also want an ePaper? Increase the reach of your titles
YUMPU automatically turns print PDFs into web optimized ePapers that Google loves.
2012<br />
Our expertise, experience, and enthusiasm is your <strong>Advantage</strong>.<br />
ADVANTAGE<br />
New Approaches for Increasing<br />
Analytical Sensitivity<br />
• 1,4-dioxane at 5.0 ppt in water<br />
via large volume injection in an<br />
unmodified splitless GC inlet…pp. 6–7<br />
• Lower detection limits without<br />
dilution using extended calibration<br />
range for semivolatiles…pp. 8–9<br />
• QuEChERS with LC-MS/MS<br />
and GCxGC-TOFMS for<br />
comprehensive pesticide<br />
residue testing…pp. 12–13<br />
Also in this issue<br />
Sulfonamide residues via HPLC & UHPLC…pp. 14–15<br />
Column/mobile phase selection for LC-MS…pp. 18–19<br />
Trace impurities in petroleum gases…pp. 20–21<br />
www.restek.com
<strong>Restek</strong> Connections<br />
In This Issue<br />
Connections . . . . . . . . . . . . . . . . . . . . . 2–3<br />
Hot Topics . . . . . . . . . . . . . . . . . . . . . . . 4–5<br />
Technical Articles . . . . . . . . . . . . . . .6–23<br />
Lowering Detection Limits for 1,4-Dioxane<br />
in Drinking Water Using LVSI in an<br />
Unmodified Splitless GC Inlet . . . . . . . . . . . . 6–7<br />
Quantify Semivolatiles Down to 0.5 ng<br />
with an Extended Calibration Range . . . . . 8–9<br />
It’s A Matter of Degrees, but Do Degrees<br />
Really Matter? An Observation of GC Inlet<br />
Temperature Profile and Variability . . . . . . 10–11<br />
Comprehensive Pesticide Residue<br />
Monitoring in Foods Using QuEChERS,<br />
LC-MS/MS, and GCxGC-TOFMS . . . . . . . . . 12–13<br />
Increase Data Quality for Sulfonamides by<br />
HPLC and UHPLC Using Unique Biphenyl<br />
Column Selectivity . . . . . . . . . . . . . . . . . . . . . 14–15<br />
Fast, Robust LC-MS/MS Method for<br />
Multiple Therapeutic Drug Classes . . . . . . 16–17<br />
Find the Best LC-MS Column/Mobile Phase<br />
Combination Using USLC® Columns and a<br />
Scouting Gradient . . . . . . . . . . . . . . . . . . . . . . . . 18–19<br />
Improve Trace Analysis of Polar Impurities<br />
in Petroleum Gases Using Higher Sample<br />
Capacity Alumina MAPD Columns . . . . . 20–21<br />
Editorial: Matrix Effects in Multi-Residue Pesticide<br />
Analysis When Using Liquid Chromatography-<br />
Tandem Mass Spectrometry . . . . . . . . . . . . . . 22–23<br />
Reflections from the Bench<br />
One night, I stopped by the <strong>Restek</strong><br />
Innovations Laboratory to grab something<br />
from my office and stood for a moment<br />
in the dark. Looking out over the sea of<br />
LED lights and listening to the whine of<br />
pumps and cooling fans that is so familiar<br />
to GC and LC chemists around the world,<br />
I was reminded of my time working in an<br />
environmental lab. When the work was done and the instruments were up and running, I<br />
would shut off the lights and reflect for a moment on the day. But, my trip down memory<br />
lane was interrupted by the sound of an autosampler moving a vial into position—most<br />
likely Chris Rattray’s instrument running a calibration curve for 1,4-dioxane by LVSI (page<br />
6) or a semivolatile analysis with an extended calibration range (page 8). After all, with the<br />
aid of autosamplers, the lab never sleeps. Case in point, this <strong>Advantage</strong> is packed full of<br />
data generated at all hours of the day and night.<br />
Our latest issue brings you a wide breadth of applications, like the ones mentioned above,<br />
produced by dedicated, passionate chemists like yourself. Julie Kowalski, Sharon Lupo<br />
and Amanda Rigdon use LC-MS/MS techniques for work ranging from pesticide analysis<br />
to therapeutic drug monitoring. Rick Lake and Ty Kahler help you find the best LC-MS column,<br />
then use it to analyze sulfonamides. If you use a GC, Scott Grossman will shatter your<br />
perceptions of injection ports. We also explore matrix effects in complex samples both<br />
with a guest editorial and with Jack Cochran’s and Julie Kowalski’s discussion of pesticide<br />
recoveries using LC-MS/MS and GCxGC-TOFMS.<br />
There’s something for everyone in this <strong>Advantage</strong>. We hope it helps you reach that place<br />
where you can turn the lights off and enjoy the ambience of the laboratory.<br />
About <strong>Restek</strong> Corporation<br />
A leading innovator of chromatography solutions<br />
for both LC and GC, <strong>Restek</strong> has been developing<br />
and manufacturing columns, reference standards,<br />
sample preparation materials, accessories, and<br />
more since 1985. We provide analysts around the<br />
world with products and services to monitor the<br />
quality of air, water, soil, food, pharmaceuticals,<br />
chemicals, and petroleum products. Our experts<br />
enjoy diverse areas of specialization in chemistry,<br />
chromatography, engineering, and related fields<br />
as well as close relationships with government<br />
agencies, international regulators, academia, and<br />
instrument manufacturers.<br />
Patents and Trademarks<br />
<strong>Restek</strong> patents and trademarks are the property<br />
of <strong>Restek</strong> Corporation. Other trademarks appearing<br />
in <strong>Restek</strong> literature or on its website are the<br />
property of their respective owners. The <strong>Restek</strong><br />
registered trademarks used here are registered in<br />
the United States and may also be registered in<br />
other countries.<br />
Cheers!<br />
Chris English<br />
Laboratory Manager,<br />
Innovations Group<br />
You Have Opinions... And We Want Them<br />
We chemists are an opinionated bunch, so the odds are good that you have<br />
some thoughts about the <strong>Restek</strong> <strong>Advantage</strong>. Love it? Hate it? Want to see<br />
something different in the next issue? Maybe you have a response to one of our<br />
technical articles? Whatever you have to say, let’s hear it! Email your comments to<br />
advantage@restek.com and you may even see them in an upcoming issue.<br />
2<br />
www.restek.com | 1-800-356-1688 or 1-814-353-1300 | Feedback? E-mail advantage@restek.com
Another <strong>Restek</strong> Success Story:<br />
Maxxam Analytics Group<br />
Receives Award After Switching<br />
to the Rtx®-Dioxin2 Column<br />
Maxxam Analytics recently presented a<br />
Kaizen award to their High Resolution Mass<br />
Spectrometry (HRMS) Department at the<br />
Mississauga laboratory in Ontario. The award recognized<br />
process improvements made possible<br />
by switching to a <strong>Restek</strong> Rtx®-Dioxin2 column to<br />
increase instrument capacity.<br />
The Mississauga lab analyzes drinking water for<br />
2,3,7,8-TCDD only using EPA Method 1613. They Maxxam Analytics’ HRMS team (left to right):<br />
had been analyzing these short-list samples on the Owen Cosby, Kay Shaw, and Angel Guerrero.<br />
same instrument used for full-list PCDD/PCDF and<br />
PCB congeners, which limited their capacity. Maxxam had also confirmed the presence of<br />
2,3,7,8-TCDF using a different column on another instrument. Since the Rtx®-Dioxin2 column<br />
provides isomer specificity for both 2,3,7,8-TCDD and 2,3,7,8 TCDF and has high temperature<br />
stability, the HRMS group explored using it for both 2,3,7,8-TCDD and 2,3,7,8-TCDF.<br />
“Using the Rtx®-Dioxin2 column…<br />
By moving to an Rtx®-Dioxin2 column (cat.# 10758),<br />
they optimized the TCDD-only analysis and reduced<br />
we shortened run times, reduced run time from 50 to 30 minutes! (EPA 1613 requires<br />
instrument downtime and column a minimum retention time for the labeled 1,2,3,4-<br />
changes, and increased instrument TCDD of 25 minutes, so results were close to ideal.)<br />
The analysis time for the TCDF confirmation analysis<br />
capacity for our full-list samples.”<br />
was not significantly reduced, but run cycle time was<br />
-Owen Cosby, Maxxam Analytics decreased by taking advantage of the column’s 340 °C<br />
thermal stability, resulting in lower estimated detection<br />
limits and less bleed compared to the columns they had used previously. In addition,<br />
the higher maximum programmable temperature allows analysts to use high-temperature<br />
holds and reduce the potential for carryover contamination.<br />
Questions From You<br />
Our Technical Service specialists field an<br />
astounding variety of questions from our<br />
customers. Today’s featured topic is a <strong>Restek</strong><br />
innovation that extends the life of your inlet<br />
seal: the reversible Flip Seal inlet seal.<br />
Q: Are there recommended GC<br />
inlet liner types for use with Flip<br />
Seal inlet seals?<br />
A: <strong>Restek</strong> recommends a 4 mm ID Sky<br />
single taper liner with wool (cat.# 23303.1)<br />
for splitless injections and a 4 mm ID Sky<br />
Precision® liner with wool (cat.# 23305.1)<br />
for split injections. The thoroughly deactivated<br />
Sky wool provides excellent sample<br />
homogenization during either splitless or split<br />
injection, which increases repeatability and<br />
accuracy. In addition, wool keeps liquid sample<br />
from being deposited on the inlet seal,<br />
where contact with hot metal can degrade<br />
thermally sensitive compounds, or where less<br />
volatile, higher molecular weight compounds<br />
of interest can be lost. Wool also protects the<br />
GC column from non-volatile sample “dirt,”<br />
preserving the column’s chromatographic<br />
performance, especially for difficult to analyze<br />
compounds.<br />
We just released a full FAQ on the Flip Seal<br />
inlet seal! The answers to all of your questions<br />
can be found at www.restek.com/flipFAQ<br />
- Jack Cochran<br />
Director of New Business & Technology<br />
Wrestling with a question of your own?<br />
Call 1-800-356-1688, ext. 4, or e-mail<br />
support@restek.com today!<br />
Since the lab was able to run both the TCDDonly<br />
and TCDF confirmation analyses on the<br />
Rtx®-Dioxin2 column, they were able to use<br />
the same instrument for both analyses, allowing<br />
more full-list dioxin and PCB samples to<br />
be analyzed on the other instrument. Learn<br />
more about Rtx®-Dioxin2 columns at<br />
www.restek.com/dioxin2<br />
Do you have a <strong>Restek</strong> success<br />
story to share?<br />
E-mail advantage@restek.com<br />
or call your <strong>Restek</strong> representative!<br />
<strong>Restek</strong> is Expanding!<br />
In the past year, we were fortunate enough to welcome dozens of talented employee-owners<br />
to <strong>Restek</strong> as we continue to grow and fill newly created positions. We wanted to specifically<br />
highlight a few of them here since you will likely meet them at events, talk to them on the<br />
phone, or read one of their articles in this issue. We’re looking forward to working with them<br />
and developing new analytical solutions for you!<br />
Scott Adams | GC Accessories Product Marketing<br />
Manager<br />
Eisho Beythaji | Pacific Northwest Field Sales<br />
Representative<br />
Paul Connolly | LC Product Marketing Manager<br />
Chris Denicola | LC Market Research Manager<br />
Thi Do | Southwest Field Sales Representative<br />
Jason Herrington | Air Innovations Chemist<br />
Tim Hines | VP of Operations<br />
Ravindra Rane | New England Field Sales<br />
Representative<br />
Chris Rattray | Environmental Innovations Chemist<br />
Nancy Schwartz | Technical Service Specialist<br />
Charles “Chas” Simons | Technical Service Manager<br />
Trent Sprenkle | Corporate Account Representative<br />
Interested in joining our team?<br />
Check out www.restek.com/jobs today!<br />
www.restek.com | 1-800-356-1688 or 1-814-353-1300 | Feedback? E-mail advantage@restek.com 3
Hot Topics<br />
All the Right Tools—All in One Box<br />
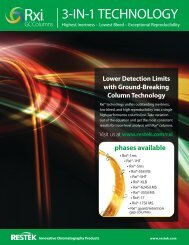
<strong>Restek</strong>’s Ultra Selective Liquid<br />
Chromatography (USLC®) column<br />
set represents the widest range of<br />
reversed phase selectivity available with<br />
just four stationary phases. It simplifies<br />
column choice for fast, effective method<br />
development—and the new USLC®<br />
toolbox makes things even easier!<br />
A USLC® method development toolbox<br />
contains all four USLC® stationary phases<br />
in one convenient package. Available for<br />
UHPLC (1.9 µm) and HPLC (3 or 5 µm) in 50, 100, or 150 mm lengths,<br />
this must-have companion for method developers also includes a<br />
selection guide to help ensure that you always choose the right<br />
column the first time.<br />
Read more about USLC® technology and order your lab a method<br />
development toolbox today by calling 1-814-353-1300, ext. 3, or<br />
contacting your <strong>Restek</strong> representative.<br />
<strong>Restek</strong> USLC® Columns:<br />
Choose Columns Fast. Develop Methods Faster.<br />
www.restek.com/uslc<br />
Pollution, Pansteatitis & Dead Crocs<br />
Fast, Definitive Data for BAC Testing<br />
New Rtx®-BAC Plus 1 and Rtx®-BAC Plus 2 columns give you definitive data<br />
in a fast, 2-minute analysis. Optimized column selectivities guarantee<br />
baseline resolution of ethanol, internal standards, and frequently<br />
encountered interferences while robust column chemistry ensures<br />
longer column lifetime and exceptional accuracy. Every one of these<br />
new BAC columns is thoroughly quality tested, and they are ideal for<br />
dual-column confirmation required when using GC-FID.<br />
We also now offer BAC resolution control standards with either tertbutanol<br />
or 1-propanol internal standard. These check mixes are used<br />
to verify the retention time for each compound normally included in<br />
a blood alcohol test as well as to confirm that the analytes are well<br />
resolved and do not interfere with one another.<br />
New Rtx®-BAC Plus 1 and Rtx®-BAC Plus 2<br />
columns and check mixes provide reliable,<br />
consistent results quickly, allowing increased<br />
sample throughput for blood alcohol testing.<br />
You can find them all at<br />
www.restek.com/bacplus<br />
Photo by Jack Cochran<br />
South Africa is home to an abundance of impressive wildlife,<br />
including a large population of Nile crocodiles in Kruger National<br />
Park. Unfortunately, these reptiles have recently experienced<br />
massive die-offs due to pansteatitis, which hardens body fat and<br />
renders it unavailable as an energy source during metabolism.<br />
The problem is complex, but pollution from PCBs, pesticides,<br />
industrial chemicals, and pharmaceuticals is suspected to be<br />
a contributing factor. Using GCxGC-TOFMS, Roger Dixon of<br />
the South African Police Service recorded approximately 1,600<br />
anthropogenic organic compounds in the waters of the Olifants<br />
River within Kruger Park. Additional stressors may include<br />
increased sediment, restricted water flow, and algal blooms related<br />
to the Massingir Dam upstream in neighboring Mozambique.<br />
The Consortium for the Restoration of the Olifants Catchment<br />
(CROC) hopes to slow the disappearance of crocodiles from the<br />
park by improving water quality, and our own Jack Cochran is<br />
keeping close tabs on this dire situation. For links to related sites<br />
and updates, visit blog.restek.com and search “Kruger.”<br />
Coming Soon to a City Near You!<br />
Tradeshows, symposia, and conferences are great ways for us to meet<br />
you face-to-face and share our latest breakthroughs. Here are some of the<br />
upcoming highlights of our 2012 event tour:<br />
Aug 26–31 | Dioxin | Cairns, Queensland, <strong>Australia</strong><br />
Aug 30–31 | UKIAFT | Belfast, Northern Ireland<br />
Sept 30–Oct 3 | AOAC | Las Vegas, NV, USA<br />
Oct 1–5 | COLACRO XIV | Florianópolis, Santa Catarina, Brazil<br />
Oct 7–10 | ChromSAAMS 2012 | Dikhololo Game Reserve, South Africa<br />
Oct 16–17 | Gulf Coast Conference | Galveston, TX, USA<br />
Nov 12–15 | EAS | Somerset, NJ, USA<br />
Consult www.restek.com/events for more information and be sure to<br />
pay us a visit!<br />
4<br />
www.restek.com | 1-800-356-1688 or 1-814-353-1300 | Feedback? E-mail advantage@restek.com
More Labs Required to Source CRMs<br />
An increasing number of laboratories<br />
worldwide are being required to use<br />
certified reference materials (CRMs),<br />
which can only be manufactured<br />
and QC tested at an ISO-accredited<br />
lab. The U.S. Department of Defense<br />
insists on them, as do numerous other<br />
government agencies across North America, Europe, and Asia. UKAS<br />
and A2LA also mandate you use CRMs to gain ISO accreditation.<br />
In just a few years, CRM requirements have spread at an incredible<br />
rate, so if you haven’t been affected yet, you may be soon.<br />
Transitioning to CRMs doesn’t need to be difficult or costly. We are<br />
proud to announce that <strong>Restek</strong>’s reference standard manufacturing<br />
and QC testing laboratories in Bellefonte, PA, are ISO Guide 34 and<br />
17025 accredited! That means you can buy the same <strong>Restek</strong><br />
reference standards you trust for the same price while satisfying<br />
CRM regulations. And, our custom formulations are also covered!<br />
Even if you are not required to use CRMs, you can still benefit from<br />
the outstanding product quality and customer service needed to<br />
meet strict ISO guidelines. Learn more about our quality credentials<br />
and to view certificates (including scopes of accreditation) at<br />
www.restek.com/iso<br />
Brian Jones Honored With Plenary<br />
Talk at ISCC / Riva 2012<br />
If you didn’t make the trek to Italy for the<br />
36th International Symposium on Capillary<br />
Chromatography (ISCC) / Riva 2012,<br />
you missed an enlightening talk by <strong>Restek</strong><br />
Senior Research Chemist Brian Jones.<br />
He offered attendees a rare, behind-thescenes<br />
look at an exciting surface science<br />
technology that holds the promise of<br />
creating well-characterized and exceptionally<br />
inert surfaces, as well as being used<br />
in many other potential applications. Still<br />
in development at <strong>Restek</strong>’s R&D lab, this patent-pending technique<br />
greatly improves the chemical and physical properties of surfaces<br />
compared to current state of the art, making them better suited for<br />
tomorrow’s challenges of steadily decreasing detection limits and<br />
increasing sample complexity.<br />
We wanted not only to recognize Brian, Valerie Strom, Tom Kane,<br />
Scott Grossman, and the rest of the team for their impressive work,<br />
but also to congratulate Brian for being honored with the invitation<br />
to speak at Riva!<br />
<strong>Restek</strong> Sponsors Multidimensional<br />
Chromatography & GCxGC Workshop<br />
The speakers at this year’s MDGC workshop.<br />
Earlier this year, we attended the 3rd Multidimensional Chromatography<br />
and GCxGC Workshop at the Ontario Ministry of the<br />
Environment (MOE) in Ontario, Canada. Three of our chemists—Jack<br />
Cochran, Julie Kowalski, and Michelle Misselwitz—were privileged to<br />
speak due to their extensive work with GCxGC.<br />
Initially hosted at the Centers for Disease Control (CDC) in Atlanta,<br />
Georgia, USA, this growing event serves as a means for international<br />
GCxGC experts to collaborate on cutting-edge techniques. Jack<br />
Cochran (<strong>Restek</strong>), Eric Reiner (MOE, front center in blue shirt above),<br />
Frank Dorman (The Pennsylvania State University), Jef Focant<br />
(University of Liège), and Don Patterson, Jr. (CDC) were instrumental in<br />
organizing the inaugural meeting and producing the first publication<br />
on using GCxGC-TOFMS for chlorinated dioxin and furan analysis.<br />
Since then, Eric Reiner deserves the bulk of the credit for pulling this<br />
grassroots event together. Having 150+ attendees at a word-of-mouth<br />
workshop is a testimony to the heightened interest in multidimensional<br />
separations and Eric’s push for it!<br />
For a speaker list or to request <strong>Restek</strong>’s presentations from this year’s<br />
meeting, go to blog.restek.com and search for “MOE.”<br />
Search <strong>Restek</strong> Chromatograms Online!<br />
The chromatograms in this issue are just the beginning. Our Innovations<br />
Lab, partners, and even customers churn out a steady stream<br />
of top-notch applications that you can search and filter to find the<br />
exact chromatogram you need. Just recently, we released:<br />
QuEChERS Extract of Cannabis on Rxi®-17Sil MS and Rxi®-5ms by<br />
GCxGC-TOFMS (GC_FF1207)<br />
Therapeutic Drug Monitoring Compounds in Urine by LC-MS/MS<br />
on Ultra Biphenyl (LC_CF0535) – Featured on page 17!<br />
p- and m-Xylenes in Gasoline by GCxGC on Rtx®-DHA-150 and<br />
Stabilwax® (GC_PC1226)<br />
Separation of Ethanol and Aromatics from Paraffins in Gasoline<br />
with GCxGC on Rtx®-DHA-150 and Stabilwax® (GC_PC1227)<br />
Short-Chain Amines on Rtx®-Volatile Amine (GC_PC1243)<br />
TO-15 65 Component Mix on Rxi®-624Sil MS (30 m) (GC_AR1148)<br />
You’ll find these, along with hundreds of other chromatograms covering<br />
a wide range of markets, at www.restek.com/chromatograms<br />
Photo by Ray Clement,<br />
Ontario Ministry of Environment<br />
www.restek.com | 1-800-356-1688 or 1-814-353-1300 | Feedback? E-mail advantage@restek.com 5
Lowering Detection Limits for 1,4-Dioxane in Drinking Water<br />
Using Large Volume Injection in an Unmodified Split/Splitless GC Inlet<br />
By Chris Rattray, Jack Cochran, and Chris English<br />
• Perform large volume splitless injection with an unmodified Agilent-style split/splitless GC inlet.<br />
• Reliably detect 1,4-dioxane down to 5.0 ppt in drinking water.<br />
• Improve quantitative accuracy by introducing more analyte to the detector.<br />
Global concern over the carcinogenic potential of 1,4-dioxane, along<br />
with its identification as a Group 2B compound by the World Health<br />
Organization’s International Agency for Research on Cancer (IARC),<br />
has led to increased regulatory interest in this compound. For example,<br />
as part of Unregulated Contaminant Monitoring Rule 3 (UCMR3),<br />
the U.S. EPA is requiring increased monitoring of 1,4-dioxane in drinking<br />
water and has revised the 1x10 -6 cancer risk assessment level*<br />
down to 0.35 µg/L. As a result, the proposed minimum reporting<br />
level (MRL) for 1,4-dioxane as part of UCMR3 is 0.07 µg/L [1].<br />
Concurrent solvent recondensation–large volume splitless injection<br />
(CSR-LVSI), a technique described by Magni and Porzano [2,3], can<br />
be advantageous when trying to analyze trace-level contaminants<br />
in clean matrices like drinking water. Since more target compound is<br />
introduced onto the analytical column, detectability is improved; however,<br />
a specialized injection port, such as a PTV, is generally required<br />
for LVSI [4]. Building on work by chemists at Thermo Scientific, our lab<br />
has been exploring the use of CSR-LVSI with a completely unmodified<br />
Agilent-style inlet. We use a fast autosampler injection with liquid<br />
sample band formation in a liner containing glass wool, a retention<br />
gap press-fitted to the analytical column, and a starting GC oven<br />
temperature below the boiling point of the solvent (see next page for<br />
instrument setup and analytical conditions). Previously, we have successfully<br />
analyzed a wide variety of compounds, including PAHs, BFRs,<br />
organochlorine pesticides, and semivolatiles, using this technique (see<br />
blog.restek.com and enter “LVSI” in search). Here we assess its potential<br />
to lower detection limits for 1,4-dioxane in drinking water.<br />
Evaluating CSR-LVSI With a Standard Splitless Inlet<br />
To determine if CSR-LVSI with an unmodified split/splitless inlet was<br />
compatible with the volatile compounds in this application, linearity<br />
and interferences were assessed. Calibration curves at levels well<br />
below typical minimum detection limits displayed excellent correla-<br />
*A 1x10 -6 cancer risk assessment level corresponds to the lifetime probability of one individual<br />
in an exposed population of one million developing cancer.<br />
tions across a wide range (R 2 = 0.9998 for 1 to 1,000 pg/µL [10 to<br />
10,000 pg on column] and R 2 = 0.9996 for 0.5 to 50 pg/µL [5 to 500<br />
pg on column]). Calibration levels and equivalent concentrations are<br />
shown in Table I for the lowest curve, which was used to quantify<br />
recoveries from extracted drinking water samples.<br />
While results for injected standards were quite promising, this<br />
analysis is very sensitive to interference from co-extracted material<br />
because the SIM ions are at a relatively low mass to charge ratio.<br />
Although CSR-LVSI introduces more matrix onto the column than a<br />
typical injection, no interferences for 1,4-dioxane were observed. As<br />
shown in the analysis of a fortified drinking water extract in Figure 1,<br />
1,4-dioxane is chromatographically separated from any interferences.<br />
Using CSR-LVSI to Lower Detection Limits<br />
Having established that CSR-LVSI with an unmodified GC inlet is an<br />
appropriate technique, we wanted to assess its potential for lowering<br />
detection limits. The 10 µL CSR-LVSI in Figure 1 (approximately 5 pg oncolumn)<br />
produced a signal-to-noise ratio of 16 for the quantitation ion<br />
(m/z 88), which is above the threshold of 10. In contrast, when 1 µL of<br />
the same extract was injected, the resulting peak is barely distinguishable<br />
from the noise and the confirmation ion cannot be seen (Figure 2).<br />
Ultimately, the improved signal-to-noise ratios obtained using CSR-LVSI<br />
resulted in recoveries of 1,4-dioxane and surrogate 1,4-dioxane-d8 that<br />
were within the expected range (Table II) and that matched published<br />
method development data very well [4].<br />
Table I: Calibration curve (0.5–50 pg/µL).<br />
Level<br />
Prepared<br />
Standard (pg/µL)<br />
10 µL Injection<br />
On-Column Amount (pg)<br />
Equivalent Concentration<br />
in 500 mL Samples (µg/L)<br />
1 0.50 5.0 0.010<br />
2 1.0 10 0.020<br />
3 5.0 50 0.10<br />
4 10 100 0.20<br />
5 50 500 1.0<br />
6<br />
www.restek.com | 1-800-356-1688 or 1-814-353-1300 | Feedback? E-mail advantage@restek.com
Figure 1: 1,4-Dioxane extracted ion chromatogram from a 10 µL CSR-LVSI of a 0.5 pg/µL<br />
fortified drinking water extract (5 pg on-column). Note that the 1,4-dioxane quantification<br />
ion (m/z 88) and confirmation ion (m/z 58) are fully separated from matrix interferences<br />
and good peak responses were obtained.<br />
EIC<br />
m/z 88.00<br />
m/z 58.00<br />
4<br />
6.00 6.20 6.40 6.60<br />
Peaks<br />
1. Tetrahydrofuran-d8 (IS)<br />
2. Co-extracted material<br />
3. 1,4-Dioxane-d8 (SS)<br />
4. 1,4-Dioxane<br />
5. Co-extracted material<br />
Summary<br />
Concurrent solvent recondensation–large<br />
volume splitless injection (CSR-LVSI) with<br />
an unmodified Agilent-style split/splitless<br />
GC inlet is a viable approach for analyzing<br />
1,4-dioxane in drinking water. While large<br />
volume injection usually involves specialized<br />
equipment, using it with a completely<br />
unmodified inlet provides a cost-effective<br />
way to meet ever decreasing detection limits.<br />
For the complete version of this technical<br />
article, visit www.restek.com/dioxane<br />
1<br />
2<br />
3 5<br />
5.20 5.40 5.60 5.80 6.00 6.20 6.40 6.60 6.80 7.00<br />
4<br />
Time (min)<br />
7.20 7.40 7.60 7.80 8.00 8.20 8.40<br />
GC_EV1263<br />
Figure 2: 1,4-Dioxane extracted ion chromatogram from a standard splitless 1 µL injection<br />
of a 0.5 pg/µL fortified drinking water extract (0.5 pg on-column). Peaks are barely distinguishable<br />
from background noise.<br />
EIC<br />
m/z 88.00<br />
m/z 58.00<br />
5.10<br />
• Signal-to-noise = 16 (m/z 88)<br />
• Baseline separation from<br />
matrix interferences<br />
1,4-dioxane<br />
3<br />
5.20 5.40 5.60 5.80 6.00 6.20<br />
Standard splitless injection<br />
produces poor response.<br />
3.60 3.80 4.00 4.20 4.40 4.60 4.80 5.00 5.20 5.40 5.60 5.80 6.00 6.20 6.40 6.60 6.80 7.00 7.20 7.40 7.60 7.80 8.00 8.20 8.40<br />
Time (min)<br />
GC_EV1264<br />
Instrument Setup for CSR-LVSI:<br />
Column:<br />
Rxi®-624Sil MS, 30 m, 0.25 mm ID, 1.40 μm (cat.# 13868) using Rxi®<br />
guard column 5 m, 0.25 mm ID (cat.# 10029) with universal angled Press-<br />
Tight® connectors (cat.# 20446-261)<br />
Sample:<br />
Extract of drinking water fortified at 0.5 pg/µL with 1,4-dioxane<br />
(cat.# 30287) and at 10 pg/µL with internal standard tetrahydrofuran-d8<br />
(cat.# 30112) and surrogate standard 1,4-dioxane-d8<br />
(cat.# 30614)<br />
Injection:<br />
10 μL splitless (hold 1 min); Liner: Sky 4 mm single taper w/wool<br />
(cat.# 23303.5); Inj. Temp.: 120 °C; Purge Flow: 80 mL/min<br />
Oven:<br />
35 °C (hold 1 min) to 120 °C at 12 °C/min (hold 1 min)<br />
Carrier Gas:<br />
He, constant flow, 1.4 mL/min; Linear Velocity: 30.556 cm/sec @ 35 °C<br />
Detector:<br />
MS, SIM mode<br />
For complete conditions and SIM program, visit www.restek.com<br />
and enter GC_EV1263 in the search.<br />
References<br />
[1] U.S. EPA, Unregulated Contaminant Monitoring<br />
Rule 3.<br />
http://water.epa.gov/lawsregs/rulesregs/sdwa/<br />
ucmr/ucmr3/index.cfm (accessed March 2, 2012).<br />
[2] P. Magni, T. Porzano, Concurrent Solvent<br />
Recondensation Large Sample Volume<br />
Splitless Injection, J. Sep. Sci. 26 (2003) 1491.<br />
[3] Patent No: US 6,955,709 B2.<br />
[4] P. Grimmett, J. Munch, Method Development for<br />
the Analysis of 1,4-Dioxane in Drinking Water<br />
Using Solid-Phase Extraction and Gas<br />
Chromatography-Mass Spectrometry, J. of<br />
Chromatographic Science 47 (2009) 31.<br />
Table II: CSR-LVSI resulted in good recovery of both 1,4-dioxane and surrogate<br />
1,4-dioxane-d8 from extracted fortified samples.<br />
Matrix<br />
Bottled drinking<br />
water<br />
Bottled drinking<br />
water<br />
Bottled drinking<br />
water<br />
Fortified Sample<br />
Conc. (µg/L)<br />
Volume of Sample<br />
Extracted (L)<br />
Theoretical Extract<br />
Conc. (pg/µL)<br />
Recovery<br />
(pg/µL)<br />
1,4-Dioxane<br />
% Recovery<br />
Surrogate<br />
% Recovery<br />
0.0050 1.0 0.50 0.40 80 125<br />
0.20 0.50 10 9.2 92 102<br />
0.20 1.0 20 18 87 96<br />
Reagent water 0.020 0.50 1.0 1.0 100 88<br />
Reagent water 0.20 0.50 10 8.4 84 92<br />
Reagent water 0.0 0.50 0.0 - - 86<br />
<strong>Restek</strong> Recommends<br />
Our CSR-LVSI setup:<br />
Rxi®-624Sil MS Columns &<br />
Rxi® Retention Gaps<br />
www.restek.com/rxi<br />
Press-Tight® Connectors<br />
www.restek.com/presstight<br />
Sky Inlet Liners<br />
www.restek.com/sky<br />
www.restek.com | 1-800-356-1688 or 1-814-353-1300 | Feedback? E-mail advantage@restek.com 7
Semivolatiles<br />
Quantify Semivolatiles Down to 0.5 ng On-Column by GC-MS<br />
Using an Inert Inlet System and an Rxi®-5Sil MS Column to Extend the Calibration Range<br />
By Chris Rattray<br />
• Accurately quantify active semivolatiles down to 0.5 ng on-column using GC-MS.<br />
• Extended linear range allows lower detection limits to be met, while minimizing dilution and<br />
reanalysis of high concentrations samples.<br />
• Maintain critical separations with a fast 17 min analysis time.<br />
Customers and regulatory agencies are increasingly requiring lower<br />
GC-MS detection limits for semivolatile organic pollutants. Extending<br />
the linear calibration range down below typical levels is the best way<br />
to accomplish this, while still minimizing the dilution and reanalysis of<br />
heavily contaminated samples. Analyzing semivolatiles, particularly<br />
active compounds, at sub nanogram on-column levels requires a highly<br />
inert GC system. First, an inert sample pathway results in tall, narrow<br />
peaks that improve detectability by maximizing signal-to-noise ratios.<br />
Second, the lack of reactivity reduces adsorptive losses of active analytes,<br />
which minimizes variation of the relative response factor (RRF) at<br />
low levels. As shown in the data reported here, lower detection limits<br />
for active semivolatile compounds can be achieved when the entire<br />
gas chromatographic system (liner, seal, and column) is highly inert.<br />
Inert System Improves Response at Trace Levels<br />
For this work, 143 semivolatiles listed in the extended EPA Method<br />
8270, including Appendix IX compounds, were calibrated across a<br />
concentration range of 0.5-120 ng/µL. The 17-minute analysis shown<br />
in Figure 1 used an Agilent GC-MS (7890-5975C) equipped with a<br />
Siltek® deactivated EZ Twist Top® split/splitless inlet (cat.# 22178). A<br />
Sky inlet liner with wool (cat.# 23303), a Flip Seal inlet seal (cat.#<br />
23411), and an Rxi®-5Sil MS column (30 m x 0.25 mm ID x 0.25 µm,<br />
cat.# 13623) were also used to ensure an inert sample path. The<br />
selectivity of the Rxi®-5Sil MS column separated critical isobaric pairs,<br />
such as the benzo[b]- and benzo[k]fluoranthenes, as well as aniline<br />
and bis(2-chloroethyl)ether.<br />
The inertness of this system produces good peak shapes and responses<br />
even at 0.5 ng on-column for active compounds. This is particularly<br />
evident in a comparison of the responses of 2,4-dinitrophenol and<br />
4-nitrophenol at different concentrations (Figure 2). While the relative<br />
decrease in 2,4-dinitrophenol response at lower concentration indicates<br />
some adsorptive loss is occurring, the peak response still exceeds<br />
method criteria by a factor of 5 (Table I).<br />
Lower Detection Limits for Active Compounds<br />
Chloro- and nitro- anilines and phenols are good indicators of system<br />
performance. They are highly reactive and the minimum performance<br />
criteria in the method are difficult to meet with a poorly deactivated<br />
column and liner. Tables I and II show the performance of these trou-<br />
Table I: Nitroanilines and nitrophenols performance summary.<br />
RRF<br />
(0 .5 ng)<br />
Minimum RF<br />
Average RRF<br />
(0.5 – 120 ng/µL)<br />
RRF<br />
RSD<br />
Linear R 2<br />
2-Nitrophenol 0.710 0.100 0.770 6.9% 0.9999<br />
2-Nitroaniline 0.204 0.010 0.226 5.4% 0.9999<br />
3-Nitroaniline 0.218 0.010 0.226 3.5% 0.9997<br />
2,4-Dinitrophenol 0.055 0.010 0.176 42% 0.9992<br />
4-Nitrophenol 0.234 0.010 0.254 8.0% 0.9914<br />
4-Nitroaniline 0.433 0.010 0.424 3.9% 0.9995<br />
4,6-Dinitro-2-methylphenol 0.119 0.010 0.237 28% 0.9999<br />
Table II: Chloroaniline and chlorophenols performance summary.<br />
RRF<br />
(0 .5 ng)<br />
Minimum<br />
RRF<br />
Average RRF<br />
(0.5 – 120 ng/µL)<br />
RRF<br />
RSD<br />
Linear R 2<br />
2-Chlorophenol 1.606 0.800 1.512 3.2% 0.9998<br />
2,4-Dichlorophenol 1.157 0.200 1.155 2.9% 0.9995<br />
4-Chloroaniline 0.468 0.010 0.456 6.3% 0.9971<br />
4-Chloro-3-methylphenol 0.284 0.200 0.289 2.1% 0.9998<br />
2,4,6-Trichlorophenol 0.400 0.200 0.415 4.4% 0.9999<br />
2,4,5-Trichlorophenol 0.435 0.200 0.442 2.9% 0.9997<br />
2,3,5,6-Tetrachlorophenol 0.327 0.010 0.377 9.3% 0.9987<br />
2,3,4,6-Tetrachlorophenol 0.357 N/A 0.372 3.9% 0.9984<br />
Pentachlorophenol 0.238 0.050 0.311 14% 0.9999<br />
8<br />
www.restek.com | 800-356-1688 | Feedback? E-mail advantage@restek.com
Figure 1: Extend the calibration range for difficult semivolatiles down to 0.5 ng on-column by using a highly inert analytical system.<br />
(total ion chromatogram of EPA Method 8270 and Appendix IX compounds)<br />
• Quantify down to 0.5 ng on-column<br />
• Separate key PAHs.<br />
EIC: m/z 162 86 EIC: m/z 232<br />
66<br />
• Analyze 145 semivolatiles in 17 minute analysis.<br />
87<br />
67<br />
7.20<br />
7.25<br />
EIC:<br />
12 = m/z 106<br />
15,16 = m/z 93<br />
15<br />
12<br />
16<br />
13,14 20,21<br />
16,17<br />
15<br />
18 19 22 2324<br />
25<br />
12<br />
26,27,28<br />
29,30,31<br />
32<br />
33<br />
34,35<br />
45,46<br />
42,43<br />
47,48<br />
37<br />
39 44 50 52,53 55 54<br />
41<br />
49<br />
36 38<br />
51<br />
40<br />
58,59<br />
56<br />
57<br />
64<br />
61 62 63<br />
60<br />
65<br />
66<br />
76<br />
68<br />
67 72<br />
69<br />
70<br />
73 74 77<br />
71 75<br />
90,91<br />
78,79 92,93 97<br />
108,109<br />
110<br />
80<br />
99,100<br />
85,86 95<br />
82<br />
111<br />
83,84<br />
88 89 96 101 104106<br />
102103<br />
105 107<br />
87<br />
81<br />
94 98<br />
8.05 8.10<br />
EIC: m/z 106<br />
137 138<br />
4.40 4.60 4.80<br />
4.40 4.60 4.80 5.00 5.20 5.40 5.60 5.80 6.00 6.20 6.40 6.60 6.80 7.00 7.20 7.40 7.60 7.80 8.00 8.20 8.40 8.60 8.80 9.00 9.20 9.40<br />
1,2<br />
9<br />
3 4 5 6<br />
7 8<br />
10 11<br />
112<br />
118,119 121<br />
115<br />
117<br />
116<br />
125,126<br />
123<br />
124<br />
120 122<br />
113<br />
114<br />
131,132,133<br />
134<br />
127,128<br />
129 131<br />
135<br />
136,137<br />
138<br />
139<br />
140<br />
EIC:<br />
143 = m/z 276<br />
144 = m/z 278<br />
143 144<br />
141<br />
16.50<br />
142 143144 145<br />
GC_EV1269<br />
14.00<br />
2.50 3.00 3.50 4.00 4.50 5.00 5.50 6.00 6.50 7.00 7.50 8.00 8.50 9.00 9.50 10.00 10.50 11.00 11.50 12.00 12.50 13.00 13.50 14.00 14.50 15.00 15.50 16.00 16.50 17.00<br />
Time (min)<br />
Column: Rxi®-5Sil MS, 30 m, 0.25 mm ID, 0.25 µm (cat.# 13623); Sample: 8270 MegaMix® (cat.# 31850), 8270 Benzidines mix (cat.# 31852), Benzoic acid (cat.# 31879), Revised B/N surrogate mix (cat.# 31888), Acid surrogate<br />
mix (4/89 SOW) (cat.# 31063), Revised SV internal standard mix (cat.# 31886), Appendix IX mix #1 (cat.# 31625), Appendix IX mix #2 (cat.# 31806); Diluent: Dichloromethane; Conc.: 0.5 µg/mL (IS/SS 20 μg/mL);<br />
Injection: 1 µL pulsed splitless (hold 0.59 min); Liner: Sky 4 mm single taper w/wool (cat.# 23303); Inj. Temp.: 270 °C; Pulse Pressure: 30 psi (206.8kPa); Pulse Time: 0.64 min; Purge Flow: 100 mL/min; Oven: 40 °C (hold 1<br />
min) to 280 °C at 25 °C/min to 320 °C at 5 °C/min (hold 1 min); Carrier Gas: He, constant flow; Flow Rate: 1.2 mL/min; Detector: MS; Mode: Scan; Transfer Line Temp.: 280 °C; Analyzer Type: Quadrupole; Source Temp.: 276 °C;<br />
Quad Temp.: 150 °C; Electron Energy: 70 eV; Solvent Delay Time: 2.19 min; Tune Type: DFTPP; Ionization Mode: EI; Scan Range: 35-550 amu; Scan Rate: 5.36 scans/sec; Instrument: Agilent 7890A GC & 5975C MSD; Notes:<br />
7890 Siltek®-treated EZ Twist Top® split/splitless injection port (cat.# 22178), Flip Seal dual Vespel® ring inlet seal (cat.# 23411); For peak identifications, visit www.restek.com and enter GC_EV1269 in the search.<br />
blesome compounds at 0.5 ng on column relative<br />
to the method minimum, the average RF for the<br />
calibration range (0.5-120 ng on-column), and linearity<br />
evaluated by RRF RSD and linear regression.<br />
Figure 2: Response differential for<br />
2,4-dinitrophenol and 4-nitrophenol.<br />
1<br />
Calibrations were also assessed for the full list<br />
6 0.5 ng 9<br />
10 ng<br />
On-Column On-Column<br />
10<br />
of compounds. For the initial calibration (ICAL) 4<br />
as a whole to meet acceptance criteria, less<br />
2<br />
82<br />
than 10% of the individual compounds may<br />
have failing RSDs (or correlations, if alternative<br />
2<br />
3<br />
1<br />
fit methods are used). When the peak<br />
5<br />
response RSDs were evaluated over the entire<br />
2,4-DNP<br />
2,4-DNP<br />
calibration range for the full list of compounds,<br />
7<br />
RF=0.055<br />
RF=0.19<br />
1<br />
the average RSD was 8.7% and only 10 of the<br />
compounds tested had RSDs greater than<br />
20%. Linearity results for both indicator 7.30 7.40 and 7.50<br />
non-indicator compounds demonstrate that<br />
7.60 7.70 7.80 7.90 8.00 8.10 8.20 8.30 8.40 8.50 Time<br />
detection limits can be lowered for semivolatiles<br />
analysis by using a highly inert system that<br />
1. 2,4-Dinitrophenol (m/z 184)<br />
2. 4-Nitrophenol (m/z 139)<br />
See Figure 1 for analytical conditions.<br />
allows the lower end of the calibration range to<br />
be extended.<br />
For more environmental applications, visit<br />
www.restek.com/enviro<br />
<strong>Restek</strong> Recommends<br />
For ultimate sample path inertness:<br />
EZ Twist Top® Injection Port<br />
www.restek.com/eztwist<br />
Sky Inlet Liners<br />
www.restek.com/sky<br />
Flip Seal Inlet Seals<br />
www.restek.com/flip<br />
Rxi®-5Sil MS Columns<br />
www.restek.com/rxi<br />
www.restek.com | 800-356-1688 | Feedback? E-mail advantage@restek.com<br />
9
It’s A Matter of Degrees, but Do Degrees Really Matter?<br />
An Observation of GC Inlet Temperature Profile and Inlet-to-Inlet Temperature Variability<br />
By Scott Grossman<br />
• For some manufacturers, only a portion of the GC inlet is actually at the temperature setpoint;<br />
a significant thermal gradient exists both above and below this zone.<br />
• The thermal profile of one GC inlet can vary from other similar inlets—and vary dramatically<br />
between different styles.<br />
• Removal or damage to GC insulation can have a large effect on the inlet’s thermal profile.<br />
Injecting a liquid sample into a hot GC inlet is a dynamic and complex<br />
event. Of the many parameters that affect the success of an<br />
injection, inlet temperature is one of the most significant. Raising or<br />
lowering the inlet temperature setpoint can have a profound effect<br />
on how much sample is transferred onto the column depending on<br />
sample volatility and thermal sensitivity. But, once the inlet temperature<br />
is set, how much of the inlet is actually kept at that setpoint?<br />
Moreover, how might thermal profiles change between inlets?<br />
Temperature Varies Within and Between Similar Inlets<br />
The motivation for this work came from a question about the actual<br />
temperature of an O-ring installed in an Agilent split/splitless inlet at a<br />
given inlet temperature setpoint. (See Figure 1 to identify the components<br />
of a GC inlet.) Instead of just measuring the temperature inside<br />
a liner near the O-ring’s location, we used a thermocouple to measure<br />
temperature along the entire length of the liner at a constant inlet temperature<br />
setpoint of 250 °C. The resulting thermal profile confirmed that<br />
a temperature gradient exists within the inlet.*<br />
In previous work (www.restek.com/hotseptum), we also discussed this<br />
gradient within GC inlets and noted that inlet thermal profiles can vary<br />
greatly between manufacturers, but would they vary between similar<br />
inlets from the same manufacturer? We checked another similar inlet to<br />
compare the thermal profiles and found that the second inlet exhibited<br />
a different thermal profile from the first. After measuring several more<br />
Agilent GC inlet temperature profiles, we found inlet-to-inlet variation in<br />
all cases, even in ostensibly identical inlets (Figure 2).<br />
* For these experiments, we only measured the thermal profile of the<br />
liner inside the inlet, not the entire inlet.<br />
Figure 1: Considering how little of the GC inlet is actively heated<br />
by the heating element, it’s no surprise a temperature gradient<br />
exists—especially if insulation is missing from the top or bottom.<br />
Open Air<br />
Point of<br />
Injection<br />
Oven<br />
Wall<br />
Oven<br />
1.2<br />
cm<br />
O-Ring Perforated Disk<br />
Inlet Body<br />
Insulation<br />
Liner<br />
Aluminum<br />
Heater Block<br />
Thermal Nut<br />
Column<br />
Heater Sensor<br />
Heating Element<br />
Inlet Seal<br />
Nut Warmer Cup<br />
Reducing Nut<br />
Insulation is Crucial to Minimizing<br />
Temperature Variation<br />
We did observe one split/splitless inlet with significantly lower temperatures<br />
at the top and bottom. After investigating, we discovered that<br />
the top ring of insulation, which sits just below the perforated disk of<br />
the Agilent 6890 split/splitless inlet weldment, was missing. Some of<br />
the insulation at the bottom of the inlet, along with the thermal nut,<br />
was also not installed. Simply placing insulation in the top cavity and<br />
installing the thermal nut caused the temperature of the inlet liner to<br />
more closely match the other inlets (Figure 2). This test was a valuable<br />
reminder of the need to carefully reconstruct the inlet whenever the<br />
insulation is disturbed.<br />
10<br />
www.restek.com | 1-800-356-1688 or 1-814-353-1300 | Feedback? E-mail advantage@restek.com
Figure 2: A temperature gradient exists within a GC inlet, and temperature profiles can vary<br />
between similar inlets. These variations increase dramatically with the absence of insulation.<br />
NOTE: To ensure relative accuracy between inlets, all split/splitless temperature readings were taken<br />
in the same manner.<br />
Figure 3: Installing the nut warmer cup can help minimize the effects of oven temperature<br />
on the actual temperature of the inlet. (Inlet shown below was set to a constant 250 °C.)<br />
When insulation is missing at the top of the<br />
inlet, the inlet loses heat to the open air; however,<br />
when insulation is missing at the bottom,<br />
the GC oven influences the temperature in<br />
both directions (Figure 3). Because column<br />
installation can be more challenging with the<br />
insulated nut warmer cup installed, analysts<br />
may be tempted to leave it in a drawer, but<br />
the effect on your inlet temperature can be<br />
significant.<br />
Temperature Can Vary Drastically<br />
Between Dissimilar Inlets<br />
The newly introduced Agilent Multimode Inlet<br />
(MMI) is said to be capable of performing both<br />
hot split and hot splitless injections like a normal<br />
split/splitless inlet. But, when we measured<br />
the thermal profiles for two MMI inlets, it was<br />
interesting to note how different the MMI thermal<br />
profiles were from a split/splitless inlet—a<br />
drop of over 190 °C from the setpoint to the<br />
top of the inlet as opposed to around 100 °C<br />
for the split/splitless inlets (Figure 4). This variation<br />
shows that changing equipment may also<br />
change your results, even if the equipment is<br />
nominally able to do the same analysis.<br />
The Effects of Inlet Temperature<br />
Variations on Chromatography<br />
As demonstrated here, thermal gradients<br />
exist within a single GC inlet, and temperature<br />
profiles can vary between similar, as well as<br />
between dissimilar, inlets. How do these variations<br />
affect the vaporization of a liquid sample<br />
(and, thus, the overall success of the analysis)?<br />
We answer these questions and offer details on<br />
our temperature data collection at<br />
www.restek.com/TempEffects<br />
Figure 4: The Multimode Inlets (MMIs) we measured experienced almost twice the temperature<br />
drop (190 °C) of a standard split/splitless inlet between the inlet setpoint to the<br />
top of the liner.<br />
True Blue Performance<br />
Exceptionally inert, Sky<br />
inlet liners with a new<br />
state-of-the-art deactivation<br />
improve trace-level analysis.<br />
Visit us at www.restek.com/sky<br />
www.restek.com | 1-800-356-1688 or 1-814-353-1300 | Feedback? E-mail advantage@restek.com 11
Comprehensive Pesticide Residue Monitoring in Foods<br />
Using QuEChERS, LC-MS/MS, and GCxGC-TOFMS<br />
By Julie Kowalski 1 , Jack Cochran 1 , Jason Thomas 1 , Michelle Misselwitz 1 , Rebecca Wittrig 2 *, and André Schreiber 3<br />
1<br />
<strong>Restek</strong> Corporation, 110 Benner Circle, Bellefonte, Pennsylvania 16823, USA<br />
2<br />
AB SCIEX, 353 Hatch Drive, Foster City, California 94404, USA<br />
• One fast, simple QuEChERS extraction for a broad range of pesticides.<br />
• Rxi®-5Sil MS and Rtx®-200 column selectivity and orthogonality promote good GCxGC separations.<br />
• Ultra Aqueous C18 LC column retains and gives excellent peak shapes for small polar pesticides.<br />
Pesticide residue analysis of food has traditionally been performed<br />
using GC, but there is increasing use of LC with tandem mass spectrometry<br />
(MS/MS). LC is favored for polar, less thermally-stable, less<br />
volatile, compounds. GC-MS is preferred for volatile, thermally-stable<br />
species, and pesticides that do not ionize well in electrospray or atmospheric<br />
pressure chemical ionization LC sources. With MS, complete<br />
chromatographic resolution of compounds is not always essential, as<br />
selected ions or selected reaction monitoring (SRM) transitions are<br />
used for pesticide identification and quantification. However, data<br />
quality can be improved through better retention and separation of<br />
components, especially for structurally similar pesticides and highlevel<br />
matrix coextractives. In the work summarized here, we employed<br />
a comprehensive approach and analyzed QuEChERS extracts of a<br />
variety of foods for pesticides by both GCxGC-TOFMS and LC-MS/MS.<br />
Food commodities were fortified with pesticides and processed<br />
using Q-sep QuEChERS extraction salts and dSPE tubes. QuEChERS<br />
(Quick–Easy–Cheap–Effective–Rugged–Safe) is a sample preparation<br />
approach developed by Anastassiades et al. [1] as a simple, rapid,<br />
effective, yet inexpensive, way to extract pesticide residues from<br />
fruits and vegetables, followed by a dispersive solid phase extraction<br />
(dSPE) cleanup of the extract. The foods chosen varied in water, fat,<br />
and pigment content, so the ruggedness of QuEChERS as well as the<br />
performance of GCxGC-TOFMS and LC-MS/MS could be assessed.<br />
Commodities tested were red bell pepper, cucumber, black seedless<br />
grape, spinach, lemon, raisin, and hazelnut. In this summary, we<br />
report data for the grape and lemon, the least complex and most<br />
complex of the matrices we assessed. Complete results are available<br />
at www.restek.com/comp-pest in the full application note.<br />
Column Selectivity and Multidimensional Techniques<br />
We first assessed the complexity of different commodities by examining<br />
the total ion chromatogram (TIC) contour plots generated by<br />
12<br />
3<br />
AB SCIEX Research and Development, 71 Four Valley Drive, Concord, Ontario, Canada L4K 4V8<br />
*Current address: <strong>Restek</strong> Corporation, 110 Benner Circle, Bellefonte, Pennsylvania 16823, USA<br />
GCxGC-TOFMS. It is clear from Figure 1 that lemon contains many<br />
more coextractives than grape, as demonstrated by the large number<br />
of intense (red) signals. While it should be possible to analyze<br />
QuEChERS grape extracts for pesticides by one-dimensional GC,<br />
multidimensional techniques (e.g., GCxGC-MS, GC-MS/MS, or LC-MS/<br />
MS) are necessary for samples as complex as lemon. Column selectivity<br />
is an important consideration in multidimensional techniques<br />
and the Rxi®-5Sil MS (cat.# 13623) x Rtx®-200 (cat.# 45001) column<br />
combination used here provided orthogonal separations that helped<br />
isolate target analytes from matrix interferences. Column selectivity<br />
is also important in LC-MS/MS methods because coelutions can be<br />
problematic if the analytes share MRM transitions. The Ultra Aqueous<br />
C18 column (cat.# 9178312) used for this work is both selective for<br />
small, polar compounds, showing good retention and peak shape,<br />
and has balanced retention for a large number of compounds that<br />
vary in physiochemical properties. More balanced retention reduces<br />
the number of MRM transitions being monitored at any point in time,<br />
and improves data quality by allowing more time to be spent on a<br />
smaller number of MRM transitions.<br />
Evaluation of a Comprehensive Approach<br />
Good recoveries were obtained for most pesticides in most commodities<br />
as determined by both GCxGC-TOFMS and LC-MS/MS. As shown<br />
in Table I, quantitative results for grape were excellent, but lemon<br />
proved to be a difficult matrix as demonstrated by the fact that 11<br />
pesticides were not detected by LC-MS/MS and two pesticides had<br />
interfering compounds when using the GCxGC-TOFMS method. Given<br />
lemon’s complexity, ion suppression from coelution with coextractives<br />
is likely the cause of the undetected compounds in the LC-MS/<br />
MS analysis. Similarly, coextracted matrix compounds likely caused<br />
the interference that prevented determination of propoxur and terbacil<br />
in fortified samples by GCxGC-TOFMS. While recovery results for<br />
most pesticides in most commodities demonstrate successful extract<br />
www.restek.com | 1-800-356-1688 or 1-814-353-1300 | Feedback? E-mail advantage@restek.com
Figure 1: GCxGC-TOFMS contour plots for grape and lemon QuEChERS extracts. The<br />
lemon extract is much more complex than the grape extract and could not be analyzed<br />
by one-dimensional GC.<br />
A: Grape<br />
GC_FF1217<br />
B: Lemon<br />
GC_FF1218<br />
Columns: Rxi®-5Sil MS, 30 m, 0.25 mm ID, 0.25 µm (cat.# 13623) and Rtx®-200, 1.5 m, 0.18 mm ID, 0.20 µm (cat.# 45001); Samples: Grape<br />
and lemon samples were fortified at 10 ng/g with a mixed pesticide standard solution. Snap-and-shoot internal standards (cat.# 33267 and<br />
33261) containing the compounds specified in the EN15662 QuEChERS method were added. Samples were extracted with Q-sep European<br />
method extraction salts (cat.# 26236) and extracts were then cleaned with QuEChERS dSPE cleanup tubes (cat.#26230). For complete sample<br />
preparation details and analytical conditions, visit www.restek.com and enter chromatograms GC_FF1217 and GC_FF1218 in the search.<br />
Table I: Percent recovery values for 10 ng/g<br />
fortified samples prepared using QuEChERS<br />
and analyzed by GCxGC-TOFMS and LC-MS/MS.<br />
Pesticide<br />
Black Grapes<br />
Lemon<br />
GCxGC LC GCxGC LC<br />
Propoxur 92 110 INT 75<br />
Methamidophos 170 73 79 66<br />
Acephate 73 NA 88 NA<br />
Propham 100 50 130 ND<br />
1-Naphthol 95 NA 110 NA<br />
o-Phenylphenol 91 NA 100 NA<br />
Tebuthiuron 92 90 110 42<br />
Omethoate 68 98 100 89<br />
Dimethoate 93 91 100 79<br />
Prometon 96 73 110 47<br />
Terbacil 110 NA INT NA<br />
Pirimicarb 98 NA 100 NA<br />
Metribuzin 110 76 110 58<br />
Fuberidazole 96 85 98 ND<br />
Carbaryl 120 150 72 14<br />
Metalaxyl 93 81 95 52<br />
Terbutryn 100 79 99 4<br />
Ethofumesate 110 120 81 19<br />
Benthiocarb 85 NA 110 NA<br />
Cyprodinil 99 86 91 ND<br />
Thiabendazole 110 70 83 ND<br />
Furalaxyl 130 85 110 37<br />
Triadimenol 110 NA 100 NA<br />
Siduron 98 96 120 35<br />
Imazalil NA 70 XXX XXX<br />
Fludioxonil 120 NA 96 NA<br />
Myclobutanil 130 110 100 13<br />
Buprofezin XXX XXX 94 24<br />
Oxadixyl 120 90 97 40<br />
Mepronil 120 91 100 ND<br />
Carfentrazone ethyl 110 150 110 74<br />
Fenhexamid 120 51 87 ND<br />
Propargite 110 130 100 ND<br />
Piperonyl butoxide 110 95 110 ND<br />
Pyriproxyfen 96 100 99 ND<br />
Fenarimol 89 NA 100 NA<br />
Bitertanol 92 NA 110 NA<br />
Prochloraz 78 80 100 ND<br />
Pyraclostrobin 110 92 61 ND<br />
Azoxystrobin 98 86 110 30<br />
Dimethomorph 90 98 97 25<br />
XXX = incurred pesticides<br />
NA = not analyzed<br />
ND = not detected<br />
INT = affected by interferences<br />
cleanup using dSPE, highly complex matrices<br />
will benefit from more exhaustive sample<br />
cleanup techniques, such as cartridge SPE [2].<br />
Incurred residues were also determined and<br />
the number of pesticides detected by each<br />
technique was comparable. However, there<br />
were some pesticides for which residue concentration<br />
could only be reported by either<br />
GCxGC-TOFMS or LC-MS/MS.<br />
Conclusions<br />
Use of both GCxGC-TOFMS and LC-MS/MS<br />
provides more comprehensive results for<br />
pesticide residue monitoring in food. The<br />
QuEChERS sample preparation approach<br />
using <strong>Restek</strong> Q-sep extraction salts and dSPE<br />
cleanup tubes worked well for a variety of<br />
pesticides and commodities. In general, good<br />
recoveries were achieved as determined by<br />
both GCxGC-TOFMS and LC-MS/MS. However,<br />
more difficult matrices like lemon may benefit<br />
from additional cleanup of sample extracts.<br />
For the complete technical article, visit<br />
www.restek.com/comp-pest<br />
Acknowledgements<br />
U.S. Food and Drug Administration/Center for Food<br />
Safety and Applied Nutrition; <strong>LECO</strong> Corporation<br />
References<br />
[1] M. Anastassiades, S.J. Lehotay, D. Stajnbaher, F.J.<br />
Schenck, J. AOAC International 86 (2003) 412.<br />
[2] J. Cochran, J. Thomas, J. Kowalski, M. Misselwitz, R.<br />
Lake, Determining Pesticides in Dietary Supplements<br />
with QuEChERS Extraction, Cartridge SPE, and<br />
GCxGC-TOFMS, GNAN1338, <strong>Restek</strong> Corporation, 2011.<br />
<strong>Restek</strong> Recommends<br />
Comprehensive solutions:<br />
Q-sep QuEChERS Sample Prep Products<br />
www.restek.com/quechers<br />
GCxGC Columns and Resources<br />
www.restek.com/gcxgc<br />
Ultra Aqueous C18 LC Columns<br />
www.restek.com/uslc<br />
Certified Reference Materials<br />
www.restek.com/standards<br />
www.restek.com | 1-800-356-1688 or 1-814-353-1300 | Feedback? E-mail advantage@restek.com 13
Increase Data Quality for Sulfonamide Residue Analysis by HPLC and UHPLC<br />
Using Unique Biphenyl Column Selectivity<br />
By Rick Lake and Ty Kahler<br />
• Improve reporting accuracy with better selectivity and retention.<br />
• Biphenyl column and MS-friendly mobile phases allow easy transfer between UV and MS detection.<br />
• Maximize sample throughput by combining USLC® selectivity with UHPLC speed.<br />
The analysis of antibiotic residues in food-producing animals is<br />
important worldwide for evaluating food safety and maintaining<br />
compliance with export regulations. Sulfonamides are a specific concern,<br />
as drugs in this antibiotic class are commonly used in feed additives<br />
for livestock in order to fight infections and maintain desired<br />
growth levels. The analysis of sulfonamides usually involves a liquid<br />
chromatographic separation and detection by either UV or mass<br />
spectrometry. In both cases, the highly selective separation produced<br />
by a Biphenyl HPLC or UHPLC column can significantly improve data<br />
quality and reporting accuracy.<br />
Increase Accuracy With Ultra Selective<br />
Biphenyl Columns<br />
Since selectivity is the most important factor affecting peak resolution,<br />
we chose a Biphenyl column, part of our USLC® family of phases,<br />
for this work. Due to the column’s unique selectivity and high retention,<br />
we were able to develop a very effective HPLC separation of 11<br />
common sulfonamides with complete resolution (Figure 1). Use of<br />
the Biphenyl column produced much better chromatographic data<br />
compared to results obtained from a phenyl hexyl column used<br />
under identical conditions (Figure 2). The fully resolved sulfonamide<br />
analysis obtained on the Biphenyl column allows for more consistent<br />
and accurate integration.<br />
In addition to providing improved separation of target analytes,<br />
focusing on stationary phase selectivity when choosing the analytical<br />
column allowed us to use simple, MS-friendly mobile phases. This<br />
approach provides several advantages for sulfonamide residue analysis.<br />
First, the separation can be easily transferred from UV to MS without<br />
further method development. Second, the use of simple mobile<br />
phases saves time and money, since they are quick to prepare and do<br />
not require complex additives.<br />
Higher Retention Reduces Matrix Interferences<br />
in MS Detection<br />
When developing a separation for UV detection, selectivity is critical for<br />
positive analyte identification. If MS detection is used, selectivity may<br />
not be required for analyte identification, but it still may be needed for<br />
adequate sensitivity and separation from matrix interferences. Matrix<br />
interferences can play a significant role in MS analyses by lowering<br />
method sensitivity through suppressing ionization. Ion suppression in<br />
reversed phase mode often occurs with early eluting compounds, so<br />
it is good practice to retain them to a retention factor (k) of 2. In this<br />
example, we can see that the retention factor of sulfanilamide on the<br />
Biphenyl column is approximately twice as high as it is on the phenyl<br />
hexyl column (Figure 2). As a result, sulfanilamide is more susceptible<br />
to sample matrix interference if a phenyl hexyl column is used. The<br />
increased retention provided by the Biphenyl column, in combination<br />
with the MS-friendly mobile phases used here, ensure good sensitivity<br />
and allow easy method transfer between detectors.<br />
Combining USLC® Selectivity and UHPLC Speed—<br />
The Most Powerful Approach<br />
Selectivity has the greatest influence on resolution, but efficiency is the<br />
best tool for decreasing analysis time. By optimizing column selectivity<br />
first, we can then easily transfer a robust separation to UHPLC for faster<br />
analysis. Figure 3 illustrates the power of combining USLC® selectivity<br />
with UHPLC efficiency. By using a 1.9 µm Biphenyl UHPLC column we are<br />
able to fully separate all 11 sulfonamide peaks in a fast, 8-minute analysis.<br />
Conclusion<br />
Focusing first on selectivity when choosing an analytical column for<br />
sulfonamide residue analysis is an easy way to improve data quality.<br />
The unique selectivity and high retention of Biphenyl columns produce<br />
complete separations and benefit both UV and MS detection. In addition,<br />
Biphenyl columns in a UHPLC format allow faster sample throughput,<br />
while maintaining good separation of target compounds.<br />
14<br />
www.restek.com | 1-800-356-1688 or 1-814-353-1300 | Feedback? E-mail advantage@restek.com
Figure 1: Due to their unique selectivity, Biphenyl columns can provide the retention<br />
and separation needed for accurate sulfonamides analysis with simple, MS-friendly<br />
mobile phases.<br />
Strong retention<br />
minimizes matrix<br />
interference for<br />
sulfanilamide.<br />
Unique Biphenyl selectivity<br />
resolves all sulfonamide peaks.<br />
LC_GN0531<br />
Peaks<br />
RT (min)<br />
1. Sulfanilamide 4.40<br />
2. Sulfadiazine 10.18<br />
3. Sulfapyridine 10.63<br />
4. Sulfathiazole 10.99<br />
5. Sulfamerazine 11.72<br />
6. Sulfamethazine 12.94<br />
7. Sulfachlorpyridazine 16.08<br />
8. Sulfadoxine 16.42<br />
9. Sulfisoxazole 17.65<br />
10. Sulfadimethoxine 19.47<br />
11. Sulfaquinoxaline 19.86<br />
Column: Ultra Biphenyl (cat.# 9109565); Dimensions: 150 mm x 4.6 mm ID; Particle Size: 5 µm; Pore Size: 100 Å; Temp.: 25 °C;<br />
Sample: Diluent: 0.1% Formic acid in water; Conc.: 50 µg/mL; Inj. Vol.: 10 µL; Mobile Phase: A: 0.1% Formic acid in water, B: 0.1% Formic<br />
acid in acetonitrile; Gradient (%B): 0 min (10%), 3.0 min (10%), 20.0 min (40%), 21.0 min (40%); Flow: 1.0 mL/min; Detector: UV/Vis @<br />
265 nm; Instrument: Shimadzu UFLCXR.<br />
Figure 2: A phenyl hexyl column, used under identical conditions, does not provide<br />
adequate retention or selectivity for sulfonamide residue analysis.<br />
Sulfanilamide is<br />
susceptible to sample<br />
matrix interferences.<br />
Less selectivity results<br />
in coelutions.<br />
Peaks<br />
RT (min)<br />
1. Sulfanilamide 3.07<br />
2. Sulfadiazine 7.15<br />
3. Sulfapyridine 7.43<br />
4. Sulfathiazole 7.96<br />
5. Sulfamerazine 8.54<br />
6. Sulfamethazine 8.53<br />
7. Sulfachlorpyridazine 13.49<br />
8. Sulfadoxine 13.63<br />
9. Sulfisoxazole 15.41<br />
10. Sulfadimethoxine 17.22<br />
11. Sulfaquinoxaline 17.45<br />
For more about the advantages<br />
of USLC® Biphenyl columns, visit<br />
www.restek.com/uslc<br />
Ultra Biphenyl Columns (USP L11)<br />
Physical Characteristics:<br />
particle size: 3 µm or 5 µm, spherical<br />
pore size: 100 Å<br />
carbon load: 15%<br />
endcap: fully endcapped<br />
pH range: 2.5 to 8<br />
temperature limit: 80 °C<br />
Description<br />
cat.#<br />
5 µm Columns<br />
150 mm, 4.6 mm ID 9109565<br />
5 µm Columns<br />
150 mm, 4.6 mm ID (with Trident Inlet Fitting) 9109565-700<br />
Pinnacle® DB Biphenyl Columns<br />
(USP L11)<br />
Physical Characteristics:<br />
particle size: 1.9 µm, 3 µm, or 5 µm,<br />
spherical<br />
pore size: 140 Å<br />
carbon load: 8%<br />
ordering note<br />
endcap: yes<br />
pH range: 2.5 to 8<br />
temperature limit: 80 °C<br />
Description<br />
cat.#<br />
1.9 µm Columns<br />
100 mm, 2.1 mm ID 9409212<br />
For guard cartridges for these columns, visit our<br />
website at www.restek.com<br />
LC_GN0533<br />
Column: Waters XSELECT CSH Phenyl-Hexyl; Dimensions: 150 mm x 4.6 mm ID; Particle Size: 5 µm; Temp.: 25 °C; Sample: Diluent: 0.1%<br />
Formic acid in water; Conc.: 50 µg/mL; Inj. Vol.: 10 µL; Mobile Phase: A: 0.1% Formic acid in water, B: 0.1% Formic acid in acetonitrile;<br />
Gradient (%B): 0 min (10%), 3.0 min (10%), 20.0 min (40%), 21.0 min (40%); Flow: 1.0 mL/min; Detector: UV/Vis @ 265 nm;<br />
Instrument: Shimadzu UFLCXR.<br />
Figure 3: Ultra selective analysis of sulfonamides on a unique Biphenyl column can be used in conjunction with UHPLC for higher<br />
sample throughput.<br />
Peaks<br />
RT (min)<br />
1. Sulfanilamide 1.55<br />
2. Sulfadiazine 3.74<br />
3. Sulfapyridine 4.09<br />
4. Sulfathiazole 4.24<br />
5. Sulfamerazine 4.35<br />
6. Sulfamethazine 4.91<br />
7. Sulfachlorpyridazine 5.87<br />
8. Sulfadoxine 5.99<br />
9. Sulfisoxazole 6.37<br />
10. Sulfadimethoxine 7.14<br />
11. Sulfaquinoxaline 7.40<br />
LC_GN0532<br />
Column: Pinnacle® DB Biphenyl (cat.# 9409212); Dimensions: 100 mm x 2.1 mm ID; Particle Size: 1.9 µm;<br />
Pore Size: 140 Å; Temp.: 25 °C; Sample: Diluent: 0.1% Formic acid in water; Conc.: 50 µg/mL; Inj. Vol.: 2 µL;<br />
Mobile Phase: A: 0.1% Formic acid in water, B: 0.1% Formic acid in acetonitrile; Gradient (%B): 0 min<br />
(5%), 8 min (40%); Flow: 0.4 mL/min; Detector: UV/Vis @ 265 nm; Instrument: Shimadzu UFLCXR.<br />
www.restek.com | 1-800-356-1688 or 1-814-353-1300 | Feedback? E-mail advantage@restek.com 15
Fast, Robust LC-MS/MS Method for Quantification of Multiple Therapeutic<br />
Drug Classes Using an Ultra Biphenyl Column<br />
By Amanda Rigdon<br />
• Quantify 29 drug compounds from four drug classes in a<br />
fast, 5.5-minute analysis.<br />
• Ultra Biphenyl column separates isobaric compounds for<br />
more definitive results.<br />
• Highly reproducible retention times reduce downtime<br />
and reanalysis.<br />
As demand for therapeutic drug monitoring rises, laboratories are<br />
under increased pressure to implement streamlined, cost-effective<br />
testing procedures. As with any high-volume application, the methods<br />
developed for therapeutic drug monitoring must be fast, robust,<br />
and easy to implement. Methods that can be used to quantify a wide<br />
variety of drug chemistries from a single analysis are particularly beneficial,<br />
as they reduce costs and save time. The objective of this work<br />
was to develop a fast, robust LC-MS/MS method for the quantification<br />
of 29 therapeutic drugs and metabolites in urine from several drug<br />
classes including opiates, benzodiazepines, tricyclic antidepressants,<br />
and anticonvulsants. Results from this partial validation indicate that<br />
the method used here produces good linearity, accuracy, and precision<br />
for most of the drugs tested in a fast, 5.5-minute analysis.<br />
The method employed here uses a Shimadzu UFLCXR HPLC coupled<br />
to an AB SCIEX API 4000 MS/MS and a 5 µm Ultra Biphenyl (100 mm x<br />
2.1 mm, cat.# 9109512) analytical column with a matching guard<br />
column (cat.# 910950212). The Biphenyl column was chosen for this<br />
work because of its versatility; it combines the performance of a<br />
traditional alkyl (e.g., C18) column with that of a phenyl column, and<br />
it offers excellent retention of both polar and nonpolar compounds.<br />
The adaptability of the Biphenyl phase makes it particularly useful for<br />
methods developed to analyze drugs from multiple classes. Matrix<br />
standards and samples were prepared using dilute-and-shoot methodology<br />
as described in Figure 1.<br />
Linear Range and Sensitivity<br />
To evaluate linearity and sensitivity, an 11-point calibration curve covering<br />
a concentration range of 1-1,000 ng/mL was prepared in matrix.<br />
Calibration curves for each compound were built from triplicate injections<br />
using either a linear or quadratic equation, depending on the<br />
Table I: Partial validation results for 29 therapeutic drugs and drug<br />
metabolites.<br />
Compound Name<br />
LOQ<br />
(ng/mL)<br />
Linearity<br />
(r)<br />
% Accuracy at<br />
LOQ<br />
%CV at<br />
LOQ<br />
S/N at<br />
LOQ<br />
Morphine 5.0 0.9995 95 5 20<br />
Oxymorphone 5.0 0.9994 101 2 30<br />
Pregabalin 5.0 0.9994 95 5 40<br />
Hydromorphone 2.5 0.9993 91 1 40<br />
Gabapentin 10.0 0.9994 98 5 10<br />
Codeine 10.0 0.9990 109 18 50<br />
Oxycodone 5.0 0.9989 112 10 40<br />
Hydrocodone 5.0 0.9997 106 2 30<br />
7-Aminoclonazepam 2.5 0.9978 85 14 50<br />
Tapentadol 2.5 0.9993 95 7 30<br />
Zopiclone 10.0 0.9911 102 12 20<br />
Norbuprenorphine 25.0 0.9955 124 19 30<br />
7-Aminoflunitrazepam 5.0 0.9993 91 12 40<br />
Zolpidem 1.0 0.9994 96 11 200<br />
Citalopram 2.5 0.9996 101 7 50<br />
Fentanyl 1.0 0.9996 97 14 70<br />
Buprenorphine 5.0 0.9996 99 2 40<br />
Doxepin 5.0 0.9996 100 9 90<br />
Paroxetine 5.0 0.9994 88 2 100<br />
Promethazine 1.0 0.9997 94 12 30<br />
Nortriptyline 1.0 0.9990 101 8 50<br />
Amitriptyline 5.0 0.9995 92 7 100<br />
EDDP 5.0 0.9997 91 4 200<br />
Lorazepam 5.0 0.9994 99 13 20<br />
Sertraline 10.0 0.9946 113 23 40<br />
Methadone 1.0 0.9998 101 5 3<br />
Clonazepam 2.5 0.9997 104 6 20<br />
Flunitrazepam 1.0 0.9996 90 9 10<br />
Diazepam 2.5 0.9994 84 6 40<br />
16<br />
www.restek.com | 1-800-356-1688 or 1-814-353-1300 | Feedback? E-mail advantage@restek.com
esponse of the individual compound. All calibration curves employed<br />
1/x weighting. As shown in Table I, good linearity was achieved with correlation<br />
coefficient values exceeding 0.999 for most compounds.<br />
LOQs were determined by evaluating signal-to-noise ratios for the<br />
three transitions used for each compound, and values ranged from<br />
1 ng/mL to 5 ng/mL for most compounds. Several analytes had LOQs of<br />
10 ng/mL; only norbuprenorphine had an LOQ of 25 ng/mL, which was<br />
expected since it is a poor responder and usually requires further sample<br />
preparation. With the exception of methadone, the quantification<br />
ion for each compound had a signal-to-noise ratio of ≥10 at the LOQ,<br />
and each qualifier ion had a signal-to-noise ratio of ≥3. Because methadone<br />
was a very high responder, the first two transitions for this drug<br />
overloaded the detector at higher concentrations, so only the third transition<br />
was used for quantification. The first two transitions may be used,<br />
but detuning these transitions is recommended to reduce response and<br />
improve linearity.<br />
Accuracy and Reproducibility<br />
Accuracy and precision at the LOQ were assessed for each compound;<br />
acceptable ranges were considered to be 90-110% recovery and ≤15%<br />
coefficient of variation (CV). Accuracy ranged from 88% to 113% for all<br />
analytes except norbuprenorphine, which typically is not determined<br />
using a dilute-and-shoot method. Precision results ranged from 1% to<br />
23%, and all compounds except for codeine, norbuprenorphine, and<br />
sertraline had passing results of ≤15% CV for precision (Table I).<br />
Since retention time shifts can be a source of downtime and sample<br />
reanalysis, retention time reproducibility across multiple column lots<br />
was also evaluated. Replicate injections of a 1 µg/mL solvent standard<br />
were analyzed on three different lots of Ultra Biphenyl columns under<br />
the same conditions used for the samples. Retention times for each<br />
compound were determined and the maximum retention time variation<br />
across all three lots of analytical columns was just 0.13 minutes. This<br />
indicates retention times are stable and predictable, which minimizes<br />
the need to reset retention time windows when columns are changed.<br />
Conclusion<br />
Partial validation results indicate this method is suitable for the quantification<br />
of a broad range of therapeutic drugs and metabolites in urine at<br />
levels ranging from 1-1,000 ng/mL. By using a highly reproducible 5 µm<br />
Ultra Biphenyl column and the multi-drug method conditions established<br />
here, labs can reduce downtime and improve productivity.<br />
For additional clinical/forensic articles, visit www.restek.com/cft<br />
A Fresh,<br />
New Style<br />
Coming Soon!<br />
www.restek.com/NewBox<br />
Ultra Biphenyl Columns (USP L11)<br />
Physical Characteristics:<br />
particle size: 3 µm or 5 µm, spherical<br />
pore size: 100 Å<br />
carbon load: 15%<br />
endcap: fully endcapped<br />
pH range: 2.5 to 8<br />
temperature limit: 80 °C<br />
Description<br />
cat.#<br />
5 µm Columns<br />
100 mm, 2.1 mm ID 9109512<br />
Figure 1: Analysis of 29 drug compounds and metabolites at 100 ng/mL in urine on an Ultra Biphenyl column.<br />
Peaks<br />
RT (min)<br />
11. Tapentadol 2.52<br />
1. Morphine 0.95<br />
12. Zopiclone 2.52<br />
2. Oxymorphone 1.08<br />
13. Norbuprenorphine 2.62<br />
3. Pregabalin 1.29<br />
14. 7-Aminoflunitrazepam 2.65<br />
4. Hydromorphone 1.34<br />
15. Zolpidem 2.69<br />
5. Gabapentin 1.56<br />
16. Citalopram 2.87<br />
6. Codeine 2.16<br />
17. Fentanyl 2.87<br />
7. Codeine-d3 (IS) 2.16<br />
18. Buprenorphine 2.89<br />
8. Oxycodone 2.29<br />
19. Doxepin 2.92<br />
9. Hydrocodone 2.33<br />
20. Doxepin-d3 (IS) 2.92<br />
10. 7-Aminoclonazepam 2.49<br />
21. Paroxetine 2.95<br />
For MRM transitions, visit www.restek.com and enter LC_CF0535 in the search.<br />
22. Promethazine 2.97<br />
23. Nortriptyline 3.02<br />
24. Amitriptyline 3.07<br />
25. EDDP 3.08<br />
26. Lorazepam 3.08<br />
27. Sertraline 3.09<br />
28. Methadone 3.11<br />
29. Clonazepam 3.17<br />
30. Flunitrazepam 3.31<br />
31. Diazepam 3.37<br />
32. Diazepam-d5 (IS) 3.37<br />
Column: Ultra Biphenyl (cat.# 9109512); Dimensions: 100 mm x 2.1 mm ID; Particle Size: 5 µm; Pore Size: 100 Å; Temp.: 30 °C; Diluent:<br />
Water:acetonitrile (90:10) + 0.1% formic acid; Conc.: 100 ng/mL (final dilution = 20x); Inj. Vol.: 30 µL; Mobile Phase: A: Water + 0.1%<br />
formic acid, B: Acetonitrile + 0.1% formic acid; Gradient (%B): 0 min (10%), 1.00 min (10%), 3.5 min (100%), 4.0 min (100%), 4.1 min (10%),<br />
5.5 min (10%); Flow: 0.6 mL/min; Detector: AB SCIEX API 4000 MS/MS; Model #: API 4000; Ion Source: TurboIonSpray®; Ion Mode: ESI+;<br />
Ion Spray Voltage: 3000 kV; Curtain Gas: 40 psi (275.8 kPa); Gas 1: 60 psi (413.7 kPa); Gas 2: 60 psi (413.7 kPa); Interface Temp.: 600 °C;<br />
Mode: MRM; Instrument: API LC-MS/MS. Notes: A 5 µm, 10 mm x 2.1 mm Ultra Biphenyl guard column (cat.# 910950212) was used in<br />
conjunction with this analysis.<br />
Sample Preparation:<br />
- Fortify urine at 100 ng/mL.<br />
- To 1 mL of urine, add 1 mL of 100 mM ammonium acetate (pH = 5.6) containing 2,000 units of β-glucuronidase from E. coli<br />
(Sigma-Aldrich cat# G7396).<br />
- Incubate for 90 minutes at 37 °C.<br />
- Centrifuge at 3,000 rpm for 15 minutes.<br />
- Dilute 100 µL of sample with 900 µL of water:acetonitrile (90:10) + 0.1% formic acid containing 4 ng/mL internal standard.<br />
(Total dilution factor = 20x)<br />
LC_CF0535<br />
www.restek.com | 1-800-356-1688 or 1-814-353-1300 | Feedback? E-mail advantage@restek.com 17
Find the Best LC-MS Column/Mobile Phase Combination<br />
Using a Simple Mobile Phase, USLC® Columns, and a Scouting Gradient<br />
By Rick Lake and Ty Kahler<br />
• Simplifying your mobile and<br />
stationary phase options will<br />
streamline method development.<br />
• USLC® technology effectively<br />
narrows your columns options<br />
from over 600 down to four.<br />
• A scouting gradient makes it<br />
easy to select the best column/<br />
mobile phase combination.<br />
If we’ve learned anything from developing<br />
methods (and probably more from struggling<br />
with them), it’s that you will generate<br />
more robust methods in less time if you start<br />
by looking at retention and selectivity. First,<br />
simplify your mobile phase; then, reduce<br />
your column options. Finally, run a scouting<br />
gradient to choose the right column/mobile<br />
phase combination based on your desired<br />
elution profile.<br />
Reduce Your Mobile Phase<br />
Possibilities<br />
When developing a method, the number of<br />
mobile phases you have to choose from is<br />
nearly infinite, so it’s easy to become overwhelmed.<br />
What’s more, using a highly customized<br />
mobile phase may not be necessary—it<br />
could even be detrimental to your data. Long<br />
story short, it’s in your best interest to simplify.<br />
We advise employing a four–mobile phase<br />
system and the recommendations in Table I.<br />
When the time comes for your scouting gradient,<br />
run all four A/B combinations (e.g., A1/B1,<br />
A1/B2, A2/B1, A2/B2) and select your mobile<br />
phase based on the results.<br />
18<br />
Table I: Run these aqueous solutions and organic solvents using a four–mobile phase system<br />
and our USLC® columns to dramatically simplify mobile phase selection.<br />
Aqueous Solutions<br />
Organic Solvents<br />
A1) 0.1% Formic acid in water B1) Acetonitrile (aprotic solvent)<br />
A2) 0.1% Formic acid and 5 mM ammonium formate in water B2) Methanol (protic solvent)<br />
Make the Most of the USLC® Column Set<br />
Unlike with mobile phases, there are “only” around 600 different columns on the market. But, column<br />
phase chemistry can be so similar between product lines and even manufacturers that switching<br />
may do little to alter your results. Instead of wasting time and money running column after column<br />
with nearly identical selectivity—and getting similar results—simply plug the USLC® column set into<br />
your column-switching system. Designed with the method developer in mind, this innovative column<br />
set offers an incredible range of alternate selectivity using just four unique stationary phases.<br />
USLC® phases are so different from each other (i.e., orthogonal) that they offer selectivity and retention<br />
regardless of your target analytes.<br />
Scout for Successful Method Development<br />
Evaluating, or “scouting,” your column/mobile phase combinations will allow you to determine<br />
which works best for your desired elution profile. To perform a scouting gradient, set your instrument<br />
to deliver a defined, linear gradient slope over a specified time. Start with the aqueous solution<br />
at 5%, and starting at time 0, begin ramping up to 95% using the flow rate and gradient time listed<br />
in Table II for your column. (If you have sample solubility issues, you can deviate from the starting or<br />
ending ratios, but be sure to keep the gradient defined and linear.) After each gradient, don’t forget<br />
to equilibrate the column using the time in Table II before running the next mobile phase.<br />
Choose Phases Based on Selectivity, Retention, and Elution Profile<br />
When your scouting run is complete, you will have a set of 16 chromatograms (one for each column/<br />
mobile phase combination). To choose the best column/mobile phase combination, you must first<br />
calculate the ideal elution profile for each by looking at the difference in retention time between the<br />
first and last peaks (Δt) and the gradient time (tG). A Δt/tG less than 0.25 would mean that an isocratic<br />
elution is feasible; a Δt/tG greater than 0.25 would indicate the need for a gradient.<br />
Second, look at your peaks. The column and mobile phase combination that delivers the best retention,<br />
selectivity, and peak shape for your desired elution profile is the one you should choose for<br />
your method (Figure 1). It’s that easy! For an in-depth look at the role of selectivity in reversed phase<br />
separations, check out www.restek.com/USLCarticle<br />
At this point, you may find that you are already achieving complete chromatographic resolution<br />
and can continue developing your method without giving another thought to mobile or stationary<br />
phase selection. If, however, your results are less than ideal, visit www.restek.com/USLCguide for<br />
help fine-tuning your mobile phase.<br />
www.restek.com | 1-800-356-1688 or 1-814-353-1300 | Feedback? E-mail advantage@restek.com
Summary<br />
It is said that the first step is the hardest, but it can be the easiest when you start your method<br />
development by simplifying your mobile phase and focusing on selectivity and retention to<br />
choose a column/mobile phase combination based on your desired elution profile. With this<br />
dependable approach, scouting gradients and USLC® columns are a method developer’s most<br />
effective tool. To learn more about LC column selectivity or the USLC® column set, visit<br />
www.restek.com/uslc<br />
Table II: Use these time settings to achieve a defined, linear gradient slope that is ideal for<br />
mobile phase scouting.<br />
Column Inner<br />
Diameter (mm)<br />
2.1<br />
3.0<br />
4.6<br />
Column Dimensions<br />
Time Settings<br />
Column Length Particle Diameter Flow Rate<br />
Gradient Time<br />
Post Gradient<br />
(mm)<br />
(µm)<br />
(mL/min)<br />
(tG)<br />
Equilibration Time (min)<br />
1.9 0.6 2 1<br />
30<br />
3 0.3 4 2<br />
5 0.2 6 2<br />
1.9 0.6 4 1<br />
50<br />
3 0.3 7 3<br />
5 0.2 10 4<br />
1.9 0.6 7 3<br />
100<br />
3 0.3 13 5<br />
5 0.2 20 8<br />
1.9 1.1 4 1<br />
50<br />
3 0.7 6 2<br />
5 0.4 10 4<br />
1.9 1.1 7 3<br />
100<br />
3 0.7 13 5<br />
5 0.4 21 8<br />
1.9 1.1 11 6<br />
150<br />
3 0.7 19 11<br />
5 0.4 31 17<br />
50<br />
3 1.5 6 3<br />
5 1.0 10 4<br />
100<br />
3 1.5 13 5<br />
5 1.0 19 8<br />
150<br />
3 1.5 19 8<br />
5 1.0 29 11<br />
250<br />
3 1.5 32 13<br />
5 1.0 49 19<br />
RESTEK USLC ®<br />
Ultra Selective Liquid Chromatography <br />
All the Right Tools—<br />
All in One Box<br />
Introducing the USLC® Method<br />
Development Toolbox<br />
• USLC® method development toolbox<br />
contains all four USLC® stationary phases<br />
in one convenient package.<br />
• Available for UHPLC (1.9 μm) and<br />
HPLC (3 or 5 μm) in 50, 100, or<br />
150 mm lengths.<br />
• Included selection guide makes it<br />
even easier to pick the right column<br />
the first time.<br />
www.restek.com/toolbox<br />
Choose Columns Fast.<br />
Develop Methods Faster.<br />
Figure 1: Choosing the ideal column/mobile phase combination for a method is simple if you run a scouting gradient using a four–<br />
mobile phase system and the USLC® four column set. The 16 chromatograms from your scouting run will fall into one of four categories.<br />
Void<br />
Time<br />
Retention<br />
factor (k) is 2<br />
Recommended<br />
for LC-MS!<br />
1. DO NOT USE this column/mobile phase<br />
combination for reversed phase LC.<br />
Δt/tG is less than 0.25, but<br />
retention is too limited.<br />
2.<br />
3.<br />
Choose this column/mobile phase<br />
combination for isocratic analyses.<br />
Δt/tG is less than 0.25, and<br />
retention is acceptable.<br />
Choose this column/mobile phase combination for<br />
long gradient analyses or if unknown peaks are an issue.<br />
Δt/tG is greater than 0.25, retention<br />
acceptable, and selectivity is higher.<br />
4. Choose this column/mobile phase combination<br />
for fast, shallow gradient analyses.<br />
Δt/tG is greater than 0.25, retention<br />
acceptable, and selectivity is lower.<br />
www.restek.com | 1-800-356-1688 or 1-814-353-1300 | Feedback? E-mail advantage@restek.com 19
RESTEK REFINED<br />
innovative petrochemical solutions<br />
Improve Trace Analysis of Polar Impurities in Petroleum Gases<br />
Using Higher Sample Capacity Alumina MAPD Columns<br />
By Rick Morehead, Jan Pijpelink, and Jaap de Zeeuw<br />
• Increased sample capacity results in improved peak shape and better accuracy.<br />
• Optimized deactivation results in highest response for polar hydrocarbons.<br />
• Rt®-Alumina BOND/MAPD columns give more flexibility in choice of sample size.<br />
When using PLOT columns to analyze trace impurities in petroleum<br />
gases, such as propylene, ethylene, or 1,3-butadiene, sample capacity<br />
(loadability) is an important factor in obtaining accurate data. Phase<br />
overload in adsorption chromatography results in peak tailing, which<br />
can be problematic when trace-level impurities elute near the main<br />
component where they may be obscured by the larger peak. Peak<br />
tailing can be further exacerbated by residual activity on the adsorbent<br />
surface. Using a column with higher sample capacity and an<br />
appropriate deactivation is a good strategy for reducing tailing and<br />
improving quantification accuracy for low level polar hydrocarbon<br />
impurities in volatile hydrocarbon streams.<br />
MAPD-type alumina PLOT columns are commonly used for these<br />
applications because the selectivity and degree of deactivation of<br />
the alumina makes it very useful for separating the polar hydrocarbon<br />
analytes from the main C1-C5 components of the hydrocarbon<br />
matrix. Although selectivity is very good for these compounds, sample<br />
capacity is often a challenge, which limits the amount of sample<br />
that can be injected. Larger sample volumes can be desirable when<br />
less sensitive detectors (e.g. TCDs) are used or when trace levels of<br />
impurities, such as acetylene, propadiene, or methyl acetylene, must<br />
be detected in main hydrocarbon streams in order to prevent damage<br />
to polymerization catalysts.<br />
Higher Retention With Good Peak Shape Yields<br />
Higher Loadability<br />
New Rt®-Alumina BOND/MAPD columns have an improved deactivation<br />
and an increased sample capacity compared to other commercially<br />
available MAPD PLOT columns. As shown in a comparison<br />
of absolute retention times, the new MAPD column offers more than<br />
twice the retention which results in greater resolution and increased<br />
sample capacity (Figure 1). In this figure the absolute retention of<br />
MAPD columns was compared using an isothermal oven temperature<br />
of 130 °C. Note that on the Rt®-Alumina BOND/MAPD column all<br />
the C1-C5 hydrocarbons are well resolved and show perfect Gaussian<br />
peak shape.<br />
Greater Sample Capacity Improves Accuracy<br />
To assess sample capacity, each column was tested at the temperature<br />
shown on the manufacturer’s QA protocol in order to achieve comparable<br />
retention. A range of sample volumes of a QA test mix were analyzed<br />
on each column using a 6-port sampling valve and 5 µL to 250 µL<br />
sample loops. Peak tailing was measured for the analytes that were<br />
most likely to exhibit tailing and to be sensitive to poor sample capacity<br />
in actual impurity testing. As shown in Figure 2, much less peak tailing<br />
was observed on the Rt®-Alumina BOND/MAPD column. Symmetrical<br />
peaks were obtained across a wide sample volume range, indicating<br />
that the column deactivation was highly effective and that sample<br />
capacity was greater on the Rt®-Alumina BOND/MAPD column. Linearity<br />
was also assessed, as shown in Figure 3, and excellent correlations were<br />
achieved for all target impurities across the test range.<br />
Summary<br />
When analyzing impurities, such as acetylene, propadiene, and methyl<br />
acetylene in petroleum gases, the sample handling capacity of the analytical<br />
column is an important consideration. Rt®-Alumina BOND/MAPD<br />
columns offer higher sample capacity than other commercially available<br />
MAPD columns and are recommended for analyzing polar impurities in<br />
light hydrocarbon streams. Greater sample capacity improves data accuracy<br />
due to better peak symmetry and a wide linear range.<br />
For more information on Rt®- and MXT®-Alumina BOND/MAPD PLOT<br />
columns, visit www.restek.com/MAPD<br />
20<br />
www.restek.com | 1-800-356-1688 or 1-814-353-1300 | Feedback? E-mail advantage@restek.com
Figure 1: Rt®-Alumina BOND/MAPD columns have greater absolute retention than Select Al2O3 MAPD columns, resulting in greater sample<br />
handling capacity through increased resolution.<br />
A: Rt®-Alumina BOND/MAPD B: Select Al2O3 MAPD<br />
2<br />
3<br />
4<br />
5<br />
6<br />
9<br />
Higher retention results in greater<br />
sample handling capacity and more<br />
flexibility in sample size.<br />
10<br />
14<br />
15<br />
11<br />
12 13<br />
5<br />
9<br />
4<br />
2<br />
3<br />
7,8<br />
6<br />
10 14<br />
11<br />
12<br />
15<br />
13<br />
8<br />
16<br />
1<br />
7<br />
1<br />
17<br />
16<br />
17<br />
GC_PC1213<br />
0 2<br />
4 6 8 10 12 14<br />
Time (min)<br />
GC_PC1214<br />
0 2 4 6 8 10 12 14<br />
Columns: 50 m x 0.53 mm ID x 10 µm; Sample: PLOT column QA test mix (DCG# 547267); Injection: 5 µL, split, 200 °C; Split vent flow rate: 80 mL/min; Oven: 130 °C, isothermal; Carrier Gas: helium, (4.4 psi, 30 kPa);<br />
Detector: FID, 200 °C. Peaks: 1. Methane, 2. Ethane, 3. Ethylene, 4. Propane, 5. Cyclopropane, 6. Propylene, 7. Acetylene, 8. Propadiene, 9. n-Butane, 10. trans-2-Butene, 11. 1-Butene, 12. Isobutene, 13. cis-2-Butene, 14.<br />
Isopentane, 15. n-Pentane, 16. 1,3-Butadiene, 17. Methyl acetylene.<br />
min.<br />
Figure 2: Higher sample capacity is also<br />
demonstrated by comparing peak symmetry.<br />
Rt®-Alumina BOND/MAPD columns<br />
produce better peak shape, even<br />
when more material is injected.<br />
Figure 3: Higher sample capacity results in a wide linear range and accurate quantification,<br />
even at levels that can produce tailing and incomplete separations on other MAPD<br />
columns. (green = methyl acetylene, red = acetylene, blue = propadiene).<br />
A: Rt®-Alumina BOND/MAPD<br />
Higher sample capacity<br />
gives good peak shape and<br />
improved accuracy.<br />
3<br />
1<br />
2<br />
4<br />
4.2 4.4 4.6 4.8<br />
Time (min)<br />
GC_PC1216<br />
B: Select Al2O3 MAPD<br />
Poor sample capacity<br />
results in overloaded<br />
peaks and inaccurate<br />
quantification.<br />
Alumina BOND/MAPD PLOT Columns<br />
Rt®-Alumina BOND/MAPD Columns (fused silica PLOT)<br />
ID df temp. limits 30-Meter 50-Meter<br />
0.32 mm 5 µm to 250 °C 19779 19780<br />
0.53 mm 10 µm to 250 °C 19777 19778<br />
MXT®-Alumina BOND/MAPD Columns (Siltek®-treated stainless steel PLOT)<br />
7” diameter<br />
3.5” coil<br />
11-pin cage<br />
ID df temp. limits 30-Meter 30-Meter<br />
0.53 mm 10 µm to 250 °C 79728-273<br />
79728<br />
GC_PC1215<br />
Columns: 50 m x 0.53 mm ID x 10 µm; Sample: PLOT column QA<br />
test mix (DCG# 547267); Injection: 5-250 µL, split, 200 °C; Split<br />
vent flow rate: 80 mL/min; Oven: manufacturer’s recommended<br />
temperature used for each column (Rt®-Alumina BOND/MAPD:<br />
130 °C, Select Al2O3 MAPD: 100 °C), isothermal (hold 8 min);<br />
Carrier Gas: helium, (4.4 psi, 30 kPa); Detector: FID, 200 °C.<br />
Peaks: 1. Acetylene, 2. Propadiene, 3. n-Butane.<br />
tech tip<br />
Traces of water in the carrier gas and sample will affect the retention and selectivity of alumina. If the column is exposed to<br />
water, the retention times will shorten. Alumina columns can be regenerated by conditioning for 15-30 minutes at 200-250 °C<br />
under normal carrier gas flow. Periodic conditioning ensures excellent run-to-run retention time reproducibility.<br />
The maximum programmable temperature for Rt®- and MXT®-Alumina BOND/MAPD columns is 250 °C. Higher temperatures<br />
cause irreversible changes to the porous layer adsorption properties.<br />
www.restek.com | 1-800-356-1688 or 1-814-353-1300 | Feedback? E-mail advantage@restek.com 21
Innovators in Chromatography<br />
A continuing series of guest editorials contributed by collaborators and internationally recognized leaders in chromatography.<br />
Matrix Effects in Multi-Residue Pesticide<br />
Analysis When Using Liquid Chromatography-<br />
Tandem Mass Spectrometry<br />
By Kai Zhang, Ph.D., U.S. FDA Center for Food Safety and Applied Nutrition<br />
Dr. Zhang is a Chemist in the Methods Development Branch of the U.S. FDA Center for<br />
Food Safety and Applied Nutrition. His research interests focus on trace analysis of various<br />
contaminants, such as pesticides and mycotoxins, in foods using LC-MS and GC-MS.<br />
Consumption of pesticide-contaminated food via daily diet is a major source of<br />
exposure to pesticides and poses a potential health threat to humans. It is necessary<br />
to monitor various pesticide residues in foods via multi-residue analysis<br />
procedures, because it would be impractical to develop individual analytical<br />
methods for every pesticide in suspected food commodities. The availability of<br />
liquid chromatography-tandem mass spectrometry (LC-MS/MS) has improved<br />
the selectivity and sensitivity of pesticide analysis, as well as workflow in the<br />
identification and quantification of various classes of pesticides in agricultural<br />
products. This leads to the development and use of LC-MS/MS multi-residue<br />
methods in laboratories worldwide to do consistent, targeted quantitative pesticides<br />
analysis from a single injection, providing increased sensitivity and the<br />
ability to screen a large number of target pesticides in one method.<br />
The effect of the matrix is a phenomenon in electrospray ionization (ESI) LC-<br />
MS/MS analysis that impacts the data quality of the pesticide analysis. Matrix<br />
effects, caused by analyte and matrix component interactions, are unique to<br />
ESI-based LC-MS/MS instrumentation and present one of today’s most challenging<br />
analytical issues. Matrix effects can take the form of interference or signal<br />
suppression/enhancement (when compared to a pure analytical standard) and<br />
depend on the sample matrix, target analytes, and mode of ionization. Studies<br />
of matrix effects are essential to the application of LC-MS/MS with different food<br />
22<br />
www.restek.com | 1-800-356-1688 or 1-814-353-1300 | Feedback? E-mail advantage@restek.com
commodities. A thorough understanding of matrix effects<br />
would yield fundamental insights for different food matrices,<br />
corresponding sample preparation, and subsequent instrument<br />
performance, thus allowing major application needs<br />
(identification and quantitation) to be addressed.<br />
The effect of the matrix is a phenomenon<br />
in electrospray ionization (ESI) LC-MS/MS<br />
analysis that impacts the data quality …<br />
and presents one of today’s most<br />
challenging analytical issues.<br />
cation and can be resolved by using non-interfering MRM<br />
transitions, extensive sample cleanup, or improving the LC<br />
separation. Increased mass/charge selectivity, which can be<br />
acquired by using a high resolution accurate mass spectrometer,<br />
can help minimize matrix interference.<br />
Matrix effects may also be caused by interactions (via van<br />
der Waals, dipolar-dipolar, or electrostatic forces) between<br />
pesticides and co-extractives in the prepared sample that<br />
could suppress or enhance the ionization of a pesticide in<br />
the ESI source. This can result in a lower or higher signal,<br />
which affects the accuracy of the quantitative results. Several<br />
approaches have been used to minimize the signal suppression<br />
or enhancement resulting from the matrix components.<br />
These include extensive sample cleanup, improvement of the<br />
LC separation to avoid coelutions with matrix components, or<br />
serial dilution of the final extract, such that fewer matrix components<br />
will be injected into the analytical system. Splitting<br />
of the LC eluent flow before entering the mass spectrometer<br />
may also help eliminate matrix suppression or enhancement.<br />
Unlike the above approaches, standard addition, internal<br />
standards, or matrix-matched calibration curves are commonly<br />
used to compensate for, but not to reduce, signal suppression<br />
or enhancement.<br />
None of the above approaches will completely eliminate<br />
matrix effects. Increased selectivity (e.g., using specific transitions<br />
or improving mass resolution/accuracy) can minimize<br />
matrix interferences, but signal suppression or enhancement<br />
may still be observed because signal alteration happens in<br />
the ion source prior to detection. Using dilution or a smaller<br />
injection volume requires more sensitive instruments and<br />
Generally, there are two types of matrix effects—matrix<br />
interference and signal alteration. Matrix interference can be<br />
caused by those coeluting components in sample extracts<br />
that have similar ions in the MS/MS experiment. This type<br />
of matrix effect can lead to false positive/negative identifiintroduces<br />
more error, in terms of accuracy<br />
and precision, for quantitative<br />
results. Additionally, optimal dilution<br />
factors depend on food matrices, instrument<br />
sensitivity, target pesticides, and<br />
LC conditions, so it is time-consuming<br />
to optimize the experimental conditions.<br />
Using internal standards might be<br />
too expensive to apply in multi-residue<br />
analysis. Matrix-matched calibration is<br />
commonly used for quantitation, but<br />
there are disadvantages associated with<br />
this approach. First, it is hard to collect<br />
blank matrix for each food commodity.<br />
Second, analytes in a matrix-matched<br />
environment are different from those in<br />
real samples, in which the analytes first<br />
interact with the matrix components<br />
and then are “modified” by sample<br />
preparation. Matrix-matched calibration<br />
standards would alleviate matrix<br />
effects on quantification only if sample<br />
matrices remained the same before and<br />
after the sample preparation, which is<br />
impossible to achieve. Therefore, this<br />
approach might only work well for<br />
simple matrices such as fresh produce,<br />
but not for more complex matrices,<br />
such as botanical samples. Third, it is laborious<br />
and time-consuming to prepare<br />
matrix-matched calibration standards<br />
for routine analysis, especially when<br />
samples of different commodities have<br />
to be analyzed on daily basis.<br />
Obviously, the lack of well-suited approaches<br />
for circumventing matrix<br />
effects requires us to systematically<br />
investigate the problem so that, in<br />
theory, we will be able to describe and<br />
define the interactions between matrix<br />
components and analytes. In practice,<br />
we can quantitatively measure matrix<br />
effects and estimate the impact on<br />
quantitation and identification. At the<br />
present time, LC-MS/MS is known as the<br />
best instrument for target analysis and<br />
quantitation; however, it is limited by<br />
an incomplete understanding of matrix<br />
effects. This presents a significant challenge<br />
to researchers working to harness<br />
the sensitivity, selectivity, and specificity<br />
of LC-MS/MS to meet the growing<br />
need for better multi-residue analysis<br />
procedures.<br />
www.restek.com | 1-800-356-1688 or 1-814-353-1300 23
A Fresh, New Style for <strong>Restek</strong>!<br />
“As we transition through our supply of boxes, you will<br />
see more of this new and improved look. Rest assured,<br />
the products inside are the same high-quality, genuine<br />
<strong>Restek</strong> products you currently rely on. We hope you like<br />
the new face of <strong>Restek</strong> and we welcome your comments!”<br />
Dennis Claspell, Director of Marketing<br />
How Did We Do?<br />
We want to know what you think about our new appearance—<br />
as well as what product improvements you would like to<br />
see from us.<br />
Give us your feedback at www.restek.com/NewBox<br />
Lit. Cat.# GNAD1535-UNV<br />
© 2012 <strong>Restek</strong> Corporation. All rights reserved.<br />
Printed in the U.S.A.<br />
<strong>Restek</strong> U.S. • 110 Benner Circle • Bellefonte, PA 16823 • 1-814-353-1300 • 1-800-356-1688 • fax: 1-814-353-1309 • www.restek.com<br />
<strong>Restek</strong> France • phone: +33 (0)1 60 78 32 10 • fax: +33 (0)1 60 78 70 90 • www.restek.fr<br />
<strong>Restek</strong> GmbH • phone: +49 (0)6172 2797 0 • fax: +49 (0)6172 2797 77 • www.restekgmbh.de<br />
<strong>Restek</strong> Ireland • phone: +44 (0)2890 814576 • fax: +44 (0)2890 814576 • e-mail: restekireland@aol.com<br />
<strong>Restek</strong> Japan • phone: +81 (3)6459 0025 • fax: +81 (3)6459 0025 • e-mail: restekjapan@restek.com<br />
Thames <strong>Restek</strong> U.K. LTD • phone: +44 (0)1494 563377 • fax: +44 (0)1494 564990 • www.thamesrestek.co.uk