Volume 49 ⢠Number 4 ⢠August 2012 - 192.38.112.111
Volume 49 ⢠Number 4 ⢠August 2012 - 192.38.112.111
Volume 49 ⢠Number 4 ⢠August 2012 - 192.38.112.111

Create successful ePaper yourself
Turn your PDF publications into a flip-book with our unique Google optimized e-Paper software.
790 J. B. C. Harris et al.<br />
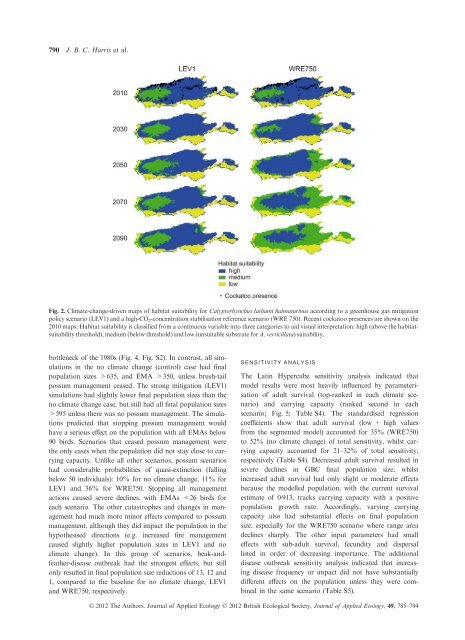
Fig. 2. Climate-change-driven maps of habitat suitability for Calyptorhynchus lathami halmaturinus according to a greenhouse gas mitigation<br />
policy scenario (LEV1) and a high-CO 2 -concentration stabilisation reference scenario (WRE 750). Recent cockatoo presences are shown on the<br />
2010 maps. Habitat suitability is classified from a continuous variable into three categories to aid visual interpretation: high (above the habitatsuitability<br />
threshold), medium (below threshold) and low (unsuitable substrate for A. verticillata) suitability.<br />
bottleneck of the 1980s (Fig. 4, Fig. S2). In contrast, all simulations<br />
in the no climate change (control) case had final<br />
population sizes >635, and EMA >350, unless brush-tail<br />
possum management ceased. The strong mitigation (LEV1)<br />
simulations had slightly lower final population sizes than the<br />
no climate change case, but still had all final population sizes<br />
>595 unless there was no possum management. The simulations<br />
predicted that stopping possum management would<br />
have a serious effect on the population with all EMAs below<br />
90 birds. Scenarios that ceased possum management were<br />
the only cases when the population did not stay close to carrying<br />
capacity. Unlike all other scenarios, possum scenarios<br />
had considerable probabilities of quasi-extinction (falling<br />
below 50 individuals): 10% for no climate change, 11% for<br />
LEV1 and 36% for WRE750. Stopping all management<br />
actions caused severe declines, with EMAs