The Pharmaceutical Price Regulation Scheme - Office of Fair Trading
The Pharmaceutical Price Regulation Scheme - Office of Fair Trading
The Pharmaceutical Price Regulation Scheme - Office of Fair Trading

Create successful ePaper yourself
Turn your PDF publications into a flip-book with our unique Google optimized e-Paper software.
February 2007<br />
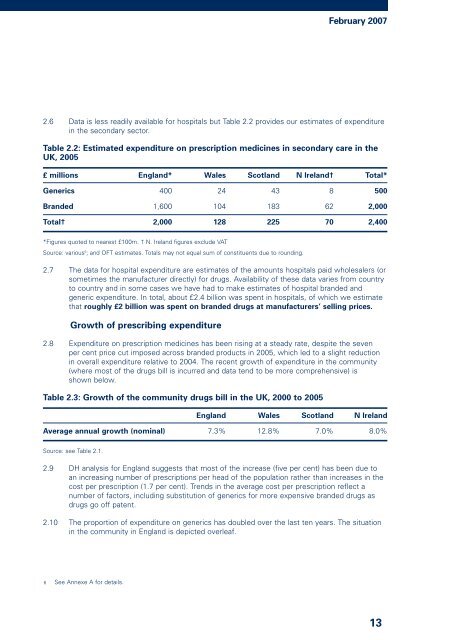
2.6 Data is less readily available for hospitals but Table 2.2 provides our estimates <strong>of</strong> expenditure<br />
in the secondary sector.<br />
Table 2.2: Estimated expenditure on prescription medicines in secondary care in the<br />
UK, 2005<br />
£ millions England* Wales Scotland N Ireland† Total*<br />
Generics 400 24 43 8 500<br />
Branded 1,600 104 183 62 2,000<br />
Total† 2,000 128 225 70 2,400<br />
*Figures quoted to nearest £100m. † N. Ireland figures exclude VAT<br />
Source: various 6 ; and OFT estimates. Totals may not equal sum <strong>of</strong> constituents due to rounding.<br />
2.7 <strong>The</strong> data for hospital expenditure are estimates <strong>of</strong> the amounts hospitals paid wholesalers (or<br />
sometimes the manufacturer directly) for drugs. Availability <strong>of</strong> these data varies from country<br />
to country and in some cases we have had to make estimates <strong>of</strong> hospital branded and<br />
generic expenditure. In total, about £2.4 billion was spent in hospitals, <strong>of</strong> which we estimate<br />
that roughly £2 billion was spent on branded drugs at manufacturers’ selling prices.<br />
Growth <strong>of</strong> prescribing expenditure<br />
2.8 Expenditure on prescription medicines has been rising at a steady rate, despite the seven<br />
per cent price cut imposed across branded products in 2005, which led to a slight reduction<br />
in overall expenditure relative to 2004. <strong>The</strong> recent growth <strong>of</strong> expenditure in the community<br />
(where most <strong>of</strong> the drugs bill is incurred and data tend to be more comprehensive) is<br />
shown below.<br />
Table 2.3: Growth <strong>of</strong> the community drugs bill in the UK, 2000 to 2005<br />
England Wales Scotland N Ireland<br />
Average annual growth (nominal) 7.3% 12.8% 7.0% 8.0%<br />
Source: see Table 2.1.<br />
2.9 DH analysis for England suggests that most <strong>of</strong> the increase (five per cent) has been due to<br />
an increasing number <strong>of</strong> prescriptions per head <strong>of</strong> the population rather than increases in the<br />
cost per prescription (1.7 per cent). Trends in the average cost per prescription reflect a<br />
number <strong>of</strong> factors, including substitution <strong>of</strong> generics for more expensive branded drugs as<br />
drugs go <strong>of</strong>f patent.<br />
2.10 <strong>The</strong> proportion <strong>of</strong> expenditure on generics has doubled over the last ten years. <strong>The</strong> situation<br />
in the community in England is depicted overleaf.<br />
6 See Annexe A for details.<br />
13