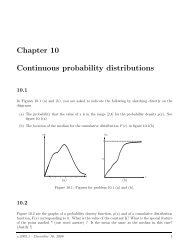
Chapter 8 Exponential functions - Ugrad.math.ubc.ca
Chapter 8 Exponential functions - Ugrad.math.ubc.ca
Chapter 8 Exponential functions - Ugrad.math.ubc.ca

Create successful ePaper yourself
Turn your PDF publications into a flip-book with our unique Google optimized e-Paper software.
<strong>Chapter</strong> 8<br />
<strong>Exponential</strong> <strong>functions</strong><br />
8.1<br />
Graph the following <strong>functions</strong>:<br />
(a) f(x) = x 2 e −x<br />
(b) f(x) = ln(x 2 + 3)<br />
(c) f(x) = ln(e 2x )<br />
8.2<br />
Express the following in terms of base e:<br />
(a) y = 3 x<br />
(b) y = 1<br />
7 x<br />
(c) y = 15 x2 +2<br />
Express the following in terms of base 2:<br />
(d) y = 9 x<br />
(e) y = 8 x<br />
(f) y = −e x2 +3<br />
Express the following in terms of base 10:<br />
(g) y = 21 x<br />
(h) y = 1000 −10x<br />
(i) y = 50 x2 −1<br />
v.2005.1 - September 4, 2009 1
Math 102 Problems <strong>Chapter</strong> 8<br />
8.3<br />
Compare the values of each pair of numbers (i.e. indi<strong>ca</strong>te which is larger):<br />
(a) 5 0.75 , 5 0.65<br />
(b) 0.4 −0.2 , 0.4 0.2<br />
(c) 1.001 2 , 1.001 3<br />
(d) 0.999 1.5 , 0.999 2.3<br />
8.4<br />
Rewrite each of the following equations in logarithmic form:<br />
(a) 3 4 = 81<br />
(b) 3 −2 = 1 9<br />
(c) 27 −1 3 =<br />
1<br />
3<br />
8.5<br />
Solve the following equations for x:<br />
(a) ln x = 2 ln a + 3 lnb<br />
(b) log a x = log a b − 2 3 log a c<br />
8.6 Reflections and transformations<br />
What is the relationship between the graph of y = 3 x and the graph of each of the following<br />
<strong>functions</strong>?<br />
(a) y = −3 x (b) y = 3 −x (c) y = 3 1−x<br />
(d) y = 3 |x| (e) y = 2 · 3 x (e) y = log 3 x<br />
8.7<br />
Solve the following equations for x:<br />
(a) e 3−2x = 5<br />
(b) ln(3x − 1) = 4<br />
(c) ln(ln(x)) = 2<br />
(d) e ax = Ce bx , where a ≠ b and C > 0.<br />
v.2005.1 - September 4, 2009 2
Math 102 Problems <strong>Chapter</strong> 8<br />
8.8<br />
Find the first derivative for each of the following <strong>functions</strong>:<br />
(a) y = ln(2x + 3) 3<br />
(b) y = ln 3 (2x + 3)<br />
(c) y = ln(cos 1 x) 2<br />
(d) y = log a (x 3 − 2x) (Hint :<br />
d<br />
dx (log a x) = 1<br />
x ln a )<br />
(e) y = e 3x2<br />
(f) y = a −1 2 x<br />
(g) y = x 3 · 2 x<br />
(h) y = e ex<br />
(i) y = et − e −t<br />
e t + e −t<br />
8.9<br />
Find the maximum and minimum points as well as all inflection points of the following <strong>functions</strong>:<br />
(a) f(x) = x(x 2 − 4)<br />
(b) f(x) = x 3 − ln(x), x > 0<br />
(c) f(x) = xe −x<br />
(d) f(x) = 1<br />
1−x + 1<br />
1+x , −1 < x < 1<br />
(e) f(x) = x − 3 3√ x<br />
(f) f(x) = e −2x − e −x<br />
8.10<br />
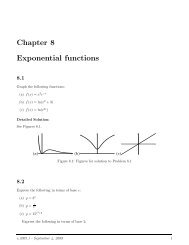
Shown in Figure 8.10 is the graph of y = Ce kt for some constants C, k, and a tangent line. Use<br />
data from the graph to determine C and k.<br />
v.2005.1 - September 4, 2009 3
Math 102 Problems <strong>Chapter</strong> 8<br />
(0, 4)<br />
y = Ce kt<br />
(2, 0)<br />
Figure 8.1: Figure for Problem 8.10<br />
8.11<br />
Consider the two <strong>functions</strong><br />
(a) y 1 (t) = 10e −0.1t ,<br />
(b) y 2 (t) = 10e 0.1t .<br />
Which one is decreasing and which one is increasing? In each <strong>ca</strong>se, find the value of the function at<br />
t = 0. Find the time at which the increasing function has doubled from this initial value. Find the<br />
time at which the decreasing function has fallen to half of its initial value. [Remark: these values<br />
of t are <strong>ca</strong>lled, the doubling time, and the half-life, respectively]<br />
8.12 Shannon Entropy<br />
In a recent appli<strong>ca</strong>tion of information theory to the field of genomics, a function <strong>ca</strong>lled the Shannon<br />
entropy, H, was considered. A given gene is represented as a binary device: it <strong>ca</strong>n be either “on”<br />
or “off” (i.e. being expressed or not). If x is the probability that the gene is “on” and y is the<br />
probability that it is “off”, the Shannon entropy function for the gene is defined as<br />
H = −x log(x) − y log(y)<br />
[Remark: the fact that x and y are probabilities, just means that they satisfy 0 < x ≤ 1, and<br />
0 < y ≤ 1.] The gene <strong>ca</strong>n only be in one of these two states, so x + y = 1. Use these facts to show<br />
that the Shannon entropy for the gene is greatest when the two states are equally probable, i.e. for<br />
x = y = 0.5.<br />
8.13 A threshold function<br />
The response of a regulatory gene to inputs that affect it is not simply linear. Often, the following<br />
so <strong>ca</strong>lled “squashing function” or “threshold function” is used to link the input x to the output y<br />
v.2005.1 - September 4, 2009 4
Math 102 Problems <strong>Chapter</strong> 8<br />
of the gene.<br />
where a, b are constants.<br />
y = f(x) =<br />
1<br />
1 + e (ax+b)<br />
(a) Show that 0 < y < 1.<br />
(b) For b = 0 and a = 1 sketch the shape of this function.<br />
(c) How does the shape of the graph change as a increases?<br />
8.14<br />
Sketch the graph of the function y = e −t sin πt.<br />
8.15 The Mexi<strong>ca</strong>n Hat<br />
Find the criti<strong>ca</strong>l points of the function<br />
y = f(x) = 2e −x2 − e −x2 /3<br />
and determine the value of f at those criti<strong>ca</strong>l points. Use these results and the fact that for very<br />
large x, f → 0 to draw a rough sketch of the graph of this function. Comment on why this function<br />
might be <strong>ca</strong>lled “a Mexi<strong>ca</strong>n Hat”. (Note: The second derivative is not very informative here, and<br />
we will not ask you to use it for determining con<strong>ca</strong>vity in this example. However, you may wish to<br />
<strong>ca</strong>lculate it just for practice with the chain rule.)<br />
8.16 The Ricker Equation<br />
In studying salmon populations, a model often used is the Ricker equation which relates the size of<br />
a fish population this year, x to the expected size next year y. (Note that these populations do not<br />
change continuously, since all the parents die before the eggs are hatched.) The Ricker equation is<br />
y = αxe −βx<br />
where α, β > 0. Find the value of the current population which maximizes the salmon population<br />
next year according to this model.<br />
8.17 Spacing in a fish school<br />
Life in a social group has advantages and disadvantages: protection from predators is one advantage.<br />
Disadvantages include competition with others for food or resources. Spacing of individuals in a<br />
school of fish or a flock of birds is determined by the mutual attraction and repulsion of neighbors<br />
from one another: each individual does not want to stray too far from others, nor get too close.<br />
v.2005.1 - September 4, 2009 5
Math 102 Problems <strong>Chapter</strong> 8<br />
Suppose that when two fish are at distance x > 0 from one another, they are attracted with<br />
“force” F a and repelled with “force” F r given by:<br />
F a = Ae −x/a<br />
F r = Re −x/r<br />
where A, R, a, r are positive constants. A, R are related to the magnitudes of the forces, and a, r to<br />
the spatial range of these effects.<br />
(a) Show that at the distance x = a the first function has fallen to (1/e) times its value at the<br />
origin. (Re<strong>ca</strong>ll e ≈ 2.7.) For what value of x does the second function fall to (1/e) times<br />
its value at the origin? Note that this is the reason why a, r are <strong>ca</strong>lled spatial ranges of the<br />
forces.<br />
(b) It is generally assumed that R > A and r < a. Interpret what this mean about the comparative<br />
effects of the forces and sketch a graph showing the two <strong>functions</strong> on the same set of axes.<br />
(c) Find the distance at which the forces exactly balance. This is <strong>ca</strong>lled the comfortable distance<br />
for the two individuals.<br />
(d) If either A or R changes so that the ratio R/A decreases, does the comfortable distance<br />
increase or decrease? (Give reason.)<br />
(e) Similarly comment on what happens to the comfortable distance if a increases or r decreases.<br />
8.18 Seed distribution<br />
The density of seeds at a distance x from a parent tree is observed to be<br />
D(x) = D 0 e −x2 /a 2 ,<br />
where a > 0, D 0 > 0 are positive constants. Insects that eat these seeds tend to congregate near<br />
the tree so that the fraction of seeds that get eaten is<br />
F(x) = e −x2 /b 2<br />
where b > 0. (Remark: These <strong>functions</strong> are <strong>ca</strong>lled Gaussian or Normal distributions. The parameters<br />
a, b are related to the “width” of these bell-shaped curves.) The number of seeds that survive<br />
(i.e. are produced and not eaten by insects) is<br />
S(x) = D(x)(1 − F(x))<br />
Determine the distance x from the tree at which the greatest number of seeds survive.<br />
v.2005.1 - September 4, 2009 6
Math 102 Problems <strong>Chapter</strong> 8<br />
8.19 Euler’s “e”<br />
In 1748, Euler wrote a classic book on <strong>ca</strong>lculus (“Introductio in Analysin Infinitorum”) in which<br />
he showed that the function e x could be written in an expanded form similar to an (infinitely long)<br />
polynomial:<br />
e x = 1 + x + x2<br />
1 · 2 + x3<br />
1 · 2 · 3 + ...<br />
Use as many terms as necessary to find an approximate value for the number e and for 1/e to 5<br />
decimal places. Remark: we will see later that such expansions, <strong>ca</strong>lled power series, are central to<br />
approximations of many <strong>functions</strong>.<br />
v.2005.1 - September 4, 2009 7