Water Density & the Ocean Lesson Plan Middle & High ... - cosee now
Water Density & the Ocean Lesson Plan Middle & High ... - cosee now
Water Density & the Ocean Lesson Plan Middle & High ... - cosee now

Create successful ePaper yourself
Turn your PDF publications into a flip-book with our unique Google optimized e-Paper software.
<strong>Water</strong> <strong>Density</strong> and <strong>the</strong> <strong>Ocean</strong><br />
Developed by: Katie Gardner, Kate Florio, Cathy Yehas, Aly Busse<br />
Topic: Explore <strong>the</strong> role of temperature and salinity in changing <strong>the</strong> density of water samples. Observe and<br />
discuss <strong>the</strong> impact of density differences in <strong>the</strong> ocean.<br />
Audience: Grades 9 and up.<br />
Length: 45 - 60 min<br />
NJ State Standards: (scale with student’s grade level)<br />
Objectives:<br />
5.1.A – Understand Scientific Explanations<br />
5.2.A – Properties of Matter<br />
5.4.G – Biogeochemical Cycles<br />
Establish some properties that define an ocean habitat.<br />
Observe interactions different water masses have with each o<strong>the</strong>r based on density.<br />
Learn techniques to determine water properties like salinity and temperature, calculate density of<br />
water samples.<br />
Use collected measurements and calculations to explain observations and support reasoning.<br />
Introduction:<br />
What can you tell me about ocean properties? Why do scientists care about, and measure properties like<br />
salinity and temperature? <strong>Ocean</strong> water properties such as salinity and temperature create a spectrum of<br />
different water masses and habitats in <strong>the</strong> ocean. We will focus this experiment on how different water<br />
masses interact with each o<strong>the</strong>r in <strong>the</strong> ocean. Different water samples will be prepared and experimented<br />
with, controlling variables of temperature and salinity.<br />
Background:<br />
The ocean can be divided into many different zones, depending on <strong>the</strong> water property being used. Light<br />
penetration can define photic zone, aphotic zone; as one example of this. The focus of this lesson will be <strong>the</strong><br />
impacts of properties like temperature and salinity on seawater. The term water mass refers to a body of<br />
water that has consistent physical properties, such as salinity and temperature. There are multitudes of water<br />
masses in <strong>the</strong> ocean that are divided by density differences; <strong>the</strong>y do not require a physical barrier to conserve<br />
<strong>the</strong>ir unique physical properties. The differences in density are one mechanism that drives vertical<br />
circulation of <strong>the</strong> ocean. The physical properties of <strong>the</strong> ocean are important to <strong>the</strong> biology as well; many<br />
marine animals ei<strong>the</strong>r remain within a water mass favorable to <strong>the</strong>ir needs, or must adapt to changing water<br />
masses.<br />
Materials:<br />
One 250mL volume beaker per student<br />
Several stirring rods<br />
2 different colors of food coloring (i.e. red and blue)<br />
Salt – prefer kosher or aquarium salt (dissolves faster)<br />
One Small Petri dish or watch glass per 2 students plus a few extras
Procedure:<br />
One density tank per pair of students 1<br />
Hot pot<br />
One 2L beaker (for ice water)<br />
Ice<br />
Ready supply of water<br />
Paper towels (in case of spills)<br />
Scales with maximum mass rating of at least 3000g<br />
Probe ware with conductivity and temperature probes.<br />
One 400mL beaker per Probe ware setup<br />
Student worksheets (<strong>Water</strong>Mass_Worksheet_<strong>High</strong>.pdf)<br />
I. Preparation<br />
1. Set up stations with scales<br />
2. Set up stations with Probe ware, and rinse water in 400 mL beakers<br />
3. Set out student beakers, density tanks, and o<strong>the</strong>r needed materials.<br />
4. Pre-measure salt into small Petri dishes or watch glasses.<br />
a. Vary <strong>the</strong> quantity of salt in <strong>the</strong> dishes from a little to a lot.<br />
b. The largest quantity of salt available to students should still dissolve easily into <strong>the</strong>ir water<br />
sample.<br />
5. Immediately before <strong>the</strong> lesson:<br />
a. Fill <strong>the</strong> 2L beaker with ice and top off with water.<br />
b. Fill hot pots with water, and turn on.<br />
II. Activity<br />
1. Instructor will introduce <strong>the</strong> lesson, and explain that students will work in pairs for this experiment.<br />
Explain all <strong>the</strong> steps of this experiment to students in <strong>the</strong> order <strong>the</strong>y need to be performed in, and<br />
briefly explain how to use <strong>the</strong> density tank when <strong>the</strong>y reach that step.<br />
2. Pass out worksheet.<br />
a. Have students decide with <strong>the</strong>ir partner what kind of water sample <strong>the</strong>y will make. Students<br />
each make <strong>the</strong>ir own water sample, but <strong>the</strong>y MUST vary at least one variable from <strong>the</strong>ir<br />
partner’s sample. They may choose hot or cold water, and fresh or salty water. They must<br />
also decide who will have red water, and who will have blue water (<strong>the</strong>y must have two<br />
different colors between <strong>the</strong>m).<br />
b. Have students record <strong>the</strong>ir water sample decision on <strong>the</strong>ir worksheet.<br />
c. Have students record <strong>the</strong>ir hypo<strong>the</strong>sis on <strong>the</strong>ir worksheet.<br />
3. Students will prepare <strong>the</strong> water samples as planned.<br />
a. Measure <strong>the</strong> mass of <strong>the</strong> empty beaker<br />
b. Add salt, if any, to <strong>the</strong> beaker, <strong>the</strong>n fill to <strong>the</strong> 200mL line of beaker<br />
i. For Hot <strong>Water</strong> Samples: Instructor should fill to 125 mL mark from Hot Pot <strong>the</strong>n<br />
dilute <strong>the</strong> temperature with tap water to <strong>the</strong> 200 mL mark. (This is to prevent burns to<br />
students, and make beakers comfortable to handle)<br />
ii. For Cold <strong>Water</strong> Samples: Fill 200mL beaker from <strong>the</strong> ice water. If ice water runs out,<br />
refill <strong>the</strong> 2L beaker with more water, <strong>the</strong> ice will chill it fast.<br />
c. Add several drops of food coloring. (Instructor may wish to do this step to prevent stains to<br />
clo<strong>the</strong>s and skin)<br />
d. Use stirring rod to ensure sample is well mixed and salt, if any, dissolves.<br />
1 A density tank is a divided tank with moveable center barrier. Small versions of <strong>the</strong>se can be purchased<br />
from science teaching supply catalogs, or instructions to make one can be found online. They are used to<br />
teach ocean and meteorological science concepts. We use: http://sciencekit.com/ig0029656/p/IG0029656/
e. Measure <strong>the</strong> mass and volume of <strong>the</strong> filled beaker<br />
f. Use probe ware to measure conductivity and temperature.<br />
4. Pass out density tanks to each pair of students; ensure <strong>the</strong> center barrier is in place.<br />
5. Perform density experiment. (Instructor may need to demonstrate how to use <strong>the</strong> density tank).<br />
a. Students pour water samples into <strong>the</strong> tank simultaneously, one on each side of <strong>the</strong> divider.<br />
b. Once <strong>the</strong> water has stilled, pull out <strong>the</strong> divider in one smooth motion.<br />
6. After observing <strong>the</strong> results, students will record <strong>the</strong>ir observations on <strong>the</strong> worksheet.<br />
7. Perform <strong>the</strong> calculations listed on worksheet.<br />
8. Students will record <strong>the</strong>ir conclusions about <strong>the</strong> relationship of density to <strong>the</strong> observed behavior of <strong>the</strong><br />
water samples in <strong>the</strong> density tanks.<br />
Evaluation:<br />
Have students record whe<strong>the</strong>r <strong>the</strong>ir hypo<strong>the</strong>sis was correct; why or why not? What affect does<br />
density have on <strong>the</strong> behavior of water in <strong>the</strong> density tanks? What can students think of that water<br />
density might impact in <strong>the</strong> ocean?<br />
Extension:<br />
Show visuals of real-time data of <strong>the</strong> New Jersey Coast displaying sea surface temperature and<br />
salinity. Display data collected by gliders of temperature and salinity at depth (along Rutgers<br />
University, Institute of Coastal Marine Studies IMCS endurance line*). See if students can explain<br />
any observed differences between <strong>the</strong> surface data, and that collected from depth. What impact do<br />
differences in water density have in <strong>the</strong> ocean? How would you relate <strong>the</strong> concepts of temperature,<br />
salinity, and density to ocean habitat?<br />
Safety Precautions:<br />
Hot water could cause burns; care should be exercised with this portion of <strong>the</strong> activity.<br />
If salt water gets in eyes, flush immediately with plenty of fresh water. The salt should not be harmful to<br />
vision, but can sting.<br />
Resources:<br />
Link to glider data: http://marine.rutgers.edu/cool/auvs/ including endurance line (eline project)
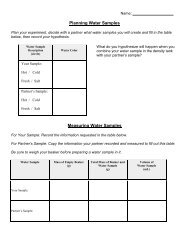
Name:<br />
Measuring <strong>Water</strong> Samples<br />
For Your Sample: Record <strong>the</strong> information requested in <strong>the</strong> table below.<br />
For Partner’s Sample: Copy <strong>the</strong> information your partner recorded and measured to fill out this table.<br />
<strong>Water</strong> Sample<br />
Description<br />
(circle)<br />
<strong>Water</strong><br />
Color<br />
Mass of Empty<br />
Beaker<br />
(Listed on glass)<br />
(g)<br />
Total Mass of<br />
Beaker and<br />
<strong>Water</strong> Sample<br />
(g)<br />
Volume of<br />
<strong>Water</strong> Sample<br />
(mL)<br />
Temperature<br />
(°C)<br />
Conductivity<br />
(µS/cm)<br />
Your Sample:<br />
Hot / Cold<br />
Fresh / Salt<br />
Partner’s<br />
Sample:<br />
Hot / Cold<br />
Fresh / Salt<br />
1. What do you hypo<strong>the</strong>size will happen when you perform <strong>the</strong> experiment in <strong>the</strong> density tank<br />
with your sample, and your partner’s sample?<br />
2. Record your observations of <strong>the</strong> density tank: write at least one sentence about what you<br />
observed happen within your density tank.
2<br />
Calculating <strong>Water</strong> <strong>Density</strong><br />
Name:<br />
Use <strong>the</strong> data you recorded, to support your observations. Perform <strong>the</strong> calculations below, <strong>the</strong>n<br />
explain those observations with <strong>the</strong> results of <strong>the</strong>se calculations.<br />
3. Your Sample:<br />
Total Mass of Beaker and<br />
<strong>Water</strong> Sample<br />
g - g = g<br />
Mass of<br />
Empty Beaker<br />
Mass of <strong>Water</strong> Sample<br />
g / mL = g/mL<br />
Mass of <strong>Water</strong> Sample Volume of <strong>Water</strong> Sample <strong>Density</strong> of <strong>Water</strong> Sample<br />
Fill in <strong>the</strong> table using your calculation, and your partner’s.<br />
<strong>Water</strong> Sample <strong>Water</strong> Color <strong>Density</strong> of <strong>Water</strong> Sample<br />
Your Sample:<br />
Partner’s Sample:<br />
4. Explain why you think your water samples behaved in your density tank <strong>the</strong> way <strong>the</strong>y did, use<br />
your calculations to support your argument.
2<br />
Comparing <strong>Water</strong> Properties<br />
Name:<br />
Use <strong>the</strong> data you recorded, to compare <strong>the</strong> properties of yours and your partner’s samples. Perform <strong>the</strong> calculations<br />
below, and <strong>the</strong>n answer <strong>the</strong> questions.<br />
1. Calculating Salinity:<br />
(µS/cm) X 0.00064 = PPT<br />
Your Sample’s<br />
Conductivity<br />
Conversion<br />
Factor<br />
Salinity of Your<br />
Sample<br />
(µS/cm) X 0.00064 = PPT<br />
Partner’s Sample<br />
Conductivity<br />
Conversion<br />
Factor<br />
Salinity of Partner’s<br />
Sample<br />
2. Salinity Differences<br />
Calculate <strong>the</strong> difference in Salinity values between Your Sample, and Partner’s Sample. To make <strong>the</strong> math<br />
cleaner, put <strong>the</strong> largest value from <strong>the</strong> calculations above on <strong>the</strong> first blank.<br />
PPT - PPT = PPT<br />
Larger Salinity Value Smaller Salinity Value Salinity Difference<br />
3. Temperature Differences<br />
Calculate <strong>the</strong> difference in Temperature values between Your Sample, and Partner’s Sample. To make <strong>the</strong> math<br />
cleaner, put <strong>the</strong> largest measured value on <strong>the</strong> first blank.<br />
Larger Temperature Value<br />
°C - °C = °C<br />
Smaller Temperature<br />
Value<br />
Temperature Difference<br />
<strong>Water</strong> Sample<br />
Temperature of<br />
<strong>Water</strong> Sample<br />
Temperature<br />
Difference<br />
Salinity of <strong>Water</strong><br />
Sample<br />
Salinity Difference<br />
<strong>Density</strong> of <strong>Water</strong><br />
Sample<br />
Your Sample:<br />
Partner’s Sample:<br />
4. Which water property (Salinity or Temperature) appears to influence density <strong>the</strong> most? Use your data to support<br />
your answer.