Additional information - comdirect bank AG
Additional information - comdirect bank AG
Additional information - comdirect bank AG

Create successful ePaper yourself
Turn your PDF publications into a flip-book with our unique Google optimized e-Paper software.
148<br />
|<br />
<strong>Additional</strong> <strong>information</strong><br />
53 Equity management<br />
Through equity management, <strong>comdirect</strong> <strong>bank</strong> aims to meet regulatory capital requirements, to maintain adequate<br />
capital levels at all times to ensure that the <strong>bank</strong> has the capacity to act, and to achieve an appropriate<br />
return on equity.<br />
Risk-bearing capacity<br />
The risk-bearing capacity calculation, i.e. the economic capital requirement as compared to the available risk<br />
cover potential, is used to limit the overall risk of the <strong>bank</strong> in conjunction with the capital levels. The overall risk<br />
position represents <strong>comdirect</strong>’s economic capital requirements for all key risk types (operational risk, credit risk,<br />
market risk, model risk and business risk). The risk cover potential comprises the subscribed capital, capital reserve<br />
and retained earnings, result and the revaluation reserve after tax. Other intangible assets, such as software<br />
licences or internally generated software and deferred tax are deducted from the risk cover potential as correction<br />
items. The risk-bearing capacity is guaranteed as long as the risk cover potential available exceeds the total risk<br />
exposure.<br />
The economic capital is measured using the value-at-risk approach (VaR) based on a confidence level of 99.91%<br />
and a holding period of one year.<br />
The <strong>comdirect</strong> group’s more sophisticated risk-bearing capacity concept was implemented in January 2011. Compared<br />
to the end of the previous year, both subscribed capital and correction items for other intangible assets and<br />
deferred tax assets and liabilities were taken into account in the risk cover potential. After-tax amounts also are<br />
used to calculate the result and the revaluation reserve. Model risks have also been taken into account as key risk<br />
types in calculating the total risk exposure since 2011.<br />
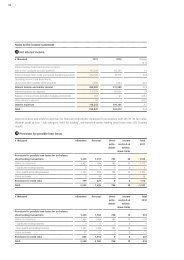
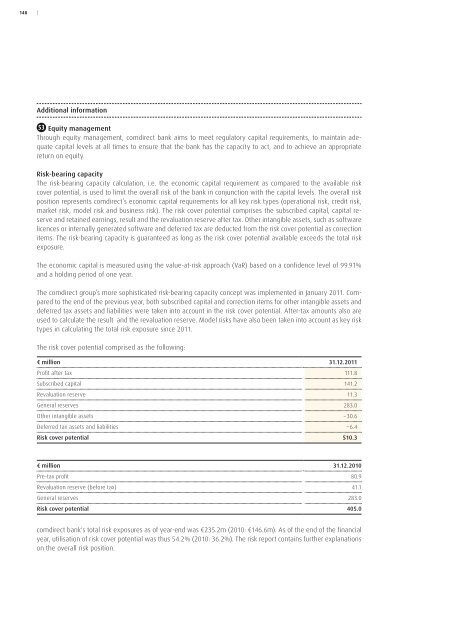
The risk cover potential comprised as the following:<br />
€ million 31.12.2011<br />
Profit after tax 111.8<br />
Subscribed capital 141.2<br />
Revaluation reserve 11.3<br />
General reserves 283.0<br />
Other intangible assets – 30.6<br />
Deferred tax assets and liabilities – 6.4<br />
Risk cover potential 510.3<br />
€ million 31.12.2010<br />
Pre-tax profit 80.9<br />
Revaluation reserve (before tax) 41.1<br />
General reserves 283.0<br />
Risk cover potential 405.0<br />
<strong>comdirect</strong> <strong>bank</strong>'s total risk exposures as of year-end was €235.2m (2010: €146.6m). As of the end of the financial<br />
year, utilisation of risk cover potential was thus 54.2% (2010: 36.2%). The risk report contains further explanations<br />
on the overall risk position.
| FOREWORD | THE BOARD OF MAN<strong>AG</strong>ING DIRECTORS | CORPORATE GOVERNANCE | GROUP MAN<strong>AG</strong>EMENT REPORT | CONSOLIDATED FINANCIAL STATEMENTS | 149<br />
Equity resources in accordance with Section 10, German Banking Act (KWG)<br />
<strong>comdirect</strong> <strong>bank</strong> <strong>AG</strong> is an institution registered in Germany and is a subordinate company within an institution<br />
group pursuant to Section 10a (1) of the German Banking Act (KWG). In this capacity, <strong>comdirect</strong> <strong>bank</strong> <strong>AG</strong> has<br />
exercised the waiver under Section 2a of the German Banking Act (KWG). <strong>comdirect</strong> <strong>bank</strong> <strong>AG</strong> is included in<br />
the regulatory report of the Commerz<strong>bank</strong> Group.<br />
The regulatory capital of <strong>comdirect</strong> <strong>bank</strong> <strong>AG</strong> is determined on the basis of the regulations of the German Banking<br />
Act (KWG) and the results of the calculation are used for internal management purposes. A separate notification<br />
of this is not submitted to the regulatory authorities. The equity in <strong>comdirect</strong> <strong>bank</strong> <strong>AG</strong>’s individual financial statements<br />
in accordance with the requirements of the German Commercial Code (HGB) is used as a basis.<br />
Banking regulatory capital requirements were complied with at all times during the reporting year. At <strong>comdirect</strong><br />
<strong>bank</strong> <strong>AG</strong>, the own funds ratio as of the end of the financial year stood at 40.14% (in accordance with Section 2 (6)<br />
of the Solvency Regulation (SolvV)).<br />
€ thousand 31.12.2011 31.12.2010 Change<br />
in %<br />
Subscribed capital 141,221 141,221 0.0<br />
General reserves 218,110 218,110 0.0<br />
Deducted items – 3,406 – 3,167 7.5<br />
Core capital 355,925 356,164 – 0.1<br />
Liable equity 355,898 356,137 – 0.1<br />
Own funds for SolvV 351,263 351,144 0.0<br />
Risk-weighted assets 513,871 545,674 – 5.8<br />
Eligible amount for operational risks,<br />
multiplied by 12.5 361,213 271,075 33.3<br />
Total 875,084 816,749 7.1<br />
54 Maturities, by remaining lifetime<br />
Remaining lifetimes as of 31 December 2011<br />
€ thousand Total Due on<br />
demand<br />
Up to<br />
three<br />
More than<br />
three<br />
More than<br />
one to five<br />
More than<br />
five years<br />
and unlimited<br />
in time<br />
months months to<br />
one year<br />
years<br />
Claims on <strong>bank</strong>s 6,711,938 353,579 771,106 860,512 4,586,741 140,000<br />
Claims on customers 224,691 223,757 934 0 0 0<br />
Bonds and other fixed-income securities in<br />
the “available-for-sale” portfolio 3,829,733 0 335,473 1,223,281 2,193,685 77,294<br />
Total 10,766,362 577,336 1,107,513 2,083,793 6,780,426 217,294<br />
Liabilities to <strong>bank</strong>s 3,244 3,244 0 0 0 0<br />
Liabilities to customers 10,723,015 9,693,791 291,534 130,780 463,626 143,284<br />
Total 10,726,259 9,697,035 291,534 130,780 463,626 143,284
150<br />
|<br />
Remaining lifetimes as of 31 December 2010<br />
€ thousand Total Due on<br />
demand<br />
Up to<br />
three<br />
More than<br />
three<br />
More than<br />
one to five<br />
More than<br />
five years<br />
and unlimited<br />
in time<br />
months months to<br />
one year<br />
years<br />
Claims on <strong>bank</strong>s 5,894,248 1,067,915 1,617,726 635,434 2,412,673 160,500<br />
Claims on customers 235,885 234,870 1,015 0 0 0<br />
Bonds and other fixed-income securities in<br />
the “available-for-sale” portfolio 4,637,045 0 396,569 490,045 3,684,254 66,177<br />
Total 10,767,178 1,302,785 2,015,310 1,125,479 6,096,927 226,677<br />
Liabilities to <strong>bank</strong>s 40,779 40,779 0 0 0 0<br />
Liabilities to customers 10,368,068 9,423,183 269,216 253,067 339,075 83,527<br />
Total 10,408,847 9,463,962 269,216 253,067 339,075 83,527<br />
Time remaining to maturity is considered as the period between the balance sheet date and the contractual<br />
maturity of the claim or obligation.<br />
55 Claims on/liabilities to affiliated companies<br />
€ thousand 31.12.2011 31.12.2010 Change<br />
in %<br />
Assets<br />
Claims on <strong>bank</strong>s 6,665,625 5,704,904 16.8<br />
Financial investments 2,662,514 3,085,929 – 13.7<br />
Other assets 310 162 91.4<br />
Total 9,328,449 8,790,995 6.1<br />
Liabilities<br />
Liabilities to <strong>bank</strong>s 2,709 40,193 – 93.3<br />
Other liabilities 5,923 10,206 – 42.0<br />
Total 8,632 50,399 – 82.9<br />
Money and capital market investments carried out via companies in the Commerz<strong>bank</strong> Group are collateralised<br />
within the scope of a general assignment agreement.<br />
56 Risk reporting on financial instruments<br />
Risk management<br />
The risk strategy is determined by the Board of Managing Directors of <strong>comdirect</strong> <strong>bank</strong>, which also bears the<br />
responsibility for the group-wide risk management- and risk controlling system.<br />
At <strong>comdirect</strong> <strong>bank</strong>, the CFO is responsible for monitoring and implementing the risk strategy.<br />
The implementation and monitoring of the risk strategy is carried out through risk managment on the one hand<br />
and risk controlling on the other. The task of risk management is to proactively and consciously manage all risks in<br />
the relevant divisions. For effective value-oriented overall <strong>bank</strong> management, risk management is carried out on<br />
a decentralised basis in the individual divisions. The task of risk controlling is to identify, evaluate, limit and continually<br />
monitor risks and to report to the Board of Managing Directors regularly on the respective risk situation.
| FOREWORD | THE BOARD OF MAN<strong>AG</strong>ING DIRECTORS | CORPORATE GOVERNANCE | GROUP MAN<strong>AG</strong>EMENT REPORT | CONSOLIDATED FINANCIAL STATEMENTS | 151<br />
Credit risk<br />
The credit risk describes the risk of a financial loss as a result of a borrower being unable to pay or to pay on time<br />
the contractually agreed consideration.<br />
One of the methods used to monitor credit risk is the monthly calculation of the CVaR for lending to customers as<br />
well as for the treasury business. Credit risks are therefore part of overall <strong>bank</strong> management.<br />
Maximum credit risk<br />
The maximum default risk from financial instruments in the unlikely case of simultaneous complete default by all<br />
borrowers is equal to the book value of the finacial instrumens in question.<br />
The maximum default risk for Commerz<strong>bank</strong> group companies is €9,328m (2010: €8,791m). These default risks<br />
are fully covered by collateral via an assignment agreement with Commerz<strong>bank</strong> <strong>AG</strong>. Of the €224.7m (2010:<br />
€235.9m) in claims on customers on the balance sheet, default risks from securities loans in the amount of<br />
€150.0m (2010: €164.2m) are covered by securities pledged as collateral by customers.<br />
Credit quality of financial assets that are neither overdue nor impaired<br />
€ thousand 31.12.2011 31.12.2010 Change<br />
in %<br />
Banks 10,944,255 10,370,684 5.5<br />
Cash reserve 527,849 184,967 185.4<br />
Claims on <strong>bank</strong>s 6,711,938 5,894,275 13.9<br />
Financial investments 3,704,468 4,291,442 – 13.7<br />
– Bonds 3,704,468 4,291,442 – 13.7<br />
Retail customers 202,069 196,115 3.0<br />
– Claims on customers 202,069 196,115 3.0<br />
Public sector issuers 125,265 221,029 – 43.3<br />
Financial investments 125,265 221,029 – 43.3<br />
– Bonds 125,265 221,029 – 43.3<br />
Corporates 16,189 35,325 –54.2<br />
Claims on customers 16,189 35,325 –54.2<br />
Total 11,287,778 10,823,153 4.3<br />
Overdue, but as yet unimpaired financial assets<br />
€ thousand Claims on customers<br />
Age structure<br />
31.12.2011 31.12.2010 Change<br />
in %<br />
– 30 to 90 days 2,757 1,366 101.8<br />
– 91 to 179 days 653 283 130.7<br />
– 180 days and over 2,337 2,192 6.6<br />
Total 5,747 3,841 49.6
152<br />
|<br />
Individually impaired financial assets<br />
€ thousand Claims on customers<br />
31.12.2011 31.12.2010 Change<br />
in %<br />
Volume of claims individually impaired 1,269 1,085 17.0<br />
Impairment – 583 – 508 14.8<br />
Book value 686 577 18.9<br />
The risk report contains further details on the extent and cause on the credit risk, on risk management, quantification<br />
and reporting as well as <strong>information</strong> on the current risk situation.<br />
Liquidity risk<br />
Liquidity risk in the narrower sense is understood as the risk that the <strong>bank</strong> will be unable to meet or to meet on<br />
time its current and future payment obligations. The wider definition of liquidity risk also encompasses refinancing<br />
risk, that is the risk that the liquidity will no be sufficient if required or that it can only be acquired in<br />
the money and capital markets at terms that are significantly less favourable than expected – as well as market<br />
liquidity risk.<br />
The latter describes the risk of being unable to close out positions to the desired extent or only at a loss as a result<br />
of inadequate market depth or market disturbances.<br />
Payment claims under financial assets in accordance with contractually agreed maturities<br />
€ thousand Remaining lifetimes as of 31 December 2011<br />
Book value<br />
Due on<br />
Up to<br />
More than<br />
More than<br />
demand<br />
one year<br />
one to five<br />
five years<br />
years<br />
Non-derivative financial instruments<br />
– Cash reserve 527,849 527,849 0 0 0<br />
– Claims on <strong>bank</strong>s 6,711,938 353,579 1,645,014 4,997,366 195,881<br />
– Claims on customers 224,691 225,631 934 0 0<br />
– Bonds and notes 3,829,733 0 1,583,859 2,339,257 97,833<br />
Total 11,294,211 1,107,059 3,229,807 7,336,623 293,714<br />
€ thousand Remaining lifetimes as of 31 December 2010<br />
Book value<br />
Due on<br />
Up to<br />
More than<br />
More than<br />
demand<br />
one year<br />
one to five<br />
five years<br />
years<br />
Non-derivative financial instruments<br />
– Cash reserve 184,967 184,967 0 0 0<br />
– Claims on <strong>bank</strong>s 5,894,248 1,067,915 2,260,824 2,588,858 201,536<br />
– Claims on customers 235,885 236,523 1,015 0 0<br />
– Bonds and notes 4,637,045 0 959,770 3,909,891 80,143<br />
Total 10,952,145 1,489,405 3,221,609 6,498,749 281,679
| FOREWORD | THE BOARD OF MAN<strong>AG</strong>ING DIRECTORS | CORPORATE GOVERNANCE | GROUP MAN<strong>AG</strong>EMENT REPORT | CONSOLIDATED FINANCIAL STATEMENTS | 153<br />
Payment obligations under financial liabilities in accordance with contractually agreed maturities<br />
€ thousand Remaining lifetimes as of 31 December 2011<br />
Book value<br />
Due on<br />
Up to<br />
More than<br />
More than<br />
demand<br />
one year<br />
one to five<br />
five years<br />
years<br />
Non-derivative financial liabilities<br />
– Liabilities to <strong>bank</strong>s 3,244 3,244 0 0 0<br />
– Liabilities to customers 10,723,015 9,693,791 423,161 508,977 193,614<br />
Derivative financial liabilities<br />
– Negative fair values from<br />
derivative hedging instruments 4,496 0 3,624 7,234 0<br />
Credit obligations<br />
– Private customers 0 3,270,831 0 0 0<br />
Total 10,730,755 12,967,866 426,785 516,211 193,614<br />
€ thousand Remaining lifetimes as of 31 December 2010<br />
Book value<br />
Due on<br />
Up to<br />
More than<br />
More than<br />
demand<br />
one year<br />
one to five<br />
five years<br />
years<br />
Non-derivative financial liabilities<br />
– Liabilities to <strong>bank</strong>s 40,779 40,779 0 0 0<br />
– Liabilities to customers 10,368,068 9,423,183 524,406 379,970 114,121<br />
Derivative financial liabilities<br />
– Negative fair values from<br />
derivative hedging instruments 38 0 455 1,495 0<br />
Credit obligations<br />
– Private customers 0 2,951,663 0 0 0<br />
Total 10,408,885 12,415,625 524,861 381,465 114,121<br />
The risk report contains further details on the extent and causes of the liquidity risk, on risk management, quantification<br />
and reporting and <strong>information</strong> on the current risk situation.
154<br />
|<br />
Market risk<br />
Market price risks encompass the risk of loss from changes in market parameters (in particular interest rates,<br />
credit spreads, exchange rates and share prices).<br />
The statistical/mathematical approach of historic simulation to calculate the value-at-risk values is used to quantify<br />
and monitor general market price risks on a daily basis. The value-at-risk describes the maximum loss under<br />
normal market conditions for a specific probability (confidence level) and specific holding period. The underlying<br />
statistical parameters are based on a historic monitoring period of the past 255 trading days, a holding period of<br />
one day and a confidence level of 97.5%.<br />
The key feature of the historic simulation is that it does not use a parametric model for the risk factors. Historic<br />
market data and its empirical distribution function is used directly. A portfolio value is obtained for every day of<br />
the historic monitoring period. For a monitoring period of 255 days, a confidence level of 97.5% and a holding<br />
period of one day, the value-at-risk is the seventh highest daily loss in the historic monitoring period.<br />
Stress tests are carried out at <strong>comdirect</strong> <strong>bank</strong> <strong>AG</strong> to monitor extreme market movements. The stress figure shows<br />
the maximum portfolio loss under worst case conditions. The respective maximum losses in the scenarios for the<br />
share price, interest rate, credit spreads and foreign currency risk factors are added together and is shown in the<br />
overall stress volume.<br />
Market risks<br />
€ thousand As of end As of end Year high Year low Median Median<br />
of previous of year<br />
2011 2010<br />
year<br />
Total VaR* 97.5%<br />
Holding period 1 day 2,745 4,348 6,824 4,238 5,263 3,971<br />
Stress test – overall result 14,886 62,539 113,421 62,151 83,363 17,508<br />
*) In 2011 there was a change in measuring the VaR for the specific market risk (credit spreads) analoguous to the method applied to general market risks to the<br />
method of historic simulation. In addition credit spread risks from intragroup receivables are included in 2011. Due to the new classification the previous years’s<br />
firgures can not be determined.<br />
The risk report contains further details on the extent and causes of the market risk, on quantification and management<br />
and <strong>information</strong> on the current risk situation.
| FOREWORD | THE BOARD OF MAN<strong>AG</strong>ING DIRECTORS | CORPORATE GOVERNANCE | GROUP MAN<strong>AG</strong>EMENT REPORT | CONSOLIDATED FINANCIAL STATEMENTS | 155<br />
57 Fair Value of financial instruments<br />
The table below shows the fair values of balance sheet items compared to their book values. The fair value is the<br />
amount for which an asset can be exchanged or a liability settled between knowledgeable, willing parties in an<br />
arm’s length transaction. Where stock market prices were available, these were used for the measurement of<br />
financial instruments. In the event that no market price was available, measurements were carried out using internal<br />
measurement models with current market price parameters. In this connection, the net present value<br />
method was used in particular.<br />
€ thousand Fair value Book value<br />
31.12.2011 31.12.2010 31.12.2011 31.12.2010<br />
Loans and receivables<br />
– Cash reserve 527,849 184,967 527,849 184,967<br />
– Claims on <strong>bank</strong>s 6,680,670 5,905,829 6,711,938 5,894,248<br />
– Claims on customers 224,691 235,858 224,691 235,858<br />
Total 7,433,210 6,326,654 7,464,478 6,315,073<br />
Available for sale financial assets<br />
– Financial investments 3,861,587 4,670,995 3,861,587 4,670,995<br />
Total 3,861,587 4,670,995 3,861,587 4,670,995<br />
Liabilities measured at amortised cost<br />
– Liabilities to <strong>bank</strong>s 3,244 40,779 3,244 40,779<br />
– Liabilities to customers 10,707,396 10,405,802 10,723,015 10,368,068<br />
Total 10,710,640 10,446,581 10,726,259 10,408,847<br />
Other<br />
– Negative fair values from<br />
derivative hedging instruments 4,496 38 4,496 38<br />
For short-term claims on <strong>bank</strong>s of €1,136,677 thousand (2010: €2,685,641 thousand), short-term claims on customers<br />
of €224,691 thousand (2010: €235,858 thousand), short-term liabilities to <strong>bank</strong>s of €3,244 thousand<br />
(2010: €40,779 thousand) and short-term liabilities to customers of €3,305,102 thousand (2010: €4,293,183 thousand),<br />
the fair value was equated to the book value for simplification purposes. The level of liabilities to customers,<br />
where the economic maturities are subject to modelling, was extended significantly in the reporting year.
156<br />
|<br />
58 Fair Value hierarchy<br />
The following table contains the full portfolio of financial instruments that have been valued at fair value. The fair<br />
values are also classified into three levels:<br />
Level 1:<br />
Prices quoted in active markets (not adjusted) for identical assets or liabilities.<br />
Level 2:<br />
Exemplary prices calculated with the exception of the quoted prices included in Level 1, which can be observed<br />
for assets or liabilities either directly (i.e. as prices) or indirectly (i.e. derived from prices).<br />
Level 3:<br />
Exemplary prices calculated for assets or liabilities, which are not based on observable market data (non-observable<br />
input data).<br />
€ thousand 31.12.2011<br />
Total Level 1 Level 2 Level 3<br />
Available for sale financial assets<br />
– Financial investments 3,861,560 1,684,092 2,177,468 0<br />
Other<br />
– Negative fair values from<br />
derivative instruments 4,496 0 4,496 0<br />
Total 3,866,056 1,684,092 2,181,964 0<br />
€ thousand 31.12.2010<br />
Total Level 1 Level 2 Level 3<br />
Available for sale financial assets<br />
– Financial investments 4,670,968 1,678,189 2,992,779 0<br />
Other<br />
– Negative fair values from<br />
derivative instruments 38 0 38 0<br />
Total 4,671,006 1,678,189 2,992,817 0<br />
There were no significant transfers of financial instruments between Level 1 and Level 2 of the fair value<br />
hierarchy.
| FOREWORD | THE BOARD OF MAN<strong>AG</strong>ING DIRECTORS | CORPORATE GOVERNANCE | GROUP MAN<strong>AG</strong>EMENT REPORT | CONSOLIDATED FINANCIAL STATEMENTS | 157<br />
59 Net result from financial instruments<br />
The following table shows the net result before income tax per financial instrument category within the meaning<br />
of IAS 39.<br />
€ thousand 31.12.2011 31.12.2010 Change<br />
in %<br />
Loans and receivables<br />
– Interest income 152,575 96,711 57.8<br />
– Provisions for possible loan losses – 1,331 – 255 422.0<br />
Net result 151,244 96,456 56.8<br />
Available for sale financial assets<br />
– Fair value changes (recognised in equity) – 32,079 – 18,664 71.9<br />
– Valuation results reposted from the revaluation<br />
reserve to the income statement 2,886 414 597.1<br />
– Results of sales reposted from the revaluation<br />
reserve to the income statement 3,103 – 10,333 – 130.0<br />
Sub-total: change in revaluation reserve before tax – 26,090 – 28,583 – 8.7<br />
– Interest income 115,205 113,535 1.5<br />
– Dividends and similar income 1,309 1,033 26.7<br />
– Results from financial investments – 5,989 9,919 – 160.4<br />
– Change in hedged fair value from hedging instruments 2,542 – 122 – 2,183.6<br />
Net result 86,977 95,782 – 9.2<br />
Liabilities measured at amortised cost<br />
– Interest expenses – 117,778 – 109,143 7.9<br />
Net result – 117,778 – 109,143 7.9<br />
At fair value through profit or loss: held for trading<br />
– Trading result – 1,128 0 –<br />
Net result – 1,128 0 –<br />
Other: derivative hedging instruments<br />
– Net interest income – 394 – 64 515.6<br />
– Change in fair value from hedging instruments – 2,493 100 – 2,593.0<br />
Net result – 2,887 36 – 8,119.4
158<br />
|<br />
60 Average number of employees during the reporting period<br />
2011 2010 Change<br />
(Total) in %<br />
Total Female Male Total Female Male<br />
At <strong>comdirect</strong> <strong>bank</strong> <strong>AG</strong> 918 462 456 894 443 451 2.7<br />
– in the call centre 357 204 153 338 192 146 5.6<br />
– in the back office 130 99 31 132 97 35 – 1.5<br />
– in other areas 431 159 272 424 154 270 1.7<br />
At ebase GmbH 216 133 83 239 149 90 – 9.6<br />
Average number of<br />
employees during the<br />
reporting period 1,134 595 539 1,133 592 541 0.1<br />
The employee details listed above include full-time and part-time staff. The number of employees does not include<br />
the average number of trainees in the group in financial year 2011:<br />
2011 2010 Change<br />
(Total) in %<br />
Total Female Male Total Female Male<br />
At <strong>comdirect</strong> <strong>bank</strong> <strong>AG</strong> 23 8 15 23 13 10 0.0
| FOREWORD | THE BOARD OF MAN<strong>AG</strong>ING DIRECTORS | CORPORATE GOVERNANCE | GROUP MAN<strong>AG</strong>EMENT REPORT | CONSOLIDATED FINANCIAL STATEMENTS | 159<br />
61 Income statement of <strong>comdirect</strong> group according to IAS/IFRS – year-to-year comparison<br />
€ thousand 1.1. to<br />
31.12.2011<br />
1.1. to<br />
31.12.2010<br />
1.1. to<br />
31.12.2009<br />
1.1. to<br />
31.12.2008<br />
1.1. to<br />
31.12.2007<br />
Interest income 269,090 211,280 265,865 482,303 287,744<br />
Interest expenses 118,243 109,206 157,172 318,898 160,580<br />
Net interest income before provisions 150,847 102,074 108,693 163,405 127,164<br />
Provisions for possible loan losses – 1,331 – 255 1,299 – 1,172 – 1,947<br />
Net interest income after provisions 149,516 101,819 109,992 162,233 125,217<br />
Commission income 292,434 281,227 248,539 314,475 185,595<br />
Commission expenses 109,849 108,455 99,782 137,441 32,871<br />
Net commission income 182,585 172,772 148,757 177,034 152,724<br />
Result from hedge accounting 49 – 22 0 – 133 56<br />
Trading result – 1,128 0 836 540 – 519<br />
Result from financial investments – 5,989 9,919 20,850 – 19,294 – 9,624<br />
Administrative expenses 232,074 210,028 198,918 242,774 187,437<br />
– Personnel expenses 67,465 62,563 62,341 58,795 39,677<br />
– Other administrative expenses 147,877 133,404 124,201 171,836 137,626<br />
Marketing expenses 57,208 53,021 41,441 80,210 74,268<br />
Communication expenses 6,450 4,353 7,022 8,810 5,277<br />
Consulting expenses 10,832 7,334 11,702 14,019 12,754<br />
Expenses for external services 36,467 30,258 25,435 30,347 22,629<br />
Sundry administrative expenses 36,920 38,438 38,601 38,450 22,698<br />
– Depreciation of office furniture and<br />
equipment and intangible assets 16,732 14,061 12,376 12,143 10,134<br />
Other operating result 15,117 6,414 3,421 5,148 10,063<br />
Operating result 108,076 80,874 84,938 82,754 90,480<br />
Restructuring expenses 0 0 8,945 0 0<br />
Pre-tax profit/<br />
Profit from ordinary activities 108,076 80,874 75,993 82,754 90,480<br />
Taxes on income – 3,687 21,240 19,369 21,916 32,783<br />
Net profit 111,763 59,634 56,624 60,838 57,697<br />
Statement of comprehensive income of <strong>comdirect</strong> group according to IAS/IFRS – year-to-year comparison<br />
€ thousand 1.1. to 1.1. to 1.1. to 1.1. to 1.1. to<br />
31.12.2011 31.12.2010 31.12.2009 31.12.2008 31.12.2007<br />
Net profit 111,763 59,634 56,624 60,838 57,697<br />
Change in the revaluation reserve before tax – 26,090 – 28,583 83,280 – 2,504 – 4,482<br />
Taxes 6,690 7,708 – 21,659 – 363 249<br />
Change in the revaluation reserve after tax – 19,400 – 20,875 61,621 – 2,867 – 4,233<br />
Comprehensive income 92,363 38,759 118,245 57,971 53,464<br />
The figures for financial year 2008 were adjusted to account for the contruibutions from ebase GmbH. Financial<br />
year 2007 is presented as reported in the annual report 2007 of the <strong>comdirect</strong> group.
160<br />
|<br />
62 Income statement of <strong>comdirect</strong> group according to IAS/IFRS on a quarterly comparison<br />
2011<br />
€ thousand Q1 Q2 Q3 Q4<br />
Interest income 59,777 64,858 70,912 73,543<br />
Interest expenses 26,515 27,234 31,560 32,934<br />
Net interest income before provisions 33,262 37,624 39,352 40,609<br />
Provisions for possible loan losses – 148 – 419 – 474 – 290<br />
Net interest income after provisions 33,114 37,205 38,878 40,319<br />
Commission income 79,649 68,449 77,369 66,967<br />
Commission expenses 29,505 28,141 27,107 25,096<br />
Net commission income 50,144 40,308 50,262 41,871<br />
Result from hedge accounting – 60 – 231 297 43<br />
Trading result – 255 222 – 1,088 – 7<br />
Result from financial investments – 1,201 147 – 1,364 – 3,571<br />
Administrative expenses 58,724 52,322 59,092 61,936<br />
– Personnel expenses 15,792 17,005 18,176 16,492<br />
– Other administrative expenses 39,437 31,788 36,781 39,871<br />
Marketing expenses 14,599 11,294 13,793 17,522<br />
Communication expenses 2,493 – 25 1,938 2,044<br />
Consulting expenses 1,989 2,638 2,355 3,850<br />
Expenses for external services 9,837 9,300 10,127 7,203<br />
Sundry administrative expenses 10,519 8,581 8,568 9,252<br />
– Depreciation of office furniture and<br />
equipment and intangible assets 3,495 3,529 4,135 5,573<br />
Other operating result 1,840 236 303 12,738<br />
Pre-tax profit 24,858 25,565 28,196 29,457<br />
Taxes on income 6,623 6,709 7,738 – 24,757<br />
Net profit 18,235 18,856 20,458 54,214<br />
Statement of comprehensive income of <strong>comdirect</strong> group according to IAS/IFRS on a quarterly comparison<br />
2011<br />
€ thousand Q1 Q2 Q3 Q4<br />
Net profit 18,235 18,856 20,458 54,214<br />
Change in the revaluation reserve before tax – 31,353 11,295 – 7,632 1,600<br />
Taxes 8,084 – 2,951 1,559 – 2<br />
Change in the revaluation reserve after tax – 23,269 8,344 – 6,073 1,598<br />
Comprehensive income – 5,034 27,200 14,385 55,812
| FOREWORD | THE BOARD OF MAN<strong>AG</strong>ING DIRECTORS | CORPORATE GOVERNANCE | GROUP MAN<strong>AG</strong>EMENT REPORT | CONSOLIDATED FINANCIAL STATEMENTS | 161<br />
2010<br />
€ thousand Q1 Q2 Q3 Q4<br />
Interest income 49,193 51,084 53,962 57,041<br />
Interest expenses 25,220 28,457 27,744 27,785<br />
Net interest income before provisions 23,973 22,627 26,218 29,256<br />
Provisions for possible loan losses – 79 – 178 – 392 394<br />
Net interest income after provisions 23,894 22,449 25,826 29,650<br />
Commission income 65,674 71,591 66,243 77,719<br />
Commission expenses 26,883 26,298 26,116 29,158<br />
Net commission income 38,791 45,293 40,127 48,561<br />
Result from hedge accounting 0 –4 – 10 – 8<br />
Trading result 0 0 0 0<br />
Result from financial investments 6,136 1,991 2,552 – 760<br />
Administrative expenses 48,625 50,584 48,025 62,794<br />
– Personnel expenses 15,385 15,295 15,029 16,854<br />
– Other administrative expenses 29,924 31,663 29,511 42,306<br />
Marketing expenses 10,914 12,507 10,632 18,968<br />
Communication expenses 359 1,538 1,000 1,456<br />
Consulting expenses 1,727 1,404 1,653 2,550<br />
Expenses for external services 6,876 7,662 7,717 8,003<br />
Sundry administrative expenses 10,048 8,552 8,509 11,329<br />
– Depreciation of office furniture and<br />
equipment and intangible assets 3,316 3,626 3,485 3,634<br />
Other operating result 986 1,381 796 3,251<br />
Pre-tax profit 21,182 20,526 21,266 17,900<br />
Taxes on income 5,500 5,399 5,895 4,446<br />
Net profit 15,682 15,127 15,371 13,454<br />
Statement of comprehensive income of <strong>comdirect</strong> group according to IAS/IFRS on a quarterly comparison<br />
2010<br />
€ thousand Q1 Q2 Q3 Q4<br />
Net profit 15,682 15,127 15,371 13,454<br />
Change in the revaluation reserve before tax 19,722 – 32,882 13,165 – 28,588<br />
Taxes – 4,977 8,446 – 3,311 7,550<br />
Change in the revaluation reserve after tax 14,745 – 24,436 9,854 – 21,038<br />
Comprehensive income 30,427 – 9,309 25,225 – 7,584
162<br />
|<br />
63 Segment reporting by business line<br />
1.1. to 31.12.2011<br />
€ thousand B2C B2B <strong>comdirect</strong><br />
group<br />
total<br />
Interest income 266,974 2,116 269,090<br />
Interest expenses 117,015 1,228 118,243<br />
Net interest income before provisions 149,959 888 150,847<br />
Provisions for possible loan losses – 1,331 0 – 1,331<br />
Net interest income after provisions 148,628 888 149,516<br />
Commission income 157,113 135,321 292,434<br />
Commission expenses 15,699 94,150 109,849<br />
Net commission income 141,414 41,171 182,585<br />
Result from hedge accounting 49 0 49<br />
Trading result – 1,128 0 – 1,128<br />
Result from financial investments – 5,758 – 231 – 5,989<br />
Administrative expenses 197,305 34,769 232,074<br />
Other operating result 13,593 1,524 15,117<br />
Pre-tax profit 99,493 8,583 108,076<br />
Segment investments 12,153 4,317 16,470<br />
Segment depreciation 13,603 3,129 16,732<br />
Cost/income ratio 66.2% 80.2% 68.0%<br />
Segment income 445,966 139,931<br />
– of which external income 445,966 139,931<br />
– of which inter-segmental income 0 0<br />
Segment expenses 346,473 131,348<br />
Segment assets 10,967,426<br />
Segment debt 10,704,895<br />
The management manages the <strong>comdirect</strong> group via two business lines: Business to Customer (B2C) and Business<br />
to Business (B2B). The B2C business line is comprised of <strong>comdirect</strong> <strong>bank</strong> <strong>AG</strong> and its five separate assets; ebase<br />
GmbH is comprised of the B2B business line.<br />
The segmentation carried out reflects the internal perspective of the <strong>comdirect</strong> group and corresponds to the<br />
management approach. The respective customer groups in particular constitute the main delimitation feature of<br />
the business segments.<br />
The figures for the B2B business segment were derived from the internal reporting of ebase GmbH and correspond<br />
to the contributions of ebase GmbH included in the income statement of the <strong>comdirect</strong> group.<br />
In the <strong>comdirect</strong> group, net interest income is essentially generated by reinvesting customer deposits in the<br />
money and capital markets, whereby Commerz<strong>bank</strong> is a major business partner (see <strong>information</strong> on related<br />
party disclosures, note (26)). The interest income from money and capital market transactions in the amount of<br />
€172.4m exceeds 10% of the total income for the segments. This was earned almost exclusively in the B2C business<br />
line.
| FOREWORD | THE BOARD OF MAN<strong>AG</strong>ING DIRECTORS | CORPORATE GOVERNANCE | GROUP MAN<strong>AG</strong>EMENT REPORT | CONSOLIDATED FINANCIAL STATEMENTS | 163<br />
1.1. to 31.12.2010<br />
€ thousand B2C B2B <strong>comdirect</strong><br />
group<br />
total<br />
Interest income 210,595 685 211,280<br />
Interest expenses 108,263 943 109,206<br />
Net interest income before provisions 102,332 – 258 102,074<br />
Provisions for possible loan losses – 255 0 – 255<br />
Net interest income after provisions 102,077 – 258 101,819<br />
Commission income 145,061 136,166 281,227<br />
Commission expenses 14,437 94,018 108,455<br />
Net commission income 130,624 42,148 172,772<br />
Result from hedge accounting – 22 0 – 22<br />
Trading result 0 0 0<br />
Result from financial investments 9,857 62 9,919<br />
Administrative expenses 175,933 34,095 210,028<br />
Other operating result 6,021 393 6,414<br />
Pre-tax profit 72,624 8,250 80,874<br />
Segment investments 8,147 4,302 12,449<br />
Segment depreciation 11,107 2,954 14,061<br />
Cost/income ratio 70.7% 80.5% 72.1%<br />
Segment income 376,396 140,248<br />
– of which external income 376,359 140,223<br />
– of which inter-segmental income 37 25<br />
Segment expenses 303,772 131,998<br />
Segment assets 10,728,669<br />
Segment debt 10,206,847<br />
Net commission income in the B2C segment results predominantly from custody account business with private<br />
customers. In addition, commission is generated from payment services and other commission, e.g. from advisory<br />
services. In the B2C business segment impairments on financial investments amounting to €1,005 thousand<br />
were necessary (2010: €345 thousand).<br />
Material non-cash income resulted from accrued interest. Non-cash income totalled €107.2m (2010: €82.1m).<br />
Non-cash expenses mainly stemmed from depreciations, allocations to provisions, recognition of other liabilities<br />
and accrued interest in customer business. Non-cash expenses totalled €69.6m (2010: €60.3m).<br />
In the B2B business line, net commission income is generated from securities services for institutional and private<br />
customers. Other sources of income, such as deposit business, are not material. Impairments on financial assets<br />
of €178 thousand were taken into account (2010: €69 thousand).
164<br />
|<br />
Material non-cash income resulted from deferred commission. Non-cash income totalled €33.6m (2010: €33.8m).<br />
Non-cash expenses mainly stemmed from allocations to provisions. Non-cash expenses totalled €21.7m (2010:<br />
€31.7m).<br />
There were no material service agreements between the business segments shown during the reporting period.<br />
We therefore waive to display a consolidation column.<br />
The segment income and expenses reported relates to IFRS values and therefore correspond to the values stated<br />
in the consolidated income statement.<br />
The Treasury volume and credit volume are deemed to be segment assets of the B2C business line. No assets are<br />
shown for the B2B business line as these do not form part of internal reporting for management purposes.<br />
The Treasury volume of the B2C segment comprises the ECB credit balance, money market transactions, promissory<br />
notes and the securities portfolio of <strong>comdirect</strong> <strong>bank</strong> <strong>AG</strong>. Unlike the accounting treatment, for the purposes of<br />
internal reporting promissory notes are measured at fair value. Like customer deposits, the Treasury volume increased<br />
in the reporting period. The credit volume in the B2C business line comprises lending to customers, particularly<br />
on loans against securities.<br />
B2C segment assets in the amount of €10,967m (2010: €10,729m) differs from the consolidated balance sheet<br />
total according to IFRS in the amount of €11,378m (2010: €11,040m) particularly due to the valuation effects on<br />
claims in the amount of €35m (2010: €– 8m), accrued interest and fees in the amount of €87m (2010: €64m) and<br />
the contribution of balance sheet items not allocated to the B2C segment assets and consolidation in the amount<br />
of €289m (2010: €255m).<br />
The customer deposits managed by <strong>comdirect</strong> <strong>bank</strong> <strong>AG</strong> are stated as segment liabilities of the B2C business line.<br />
Segment debt in the amount of €10,705m (2010: €10,206m) differs from the liabilities to customers reported in<br />
the consolidated balance sheet according to IFRS in the amount of €10,723m (2010: €10,368m) due to valuation<br />
effects in the amount of €– 133m (2010: €2m) and the contributions of ebase GmbH and consolidation effects in<br />
the total amount of €151m (2010: €160m).
| FOREWORD | THE BOARD OF MAN<strong>AG</strong>ING DIRECTORS | CORPORATE GOVERNANCE | GROUP MAN<strong>AG</strong>EMENT REPORT | CONSOLIDATED FINANCIAL STATEMENTS | 165<br />
64 Other liabilities<br />
€ thousand 31.12.2011 31.12.2010 31.12.2011 31.12.2010 31.12.2011 31.12.2010<br />
Up to<br />
one year<br />
Up to<br />
one year<br />
More than<br />
one year<br />
More than<br />
one year<br />
More than<br />
five years<br />
More than<br />
five years<br />
up to five<br />
years<br />
up to five<br />
years<br />
Rental payments 3,888 3,476 11,440 13,198 4,392 4,771<br />
Lease payments 382 444 337 273 0 0<br />
Total 4,270 3,920 11,777 13,471 4,392 4,771<br />
The above table contains minimum lease payments under non-cancellable operating leases.<br />
65 Fees for auditors<br />
€ thousand 31.12.2011 31.12.2010 Change<br />
in %<br />
Annual audits 336 330 + 1.8<br />
Other certification services 147 175 – 16.0<br />
Tax advisory services 250 263 – 4.9<br />
Other services 7 17 – 58.8<br />
Total 740 785 – 5.7<br />
The expenses shown in the table for services provided by PricewaterhouseCoopers <strong>AG</strong> Wirtschaftsprüfungsgesellschaft<br />
are stated net of VAT.<br />
66 Corporate Governance Code<br />
<strong>comdirect</strong> <strong>bank</strong> <strong>AG</strong> has submitted the Declaration of Compliance with the German Corporate Governance Code<br />
pursuant to Section 161 of the German Stock Corporation Act (AktG) and has made it permanently available to<br />
shareholders on its website www.<strong>comdirect</strong>.de.
166<br />
|<br />
67 The company’s Boards<br />
Supervisory Board<br />
Martin Zielke<br />
Chairman<br />
Member of the Board of Managing Directors of<br />
Commerz<strong>bank</strong> <strong>AG</strong>,<br />
Frankfurt/Main<br />
Frank Annuscheit<br />
Deputy Chairman<br />
Member of the Board of Managing Directors of<br />
Commerz<strong>bank</strong> <strong>AG</strong>,<br />
Frankfurt/Main<br />
Board of Managing Directors<br />
Dr. Thorsten Reitmeyer<br />
CEO<br />
Dr. Christian Diekmann<br />
Member of the Board of Managing Directors<br />
Carsten Strauß<br />
Member of the Board of Managing Directors<br />
Thorben Gruschka<br />
Staff member IT Support department of <strong>comdirect</strong> <strong>bank</strong> <strong>AG</strong>,<br />
Quickborn<br />
Karin Katerbau<br />
Member of the Board of Managing Directors of BRE Bank SA,<br />
Warsaw, Poland<br />
(from 11 October 2011)<br />
Angelika Kierstein<br />
Works Council Chairwoman of <strong>comdirect</strong> <strong>bank</strong> <strong>AG</strong>,<br />
Department Support Finance, Controlling & Risk Management<br />
of <strong>comdirect</strong> <strong>bank</strong> <strong>AG</strong>,<br />
Quickborn<br />
Georg Rönnberg<br />
Certified accountant and tax consultant,<br />
Neu-Anspach<br />
Dr. Achim Kassow<br />
Member of the Board of Managing Directors of<br />
Commerz<strong>bank</strong> <strong>AG</strong>,<br />
Frankfurt/Main<br />
(until 30 June 2011)
| FOREWORD | THE BOARD OF MAN<strong>AG</strong>ING DIRECTORS | CORPORATE GOVERNANCE | GROUP MAN<strong>AG</strong>EMENT REPORT | CONSOLIDATED FINANCIAL STATEMENTS | 167<br />
68 Seats on supervisory boards and other executive bodies<br />
Members of the Supervisory Board of <strong>comdirect</strong> <strong>bank</strong> <strong>AG</strong><br />
Martin Zielke<br />
Seats on statutory supervisory boards<br />
• Allianz Global Investors Deutschland GmbH, Munich<br />
(from 21 March 2011)<br />
• Commerz Real <strong>AG</strong>, Eschborn<br />
(from 1 January 2011)<br />
• Commerz Real Investmentgesellschaft mbH, Wiesbaden<br />
(from 1 January 2011)<br />
Seats on comparable supervisory bodies<br />
• BRE Bank SA, Warsaw<br />
(until 31 March 2011)<br />
• Commerz<strong>bank</strong> Auslands<strong>bank</strong>en Holding Nova GmbH,<br />
Frankfurt/Main,<br />
Deputy Chairman<br />
(until 16 May 2011)<br />
• Public Joint Stock Company “Bank Forum”, Kiev<br />
(until 26 April 2011)<br />
Karin Katerbau<br />
Seats on comparable supervisory bodies<br />
• BRE Bank Hipoteczny S.A., Warsaw<br />
• BRE Leasing Sp. z.o.o., Warsaw<br />
Deputy Chairwoman<br />
• European Bank for Fund Services GmbH (ebase), Aschheim<br />
(until 31 December 2011)<br />
Members of the Board of Managing Directors of<br />
<strong>comdirect</strong> <strong>bank</strong> <strong>AG</strong><br />
Dr. Thorsten Reitmeyer<br />
Seats on statutory supervisory boards<br />
• Commerz Direktservice GmbH, Duisburg<br />
(from 25 March 2011)<br />
Seats on comparable supervisory bodies<br />
• European Bank for Fund Services GmbH (ebase),<br />
Aschheim<br />
Dr. Christian Diekmann<br />
Seats on comparable supervisory bodies<br />
• European Bank for Fund Services GmbH (ebase),<br />
Aschheim<br />
Chairman<br />
Carsten Strauß<br />
Seats on statutory supervisory boards<br />
• Commerz Direktservice GmbH, Duisburg<br />
Seats on comparable supervisory bodies<br />
• European Bank for Fund Services GmbH (ebase),<br />
Aschheim<br />
Dr. Achim Kassow (until 30 June 2011)<br />
Seats on statutory supervisory boards<br />
• Commerz<strong>bank</strong> Auslands<strong>bank</strong>en Holding <strong>AG</strong>,<br />
Frankfurt/Main,<br />
Chairman<br />
(until 5 July 2011)<br />
Seats on comparable supervisory bodies<br />
• BRE Bank SA, Warsaw<br />
(until 12 July 2011)
168<br />
|<br />
69 Remuneration and loans to Board members<br />
Remuneration for the Board of Managing Directors<br />
The remuneration for the Board of Managing Directors of <strong>comdirect</strong> <strong>bank</strong> <strong>AG</strong> is set by the Supervisory Board. In<br />
addition to the non-performance related fixed compensation comprising the annual fixed salary and fringe benefits,<br />
the compensation also comprises a performance-related variable compensation component, which comprises<br />
a component due in the short term (short term incentive, STI) and a component with a long-term incentive<br />
effect (long term incentive, LTI). For Dr. Reitmeyer and Dr. Diekmann both the STI and LTI will each be awarded<br />
half in the form of a cash payout and half in a share-based payment. Mr Strauß, however, receives his STI component<br />
solely in the form of a cash payout and the LTI component is awarded solely in the form of a share-based<br />
payment.<br />
The variable compensation of the Board of Managing Directors therefore comprises the following components: STI<br />
cash payout, share-based STI, LTI cash payout and share-based LTI, whereby entitlement to a payout in respect of<br />
the LTI components is linked to suspensive conditions.<br />
All members of the Board of Managing Directors also receive a company pension for their activities at <strong>comdirect</strong><br />
<strong>bank</strong> <strong>AG</strong>.<br />
Details of the compensation system for the Board of Managing Directors are provided in the Compensation<br />
Report (page 22).<br />
In accordance with commercial law regulations, the overall remuneration for financial year 2011 includes the following<br />
compensation components: fixed remuneration, fringe benefits, STI cash payout, share-based STI and<br />
share-based LTI. In accordance with commercial law regulations, the portion of the 2011 LTI component to be<br />
settled as a cash payout is not reported until the suspensive conditions have been fulfilled and is shown as part<br />
of the overall compensation in 2014 in the amount to be determined at that time. The individual components<br />
below relate to the subheadings under IAS 24.16.<br />
Taking into account commercial law regulations, compensation for the Board of Managing Directors totalling<br />
€1,533 thousand (2010: €1,590 thousand) was reported for financial year 2011. The figures for the previous year<br />
also include contributions from members of the Board of Managing Directors who left the company in financial<br />
year 2010.<br />
Short-term benefits<br />
€ thousand Non-variable Value of fringe<br />
STI<br />
components benefits cash payout 1)<br />
2011 2010 2011 2010 2011 2010<br />
Dr. Thorsten Reitmeyer<br />
(as of 1 December 2010) 360 30 141 3 77 32<br />
Dr. Christian Diekmann 230 170 16 6 47 156<br />
Carsten Strauß 230 145 6 5 103 174<br />
Total 820 345 163 14 227 362<br />
1) The variable compensation due in the short term shown in the table includes the STI component to be awarded solely as a cash payout for 2011. Consequently,<br />
a comparison with the previous year is not possible due to the change in the compensation system for all active members of the Board of Managing Directors.<br />
In financial year 2011, expenses were recorded in the income statement for the variable components in the shortterm<br />
for Dr. Reitmeyer €101 thousand (2010: €34 thousand), Dr. Diekmann €62 thousand (2010: €164 thousand)<br />
and Mr Strauß €124 thousand (2010: €183 thousand).
| FOREWORD | THE BOARD OF MAN<strong>AG</strong>ING DIRECTORS | CORPORATE GOVERNANCE | GROUP MAN<strong>AG</strong>EMENT REPORT | CONSOLIDATED FINANCIAL STATEMENTS | 169<br />
Share-based payment<br />
Share-based components of variable compensation (compensation model from 2011)<br />
In each case, one STI and LTI component for Dr. Reitmeyer and Dr. Diekmann is settled in shares in Commerz<strong>bank</strong><br />
<strong>AG</strong> as the ultimate parent company of <strong>comdirect</strong> <strong>bank</strong> <strong>AG</strong>. These are consequently to be viewed as share-based<br />
payment in accordance with IFRS 2. With regard to the LTI component, the expense is posted over a vesting<br />
period of four years. The full amount for the STI component is recognised as an expense in financial year 2011.<br />
Mr Strauß receives a long term share-based compensation component in the form of virtual, non-tradable shares<br />
in Commerz<strong>bank</strong> <strong>AG</strong> (Commerz<strong>bank</strong> share awards). These comprise the conditional right to a cash payout after a<br />
three-year waiting period depending on the performance of Commerz<strong>bank</strong> shares. Consequently, the share<br />
awards are also to be viewed as share-based payment transactions in accordance with IFRS 2. The compensation<br />
volumen calculated for financial year 2011 was recognised in full as personnel expenses and a provison recorded.<br />
The compensation components shown in the table below are subject to suspensive conditions. The figures indicated<br />
represent the total amount of the volume specified for these compensation components and are determined<br />
on an indicative basis. They are deemed to constitute part of the overall remuneration for 2011, even<br />
though they can be reduced or cancelled depending on the performance evaluation at the end of the waiting<br />
period or as a result of infringements of the objectives of the <strong>bank</strong>.<br />
€ thousand Share-based STI<br />
2011<br />
Share-based LTI<br />
2011<br />
Dr. Thorsten Reitmeyer 77 115 1)<br />
Dr. Christian Diekmann 47 31 1)<br />
Carsten Strauß – 53 2)<br />
Total 124 199<br />
1) The table shows the indicative figures calculated in the performance evaluation for financial year 2011 in respect of the performance-related variable compensation<br />
with long-term incentive effects (LTI component) for Dr. Reitmeyer and Dr. Diekmann. No entitlement is acquired in this regard until financial year 2014 at the<br />
earliest after the three-year waiting period ends. The amount can be reduced or cancelled depending on the results of a renewed performance evaluation at the<br />
end of the waiting period and will be settled in shares in financial year 2015 at the earliest. The value also fluctuates in line with the performance of Commerz<strong>bank</strong><br />
shares until the time of issue. Nevertheless, in accordance with DRS 17, the share-based LTI component already has to be reported as part of the overall remuneration<br />
in 2011.<br />
2) The table shows the portion of the variable compensation for financial year 2011 granted to Mr Strauß in the form of Commerz<strong>bank</strong> share awards. The value<br />
fluctuates in line with the performance of Commerz<strong>bank</strong> shares during the three-year waiting period and is due for payment in financial year 2015. Furthermore,<br />
the amount can be reduced or cancelled if during the waiting period individual breaches of regulations and risk limits or individual misconduct in the sense of an<br />
infringement of the operating or strategic objectives or regulations of the <strong>bank</strong> are ascertained.<br />
In the financial year, expenses arising from these share-based compensation components were recognised in the<br />
income statement in the amount of €135 thousand for Dr. Reitmeyer, €71 thousand for Dr. Diekmann and €19<br />
thousand for Mr Strauß.
170<br />
|<br />
Performance shares (compensation model until 2010)<br />
In previous years, a compensation component was granted in the form of virtual, non-tradeable shares in <strong>comdirect</strong><br />
<strong>bank</strong> <strong>AG</strong> (performance shares). These comprise the conditional right to a cash payout after a three-year<br />
waiting period. The performance shares were last issued in financial year 2010. The table below shows the outstanding<br />
tranches for active members of the Board of Managing Directors.<br />
Valule per<br />
share in €<br />
Dr.<br />
Christian<br />
Diekmann<br />
Carsten<br />
Strauß<br />
Total<br />
Allocated performance shares<br />
– Tranche 2009 in units 8,436 7,179 15,615<br />
– Tranche 2010 in units 7,077 6,022 13,099<br />
Total 15,513 13,201 28,714<br />
Value when granted<br />
– Tranche 2009 5.05 in € thousand 43 36 79<br />
– Tranche 2010 6.02 in € thousand 43 36 79<br />
Total 86 72 158<br />
Value as of the reporting date<br />
– Tranche 2009 10.50 in € thousand 89 75 164<br />
– Tranche 2010 6.61 in € thousand 47 40 87<br />
Total 136 115 251<br />
The realisable compensation from participation in the LTIP may vary considerably from the figures in the table<br />
above and in particular may not apply at all as the final amounts for disbursement are not determined until the<br />
end of the term (blocking period) of the respective tranches.<br />
In the reporting period, payments were made on performance shares relating to the tranche granted under the<br />
programme in financial year 2008. Dr. Diekmann received €157 thousand and Mr Strauß €123 thousand. With<br />
regard to Dr. Diekmann, this payment related to performance shares granted to him for his activities prior to<br />
taking on his position on the Board of Managing Directors.<br />
In the reporting year, €55 thousand (2010: €22 thousand) was recognised as an expense in the income statement<br />
for the performance shares granted to Dr. Diekmann and €107 thousand (2010: €63 thousand) for Mr Strauß.<br />
Other long term benefits (compensation model from 2011 onwards)<br />
The portion of the LTI component to be settled as a cash payout is subject to suspensive conditions. The figures<br />
shown in the table represent the total amounts of the volume specified for this compensation component and are<br />
determined on an indicative basis. They are not considered to be part of the overall remuneration for 2011 but, if<br />
all suspensive conditions are met, as part of the total remuneration for 2014 in the amounts to be determined at<br />
that time.<br />
€ thousand LTI cash payout<br />
2011 1)<br />
Dr. Thorsten Reitmeyer 115<br />
Dr. Christian Diekmann 31<br />
Total 146<br />
1) The table shows the indicative figures calculated in the performance evaluation for financial year 2011 in respect of the performance-related variable compensation<br />
with long term incentive effects (LTI component) for Dr. Reitmeyer and Dr. Diekmann. No entitlement is acquired in this regard until financial year 2014 at the<br />
earliest, after the three-year waiting period ends. The amount can be reduced or cancelled depending on the results of a renewed performance evaluation at the<br />
end of the waiting period and falls due for payment in financial year 2015 at the earliest.
| FOREWORD | THE BOARD OF MAN<strong>AG</strong>ING DIRECTORS | CORPORATE GOVERNANCE | GROUP MAN<strong>AG</strong>EMENT REPORT | CONSOLIDATED FINANCIAL STATEMENTS | 171<br />
The amounts are recognised as an expense on a pro rata basis over a total period of four years. In the reporting<br />
year, expenses in the amount of €37 thousand were incurred for Dr. Reitmeyer and €10 thousand for<br />
Dr. Diekmann in respect of the LTI component with cash payout.<br />
Post-employment benefits<br />
The members of the Board of Managing Directors receive a pension commitment for their activities at <strong>comdirect</strong><br />
<strong>bank</strong> <strong>AG</strong>. Accordingly, members of the Board of Managing Directors who were active as of the balance sheet date,<br />
are eligible for a claim to a capital payment. The company has formed pension provisions under IFRS for these<br />
future claims, the amount of which depends on the length of service, pensionable salary and current actuarial<br />
interest rate. The valuation is based on actuarial assessments, using the projected unit credit method, which are<br />
conducted by an independent actuary.<br />
The pension under IFRS obligations towards active members of the Board of Managing Directors who were active<br />
during the financial year developed as follows:<br />
€ thousand Dr. Thorsten<br />
Reitmeyer<br />
Dr. Christian<br />
Diekmann<br />
Carsten<br />
Strauß<br />
2011 2010 2011 2010 2011 2010<br />
Pension obligation under IFRS (DBO) as of 1.1. 87 0 20 7 30 17<br />
Change in financial year 34 87 12 13 44 13<br />
– of which transfer due to move<br />
within the Commerz<strong>bank</strong> Group 0 85 0 0 0 0<br />
– of which service cost recognised in income statement 23 2 13 12 11 10<br />
Pension obligation under IFRS (DBO) as of 31.12. 121 87 32 20 74 30<br />
Regulations governing termination of employment<br />
If <strong>comdirect</strong> <strong>bank</strong> prematurely terminates the appointment to the Board of a member of the Board of Managing<br />
Directors, the respective contract of employment is in principle continued until the end of the original term of<br />
office. Dr. Reitmeyer and Mr Strauß receive a maximum amount of up to two years’ annual compensation,<br />
whereby the calculation is based on the compensation in the last full financial year prior to termination. There is<br />
no entitlement to further remuneration where termination takes place for good cause. This same arrangement<br />
applies to Dr. Diekmann for the term of office commencing on 1 May 2012. The contract for the term of office up<br />
to that date provides for continued payment of compensation in the amount of 50% of the fixed compensation<br />
for a maximum of 24 months in the event of Dr. Diekmann's appointment being terminated prematurely.<br />
In the financial year, no payments were made to members of the Board of Managing Directors as a result of<br />
premature termination of the appointment to the Board, nor was there any need to recognise corresponding<br />
provisions.<br />
Other <strong>information</strong> on active members of the Board of Managing Directors<br />
In the past financial year, no member of the Board of Managing Directors has received payments, considerations<br />
or corresponding commitments from a third party in relation to their activities as a member of the Board of<br />
Managing Directors.<br />
Members of the Board of Managing Directors performing board functions at subsidiaries or affiliated companies<br />
during the financial year only received reimbursement of expenses.<br />
Information relating to former members of the Board of Managing Directors<br />
The <strong>bank</strong> provides old-age provision for former members of the Board of Managing Directors or their surviving<br />
dependents. As of the balance sheet date, pension obligations under IFRS (defined benefit obligations) for former<br />
members of the Board of Managing Directors amounted to €3,367 thousand (2010: €3,405 thousand).
172<br />
|<br />
In financial year 2011, a total of €404 thousand (2010: €347 thousand) was paid to former members of the Board<br />
of Managing Directors of <strong>comdirect</strong> <strong>bank</strong> <strong>AG</strong>. In the financial year, a cash payout was made to former members of<br />
the Board of Managing Directors amounting to €202 thousand (2010: €149 thousand) in relation to the performance<br />
shares. 2012 will be the last year in which there may be payments to former members of the Board of<br />
Managing Directors under the remaining tranches relating to the performance shares.<br />
Remuneration for the Supervisory Board<br />
The compensation of the Supervisory Board members is stipulated in the Articles of Association. In addition to a<br />
fixed compensation, the compensation scheme includes a separate component for committee activities and a<br />
variable component, which depends on the amount of the dividend to be distributed.<br />
Provided that the financial statements of <strong>comdirect</strong> <strong>bank</strong> <strong>AG</strong> are adopted in their present form and that the annual<br />
general meeting approves the proposed appropriation of profit, the remuneration of members of the Supervisory<br />
Board will total €152 thousand (2010: €278 thousand). This comprises any applicable VAT and the remuneration<br />
breakdown by the members of the Supervisory Board is as follows:<br />
€ thousand Non-variable Variable Remuneration for Total<br />
components components committee activities<br />
2011 2010 2011 2010 2011 2010 2011 2010<br />
Martin Zielke 0 18 0 24 0 12 0 54<br />
Frank Annuscheit 0 10 0 13 0 0 0 23<br />
Torben Gruschka 12 12 23 16 0 0 35 28<br />
Karin Katerbau (from 11 October 2011) 3 0 5 0 0 0 8 0<br />
Angelika Kierstein 12 12 23 16 3 3 38 31<br />
Georg Rönnberg 12 8 23 10 3 2 38 20<br />
Dr. Achim Kassow (until 30 June 2011) 9 34 16 45 7 25 32 104<br />
Klaus Müller-Gebel (until 7 May 2010) 0 6 0 0 0 3 0 18<br />
Mr Zielke and Mr Annuscheit have waived their compensation as members of the Supervisory Board for financial<br />
year 2011.<br />
Neither advance payments nor loans were extended. <strong>comdirect</strong> <strong>bank</strong> <strong>AG</strong> did not take on any contingent liabilities.
| FOREWORD | THE BOARD OF MAN<strong>AG</strong>ING DIRECTORS | CORPORATE GOVERNANCE | GROUP MAN<strong>AG</strong>EMENT REPORT | CONSOLIDATED FINANCIAL STATEMENTS | 173<br />
70 Holdings<br />
Affiliated companies included in the consolidated financial statements:<br />
Name Domicile Share of capital<br />
held in %<br />
Equity<br />
in € thousand<br />
European Bank for Fund Services GmbH (ebase) Aschheim/Germany 100.0 29,031<br />
SPEs (special funds) included in the consolidated financial statements as per IAS 27/SIC-12<br />
Name Domicile Share of capital Funds volume<br />
held in % in € thousand<br />
CDBS-Cofonds Frankfurt/Main, Germany 100.0 100,929<br />
CDBS-Cofonds II Frankfurt/Main, Germany 100.0 92,446<br />
CDBS-Cofonds III Frankfurt/Main, Germany 100.0 98,648<br />
CDBS-Cofonds IV Frankfurt/Main, Germany 100.0 99,835<br />
OP-Fonds CDBS V Cologne/Germany 100.0 91,402<br />
Other affiliated companies not included in the consolidated financial statements:<br />
Name Domicile Share of capital<br />
Equity<br />
held in % in € thousand<br />
WST-Broker GmbH i.L. Frankfurt/Main/Germany 54.0 92