Download - Integration and Application Network
Download - Integration and Application Network
Download - Integration and Application Network

Create successful ePaper yourself
Turn your PDF publications into a flip-book with our unique Google optimized e-Paper software.
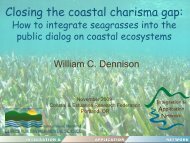
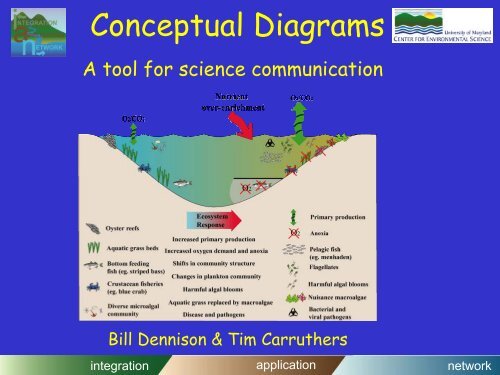
Conceptual Diagrams<br />
A tool for science communication<br />
Bill Dennison & Tim Carruthers<br />
integration application network
Conceptual diagrams<br />
• Conceptual diagrams have proven useful for<br />
science integration <strong>and</strong> applications<br />
• Technological advances have made it possible to<br />
‘click & drag’ using symbol libraries (you don’t need<br />
to be an artist)<br />
• An easy to use system that can ‘grow’ (updated<br />
with additional symbols <strong>and</strong> bases) will encourage<br />
more scientists to use conceptual diagrams <strong>and</strong><br />
communicate more effectively<br />
"Make everything as simple as possible, but not<br />
simpler." A. Einstein<br />
integration application network
What is a conceptual diagram?<br />
• “Concept” from Latin conceptus (meaning thought);<br />
something conceived in the mind<br />
• “Diagram” from Greek diagramma (meaning to mark out<br />
by lines);<br />
• a graphic design that explains rather than represents, a<br />
drawing that shows arrangement <strong>and</strong> relations<br />
• THOUGHT DRAWING<br />
• Conceptual diagram = A diagram using symbols that<br />
depicts the essential attributes of a system<br />
integration application network
Conceptual diagrams provide an interface<br />
Science<br />
Conceptual<br />
Diagram<br />
Community<br />
Current<br />
underst<strong>and</strong>ing<br />
Priorities &<br />
environmental<br />
values<br />
Credibility &<br />
support<br />
Shared vision<br />
Commitment &<br />
resources<br />
integration application network
Good conceptual diagrams are used extensively<br />
Z scheme of photosynthesis<br />
Plate tectonics<br />
integration application network
Darwin used conceptual diagrams to<br />
explain his theory of coral reef<br />
formation<br />
integration application network
Conceptual diagrams use symbols: an ancient<br />
technique to depict unequivocal messages<br />
Darwin’s conceptual diagram<br />
Cave drawing (Australian<br />
aborigines)<br />
integration application network
Symbols (icons) are a key element of conceptual diagrams<br />
• Symbol: from Greek symbolon (token of identity) <strong>and</strong> Latin symbolum (token, sign)<br />
• Symbol: A sign that signifies by virtue of sharing a property with what it represents<br />
–a. something that st<strong>and</strong>s for or suggests something else<br />
–b. a visible thing that st<strong>and</strong>s for something invisible or intangible<br />
• Symbols used in mathematics (e.g., p), chemistry (e.g., 210 Pb), music<br />
(e.g., ) weather (e.g., ), religion (e.g., ), corporations<br />
(e.g., ), <strong>and</strong> organizations (e.g., )<br />
• Symbols can be universal; language independent<br />
• Symbols are scalable; size of symbol can represent relative importance--<br />
vs.<br />
• Symbols can be information-rich; size, shape, color <strong>and</strong> position of symbols can convey<br />
information<br />
integration application network
Both shape <strong>and</strong> color of symbols<br />
can be important for recognition<br />
integration application network
Symbols are an important feature of<br />
everyday life<br />
Shape, color <strong>and</strong> images used for traffic signs<br />
integration application network
In conceptual diagrams, as in maps,<br />
symbols need to be explained in a legend<br />
Map legend:<br />
Conceptual diagram legend:<br />
integration application network
Conceptual diagrams can capture the<br />
increasing underst<strong>and</strong>ing of a system…<br />
1995 1998<br />
2001<br />
integration application network
Conceptual diagrams can depict<br />
processes at different scales…<br />
kilometers<br />
meters<br />
centimeters<br />
integration application network
Conceptual diagrams can be nested<br />
integration application network
Conceptual diagrams are not…<br />
…cartoons<br />
…model relationships<br />
… colored box & arrow diagrams<br />
… a replacement for good, wellinterpreted<br />
data<br />
integration application network
Conceptual diagrams can augment<br />
the effective communication of<br />
scientific underst<strong>and</strong>ing<br />
Conceptual diagram<br />
that uses 2 pp. of<br />
text for explanation<br />
Conceptual diagram with<br />
‘st<strong>and</strong>-alone’ legend<br />
integration application network
Literature citations can be added…<br />
integration application network
Why use conceptual diagrams?<br />
Seagrass loss in Moreton Bay<br />
• Helps to clarify<br />
thinking<br />
(words can be ambiguous, an<br />
image commits to the message<br />
being portrayed)<br />
• Communication<br />
(one way <strong>and</strong> two way –idea<br />
presentation <strong>and</strong> idea<br />
development)<br />
• Identify gaps /<br />
priorities / essential<br />
elements<br />
• Develop syntheses (or<br />
present synthesis)<br />
integration application network
Use of conceptual models facilitates<br />
hybrid diagrams of data<br />
Journal<br />
articles<br />
Books<br />
integration application network
Symbols can be used on maps <strong>and</strong> linked<br />
to species identification guides<br />
Distribution<br />
map<br />
Identification<br />
guide<br />
integration application network
Who develops/uses conceptual<br />
diagrams?<br />
Scientists<br />
Teachers<br />
Resource Managers<br />
integration application network
Various applications of conceptual<br />
diagrams<br />
Research<br />
Synthesis<br />
Monitoring<br />
Management<br />
integration application network
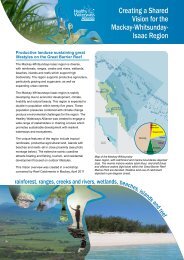
Conceptual diagrams can be incorporated<br />
into various publications<br />
Books<br />
Newsletters<br />
Journal<br />
publications<br />
Posters<br />
integration application network
Conceptual diagrams can be used in<br />
powerpoint presentations<br />
Overall summary<br />
Component diagrams (nested)<br />
Problem statement<br />
Problem resolution<br />
(Burford et al.)<br />
integration application network
Conceptual diagrams can be produced in<br />
real time to synthesize main messages<br />
Result of one day meeting into seagrass loss in Western Port<br />
integration application network
The Ten Comm<strong>and</strong>ments of<br />
conceptual diagrams…<br />
1. Thou shalt honor thy audience<br />
2. Thou shalt simplify<br />
3. Thou shalt not use garish colors or apply colors inconsistently<br />
4. Thou shalt not produce a diagram without a complete legend<br />
5. Thou shalt not covet a single style<br />
6. Thou shalt not be constrained by geometry<br />
7. Thou shalt not use arrows indiscriminately<br />
8. Thou shalt not be afraid of making new symbols<br />
9. Thou shalt not publish diagrams without significant editing<br />
10. Thou shalt not confine use of diagrams to scientific peers<br />
integration application network
Drawing Programs<br />
Program Web Site Price<br />
Adobe Illustrator<br />
(PC, MAC)<br />
Corel Draw<br />
(PC)<br />
Macromedia Freeh<strong>and</strong><br />
(PC,MAC)<br />
Deneba Canvas<br />
(PC, MAC)<br />
www.adobe.com * $ 45<br />
www.corel.com * $165<br />
www.macromedia.com ** $ 99<br />
www.deneba.com ** $199<br />
* ~ USM Site License<br />
** ~ Educational Price (not though USM site license)<br />
integration application network
Copyright issues<br />
http://www.copyright.gov http://www.benedict.com/homepage.htm<br />
/<br />
• © Dennison 2000 <strong>and</strong> /or add logo; but this does NOT<br />
connote any real proprietary value<br />
• Right click to grab image from web site—public<br />
supported web sites do not need permission, but<br />
permission <strong>and</strong>/or acknowledgement is<br />
recommended<br />
• Ideas not copyrightable “Copyright does not protect<br />
ideas, concepts, systems, or methods of doing<br />
something.”<br />
• Universal symbols, lists <strong>and</strong> tables from public<br />
documents are not copyrighted<br />
integration application network
Resolution issues<br />
Print/Publication<br />
300 Dots per inch (DPI)<br />
CYMK palette<br />
cyan, yellow,magenta, black<br />
Drawing files, bitmap images-<br />
May be large files (size)<br />
Monitor/Web<br />
72 DPI (also called PPI-Pixels<br />
per inch)<br />
RGB palette<br />
Red, green, blue<br />
Compressed images, small files<br />
(size)<br />
Pixel = Picture Element<br />
Text scanned in as line art at 600 DPI<br />
Paste Special when inserting image > smaller image size<br />
72 dpi 150 dpi 250 dpi<br />
integration application network
Transferring images to Powerpoint..<br />
• From the ‘edit menu’:<br />
choose ‘paste special’<br />
• For diagrams <strong>and</strong> figures use<br />
Enhanced Metafile, GIF or<br />
PNG<br />
• For photos use JPEG<br />
• This can reduce a 70Mb<br />
powerpoint file to 2Mb !!<br />
integration application network
File Types<br />
— determined by the way they<br />
represent graphic information<br />
vector<br />
raster<br />
File Name Type Primary Use<br />
*.ai Adobe Illustrator vector art work<br />
*.cdr Corel Draw vector art work<br />
*.bmp Windows bitmap format raster photographs, art work<br />
*.tif Tagged-Image Format raster, vector scanned images<br />
*.eps Encapsulated Postscript vector, raster art work<br />
*.jpg<br />
(jpeg)<br />
Joint Photographic Experts<br />
Group<br />
compressed<br />
raster<br />
photographs (web)<br />
*.gif<br />
Graphics Interchange<br />
Format<br />
compressed<br />
raster<br />
art work (web)<br />
integration application network
Creating conceptual diagrams<br />
• Define overall message (e.g., what story or stories<br />
to tell)<br />
• Identify audience (e.g., scientific peers, general<br />
audience)<br />
• List key structural & functional aspects<br />
– major processes (e.g., biogeochemical pathways,<br />
food web)<br />
– biota/habitats (e.g., forest types, wetl<strong>and</strong>s)<br />
• Experiment with ways to depict system (2D vs. 3D;<br />
mirror images; nested)<br />
• Start drawing (white boards are useful)<br />
integration application network
Layering simplifies the diagram<br />
Layer 1 (background panels)<br />
Layer 2 (Icons <strong>and</strong> Keys)<br />
Layer 3 (window dressing)<br />
Priority is assigned within layers<br />
: a ‘sent to back’ icon will be in front<br />
of the ‘sent to front’ background panel<br />
integration application network
The ‘layers’ window<br />
Creates new layers<br />
integration application network
The ‘layers’ window<br />
The currently active layer is highlighted,<br />
anything drawn or imported will be in this layer<br />
integration application network
The ‘layers’ window<br />
This locks entire layers (for eg base of model) –<br />
to work on other layers (eg icons)<br />
integration application network
The ‘layers’ window<br />
Layers are indicated by different highlight colors<br />
integration application network
Bases can be 2 or 3 dimensional<br />
• Forming Bases – Filled <strong>and</strong> Clear arrow tools<br />
• Line <strong>and</strong> Fill colors – the color/stroke/gradient menus<br />
• Textures – the swatch menu<br />
Bases<br />
integration application network
Click <strong>and</strong> drag bases…<br />
Import the<br />
‘bases palette’<br />
integration application network
Click <strong>and</strong> drag bases…<br />
integration application network
Click <strong>and</strong> drag bases…<br />
To edit base,<br />
right click &<br />
‘break link<br />
to symbol<br />
integration application network
Replicating a base fill/style<br />
Open the Style library<br />
‘Environmental..<br />
Physical Styles’<br />
Then highlight the object<br />
to receive a fill style<br />
integration application network
Replicating a base fill/style<br />
Changes fill, in this<br />
case to ‘mud’<br />
integration application network
Gradient palette<br />
Custom gradients<br />
can be found in<br />
the swatch palette<br />
integration application network
Gradient palette<br />
Useful to indicate<br />
gradual changes<br />
in water quality etc<br />
integration application network
Gradient palette<br />
Adjust mid point<br />
of gradient<br />
Create new<br />
color points<br />
integration application network
Drawing palette<br />
Pen tools (selection tools)<br />
Left click <strong>and</strong> hold on pen tool gives four options..<br />
integration application network
Pen tools (selection tools)<br />
integration application network
Pen tools (selection tools)<br />
integration application network
Pen tools (selection tools)<br />
integration application network
Pen tools (selection tools)<br />
integration application network
Pen tools (selection tools)<br />
integration application network
Outlines <strong>and</strong> Fills<br />
Fill<br />
Outline<br />
Line is defined as black <strong>and</strong> a stroke weight of 1 pt<br />
Fill is transparent (turned off)<br />
integration application network
Outlines <strong>and</strong> Fills<br />
Line is transparent (turned off)<br />
Fill is defined as light blue<br />
integration application network
Libraries<br />
Window:<br />
symbol libraries<br />
choose required<br />
library<br />
integration application network
Libraries<br />
3<br />
1<br />
2<br />
1. Create new layer<br />
2. Choose symbol<br />
3. Insert into model<br />
integration application network
Creating new symbols<br />
Find a photograph of<br />
object <strong>and</strong> import into<br />
Illustrator<br />
Lock the image<br />
integration application network
Creating new symbols<br />
Choose the st<strong>and</strong>ard<br />
pen tool<br />
Set line thickness <strong>and</strong><br />
choose an easily visible<br />
color<br />
Start tracing areas of<br />
uniform color<br />
integration application network
Creating new symbols<br />
Use the curve pen<br />
tool to smooth lines<br />
integration application network
Creating new symbols<br />
Adjust color <strong>and</strong> fill<br />
integration application network
Grouping <strong>and</strong> transforming<br />
Having created a<br />
symbol group the<br />
elements<br />
integration application network
Grouping <strong>and</strong> transforming<br />
Symbols or elements can<br />
be rotated, scaled <strong>and</strong><br />
reflected<br />
integration application network
Grouping <strong>and</strong> transforming<br />
integration application network
A range of currently available<br />
symbols<br />
integration application network
www.ian.umces.edu/conceptualdiagrams.htm<br />
Please visit our website to download the symbol libraries for<br />
Illustrator for FREE<br />
Be sure to click the “Register for FREE Instant Access” link<br />
integration application network
Acknowledgements…<br />
Eva Abal<br />
Catherine Collier<br />
Karen Holloway<br />
Diana Kleine<br />
Kate Moore<br />
Judy O’Neil<br />
Francis Pantus<br />
Dieter Tracey<br />
integration application network
Future possibilities:<br />
• Develop Stella-like functionality with conceptual diagram ‘frontend’<br />
(quantitative representations, scenario runs)?<br />
integration application network