Creating conceptual models in Adobe Illustrator (10)
Creating conceptual models in Adobe Illustrator (10)
Creating conceptual models in Adobe Illustrator (10)
- No tags were found...

Create successful ePaper yourself
Turn your PDF publications into a flip-book with our unique Google optimized e-Paper software.
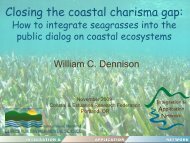
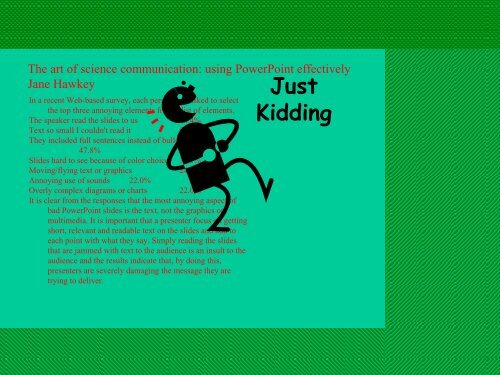
<strong>in</strong>tegrationapplicationnetworkThe art of science communication: us<strong>in</strong>g PowerPo<strong>in</strong>t effectivelyJane HawkeyIn a recent Web-based survey, each person was asked to selectthe top three annoy<strong>in</strong>g elements from a list of elements.The speaker read the slides to us 60.4%Text so small I couldn't read it 50.9%They <strong>in</strong>cluded full sentences <strong>in</strong>stead of bullet po<strong>in</strong>ts47.8%Slides hard to see because of color choice 37.1%Mov<strong>in</strong>g/fly<strong>in</strong>g text or graphics 24.5%Annoy<strong>in</strong>g use of sounds 22.0%Overly complex diagrams or charts 22.0%It is clear from the responses that the most annoy<strong>in</strong>g aspect ofbad PowerPo<strong>in</strong>t slides is the text, not the graphics ormultimedia. It is important that a presenter focus on gett<strong>in</strong>gshort, relevant and readable text on the slides and add toeach po<strong>in</strong>t with what they say. Simply read<strong>in</strong>g the slidesthat are jammed with text to the audience is an <strong>in</strong>sult to theaudience and the results <strong>in</strong>dicate that, by do<strong>in</strong>g this,presenters are severely damag<strong>in</strong>g the message they aretry<strong>in</strong>g to deliver.JustKidd<strong>in</strong>g
<strong>in</strong>tegrationapplicationnetworkThe art of science communication:us<strong>in</strong>g PowerPo<strong>in</strong>t effectivelyJane HawkeyIAN Science Communication CourseHorn Po<strong>in</strong>t Laboratory3-7 April 2006www.ian.umces.edu
<strong>in</strong>tegrationOutl<strong>in</strong>eapplicationnetwork• Present<strong>in</strong>g your talk– Communicat<strong>in</strong>g your messageeffectively• Us<strong>in</strong>g PowerPo<strong>in</strong>t effectively– H<strong>in</strong>ts and tips to maximize PowerPo<strong>in</strong>t'susefulness• Components of a good PowerPo<strong>in</strong>tpresentation
Present<strong>in</strong>g your talk• Number of slides = number of m<strong>in</strong>utes– Leave time for questions• Preparation is the key– Slides are your cues• Arrive early to check equipment and greet audience• Provide appropriate background– Assume naïveté, not ignorance• Show data with<strong>in</strong> five m<strong>in</strong>utes• Orient the audience to each slide– Expla<strong>in</strong> graph axes, photos, diagrams• Every slide should have visual elements• "Tell 'em what you're go<strong>in</strong>g to tell them, tell 'em,then tell them what you told 'em" – George Bernard Shaw<strong>in</strong>tegrationapplicationnetwork
<strong>in</strong>tegrationapplicationnetworkYou are giv<strong>in</strong>g a talk,NOT read<strong>in</strong>g a speech• Text can be used to:– Rem<strong>in</strong>d speakers of the key po<strong>in</strong>ts of the talk– Provide the audience with enough <strong>in</strong>formation to <strong>in</strong>terpretgraphics• Text should NOT be used to:– Distract audience from the speaker’s words (people will reada new slide before listen<strong>in</strong>g to the speaker)– Replace the need for the speaker to talk by hav<strong>in</strong>g a completetext provided on the slides
Font size and visibility is important• 36 pt for titles• 20 pt for bullet po<strong>in</strong>ts (at least)• 12 pt for citations• 8 pt never!• Use color judiciously, especially red and green• Contrast between your background, and text/graphics isimportant• Use system fonts, or embed fonts <strong>in</strong> your presentation• Sans serif fonts: Arial, Verdana, Comic Sans• Serif fonts: Times New Roman, Garamond, Palat<strong>in</strong>oThis is a serif font.Which of these fonts iseasier to read?This is a sans serif font.Which of these fonts iseasier to read?• Sans serif fonts are more readable from a distance<strong>in</strong>tegrationapplicationnetwork
<strong>in</strong>tegrationapplicationnetworkSome color comb<strong>in</strong>ationsare hard to read• Some people f<strong>in</strong>d red and green hard todist<strong>in</strong>guish• Dark backgrounds are harder on the eyes
<strong>in</strong>tegrationapplicationnetworkConsistency is importantJane Hawkey
<strong>in</strong>tegrationapplicationnetworkConsistency is important
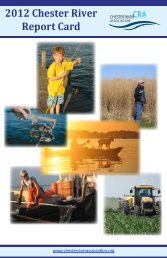
Graph formatt<strong>in</strong>g makes all the differenceBad (or no) formatt<strong>in</strong>gGood formatt<strong>in</strong>g403020<strong>10</strong>0-0.5 0 0.5 1 1.5 2• Boxes, gridl<strong>in</strong>es and white backgroundare distract<strong>in</strong>g• Axes not labelled, y-axis obscur<strong>in</strong>g data• Bor<strong>in</strong>g black and white• Transparent background,no boxes or gridl<strong>in</strong>es• Large labelled axes• Contrast<strong>in</strong>g colors<strong>in</strong>tegrationapplicationnetwork
<strong>in</strong>tegrationapplicationnetworkGraph formatt<strong>in</strong>g makes all the differenceBad (or no) formatt<strong>in</strong>gGood formatt<strong>in</strong>g• Boxes, gridl<strong>in</strong>es and white backgrounddistract<strong>in</strong>g• Axes not clearly labelled, too many tickmarks on y axis• Excel default colors• Transparent background,no boxes or gridl<strong>in</strong>es• Large labelled axes• Contrast<strong>in</strong>g colors
Get them right <strong>in</strong> Excel first<strong>in</strong>tegrationapplicationnetwork• Use colored background box tofacilitate color match<strong>in</strong>g• Remove graph background• Remove grid l<strong>in</strong>es, borders &unnecessary legends (i.e. if onlyone data series)• Clean up extra tick marks and<strong>in</strong>crease <strong>in</strong>tervals betweenmarks• Label axis with title and units• Select text and right click toformat (subscript, etc)• Delete colored background• Copy from Excel• Switch to PowerPo<strong>in</strong>t• Paste Special– Picture (Enhanced Metafile)
<strong>in</strong>tegrationapplicationnetworkTry to avoid tables …RegionEHIRegion area(km 2 )% arearegion DO Secchi Chl a TP TNδ 15 NUpper PatuxentMiddle PatuxentLower PatuxentMouth PatuxentPatuxent Overall0.2<strong>10</strong>.520.480.580.482161533016513373218<strong>10</strong>00.660.9<strong>10</strong>.991.000.920.000.000.000.000.000.340.260.370.380.330.000.280.180.930.330.090.870.470.530.580.150.800.850.620.70Upper ChoptankMiddle ChoptankLower ChoptankMouth ChoptankChoptank Overall0.200.260.440.490.401688160<strong>10</strong>93734244329<strong>10</strong>00.260.951.001.000.960.000.000.000.000.000.240.040.240.620.300.000.060.590.530.420.000.060.390.380.300.7<strong>10</strong>.420.400.420.43Cape Charles City 0.75 N/A N/A nd 0.75 0.75 0.63 1.00 0.63
<strong>in</strong>tegrationapplicationnetwork… or format them rightRegionEHIRegionarea(km 2 )% arearegion DO Secchi Chl a TP TNUpper Patuxent 0.21 21 13 0.66 0.00 0.34 0.00 0.09 0.15Middle Patuxent 0.52 61 37 0.91 0.00 0.26 0.28 0.87 0.80Lower Patuxent 0.48 53 32 0.99 0.00 0.37 0.18 0.47 0.85Mouth Patuxent 0.58 30 18 1.00 0.00 0.38 0.93 0.53 0.62Patuxent Overall 0.48 165 <strong>10</strong>0 0.92 0.00 0.33 0.33 0.58 0.70δ 15 NUpper ChoptankMiddle ChoptankLower ChoptankMouth ChoptankChoptank Overall0.200.260.440.490.401688160<strong>10</strong>93734244329<strong>10</strong>00.260.951.001.000.960.000.000.000.000.000.240.040.240.620.300.000.060.590.530.420.000.060.390.380.300.7<strong>10</strong>.420.400.420.43Cape Charles City 0.75 N/A N/A nd 0.75 0.75 0.63 1.00 0.63• Use PowerPo<strong>in</strong>t's Insert → Table function
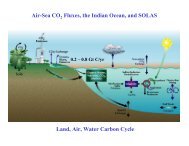
<strong>in</strong>tegrationapplicationnetworkNitrogen cycl<strong>in</strong>gFertilizerProductionAtmosphericEffectsNO xEnergyProductionNO xNH 3 NHFeed Animal3Feed AnimalAtmospheric DepositionNH 3 NO -3OzoneFormationNO -3Human FoodConsumptionN 2 to atm.DenitrificationNO -3ForestEffectsGroundwaterEffectsNO -3NO -3Human Health/Plant DamageDr<strong>in</strong>k<strong>in</strong>gwater qualityN 2 ONO -3NO -3Surface WaterEffectsNO -3GreenhouseEffectCoastalEffectsNO -3Adapted from Galloway and Cowl<strong>in</strong>g, 2002.• Avoid box and arrow diagrams– Use a <strong>conceptual</strong> diagram <strong>in</strong>stead
Format maps to <strong>in</strong>clude more <strong>in</strong>formation<strong>in</strong>tegrationapplicationnetwork
<strong>in</strong>tegrationapplicationnetworkIsabel surge height21.8Water height (m above MLLW)1.61.41.2<strong>10</strong>.80.60.40.20Cambridge• PowerPo<strong>in</strong>t is all about the visual – there is no excuse for yourgraphics to not be seen
<strong>in</strong>tegrationapplicationnetworkIsabel surge heightDefault ExcelYou + ExcelYou + <strong>Illustrator</strong>(export as atransparent.PNG file)
<strong>in</strong>tegrationapplicationnetworkVideo clips can be effective
Cropp<strong>in</strong>g and annotation of photos <strong>in</strong>PowerPo<strong>in</strong>t can be very <strong>in</strong>formativePhotos that are well chosen, cropped, aligned, distributed evenly andannotated provide <strong>in</strong>formation on methods, study site, description & relevanceAutomaticclean<strong>in</strong>g unitLight loggerUse the crop tool , resize with the mouse, and then use the automatic alignand distribute tool <strong>in</strong> PowerPo<strong>in</strong>t to keep your slides clear and legible<strong>in</strong>tegrationapplicationnetwork
Crop, align and label photos carefullyAccuratecropp<strong>in</strong>gXXvsXPhotos that are well chosen, cropped, aligned,distributed evenly and annotated provide <strong>in</strong>formationon methods, study site, description & relevanceLyngbya<strong>in</strong>duceddermatitisClear label<strong>in</strong>g of photosLyngbya <strong>in</strong>duceddermatitisLyngbya<strong>in</strong>duceddermatitisPay attention to alignment & overlapp<strong>in</strong>g<strong>in</strong>tegrationXapplicationLyngbya <strong>in</strong>duceddermatitisUse the crop tool , resize with the mouse, andthen use PowerPo<strong>in</strong>t's align or distribute tool tokeep your slides clear and legiblenetwork
Use PowerPo<strong>in</strong>t's Align or Distribute function<strong>in</strong>tegrationapplicationnetwork
Use PowerPo<strong>in</strong>t's Align or Distribute function<strong>in</strong>tegrationapplicationnetwork
Map sequence can show temporal changes• Improvements or degradation over time can be highlighted by aseries of maps• Consistent layout allows comparisons• Maps should have scale and compass direction• Maps should have a legend that is self conta<strong>in</strong>ed & legible<strong>in</strong>tegrationapplicationnetwork
<strong>in</strong>tegrationapplicationnetworkComb<strong>in</strong>e visual elementsPatuxent River is responsive to <strong>in</strong>creased flow(nutrient load<strong>in</strong>g) with phytoplankton bloomsSummerBenedict, MD photo Dave Miller May 2001
Proper use of color is very powerfulSite selectionCommunity composition & morphologyUNGRAZEDGRAZEDSimulatedtrailsNaturalgraz<strong>in</strong>gGrazerexclusionNaturalgraz<strong>in</strong>g trailsgrazerbarrierSimulatedgraz<strong>in</strong>g trailsungrazedWanga Wallen Banks‘cultivation graz<strong>in</strong>g’Amity BanksGrazerexclusionN fixation (mg N m -2 d -1 )9060300Nitrogen fixationNatural graz<strong>in</strong>g trailsNitrogen fixation per m 2Ungrazed GrazedSiteAerobicN fixation (mg N m -2 d -1 )2.521.5<strong>10</strong>.50AnaerobicNitrogen fixation perplant biomassUngrazed GrazedSiteN fixation (mg N m -2 d -1 )3530252015<strong>10</strong>50Nitrogen fixationSimulated graz<strong>in</strong>g trailsNitrogen fixation per m 2Ungrazed GrazedSiteAerobicN fixation (mg N m -2 d -1 )0.90.80.70.60.50.40.30.20.<strong>10</strong>AnaerobicNitrogen fixation perplant biomassUngrazed GrazedSiteN fixation (mg N m -2 d -1 )Nitrogen fixationGrazer exclusionNitrogen fixation per m 2 Nitrogen fixation perplant biomass18 316142.5122<strong>10</strong>81.561420.500Ungrazed GrazedUngrazed GrazedSiteSiteAerobic AnaerobicN fixation (mg N m -2 d -1 )• Set up color pattern early on and tra<strong>in</strong> the audience<strong>in</strong>tegrationapplicationnetwork
<strong>in</strong>tegrationapplicationnetworkOveruse of PowerPo<strong>in</strong>t effectscan be distract<strong>in</strong>gFocus should be on the content,not on the presentation
Effective use of animation to showsteps <strong>in</strong> methodologySlow release fertilizer(88 g N m -2 : 22 g P m -2 )Incubate for<strong>10</strong> daysD<strong>in</strong>oflagellates areclassified, countedand recordedD<strong>in</strong>oflagellates arewashed from thesurface of the host20μm size fraction collected<strong>in</strong>tegrationapplicationnetwork
<strong>in</strong>tegrationapplicationnetworkA map sequence us<strong>in</strong>g the ‘animation’function can be effectiveBribie Is.BongareeToorbul Pt.Pebble BeachSandstone Pt.Godw<strong>in</strong> Beach
<strong>in</strong>tegrationapplicationnetworkA map sequence us<strong>in</strong>g the ‘animation’function can be effectiveBribie Is.20 Jan 2000~0.8 km 2Toorbul Pt.BongareePebble BeachSandstone Pt.Godw<strong>in</strong> Beach
<strong>in</strong>tegrationapplicationnetworkA map sequence us<strong>in</strong>g the ‘animation’function can be effectiveBribie Is.1 Feb 2000~2 km 2Toorbul Pt.BongareePebble BeachSandstone Pt.Godw<strong>in</strong> Beach
<strong>in</strong>tegrationapplicationnetworkA map sequence us<strong>in</strong>g the ‘animation’function can be effectiveBribie Is.13 Feb 2000~4.5 km 2Toorbul Pt.BongareePebble BeachSandstone Pt.Godw<strong>in</strong> Beach
<strong>in</strong>tegrationapplicationnetworkA map sequence us<strong>in</strong>g the ‘animation’function can be effectiveBribie Is.24 Feb 20008 km 2Toorbul Pt.BongareePebble BeachSandstone Pt.Godw<strong>in</strong> BeachBloom Expansion Rate = ~<strong>10</strong>0 m 2 m<strong>in</strong> -1( Jan 1st - Feb 24th)
<strong>in</strong>tegrationapplicationnetworkSeparate pages for animation oftenbetter than ‘build’ animation• Builds can get difficult tomanage and edit• BUT separate pages may<strong>in</strong>crease PowerPo<strong>in</strong>t file size
<strong>in</strong>tegrationapplicationnetworkReduce your file size by compress<strong>in</strong>g your photos• Photos at high resolution can dramatically <strong>in</strong>crease the file size• Reduce resolution first• Use PowerPo<strong>in</strong>t's built-<strong>in</strong> compression function• Use NXPowerlite – www.nxpowerlite.com
<strong>in</strong>tegrationapplicationnetworkPowerPo<strong>in</strong>t presentations can bepoorly organizedTitle asks aquestion, butdoesn't answer itGreat photos, butno captions orexplanationPhotos not resizedor aligned properlyBackground andsidebar distract<strong>in</strong>g
<strong>in</strong>tegrationapplicationnetworkPowerPo<strong>in</strong>t presentations can bewell organizedTitle's question answeredwith judicious bulletpo<strong>in</strong>tsSubhead<strong>in</strong>gs expla<strong>in</strong>relevance of photosPhotos resized andaligned properly
PowerPo<strong>in</strong>t presentations can bepoorly organizedBor<strong>in</strong>g title givesno clue to slidecontentsBad font and colorchoicePoorly formattedgraphText box with poorleft alignment; badfont and color<strong>in</strong>tegrationapplicationnetwork
PowerPo<strong>in</strong>t presentations can bewell organizedActive title sets thesceneGood color and fontchoiceData is wellformatted and legible<strong>in</strong>tegrationapplicationText box alignedproperly; good colorand font choicenetwork
<strong>in</strong>tegrationapplicationnetworkTopical humor can be effectiveAcknowledgementsThanks to all thepeople <strong>in</strong> the MoretonBay catchment thatcontributed theirnutrients to this study.
<strong>in</strong>tegrationapplicationnetworkDesign<strong>in</strong>g a good scientificPowerPo<strong>in</strong>t presentation• Title slide – title, authors, affiliations• Outl<strong>in</strong>e of talk – expla<strong>in</strong> organization & previewconclusions• Body of talk – format consistency, on-go<strong>in</strong>gsummaries (e.g. ‘active’ titles)• Conclusions – take-home messages, stimulatequestions• Acknowledgements – specify roles• Extra slides for questions
<strong>in</strong>tegrationapplicationnetworkThe title conta<strong>in</strong>s the mostimportant words of ascientific presentationAuthor’s nameAuthor’s affiliation can be represented with a logoMultiple authors common: each can be noted with affiliations
Outl<strong>in</strong>e slides: An outl<strong>in</strong>e can be a guideto the talk and can provide conclusions<strong>in</strong>tegrationapplicationnetworkLANDSAT ETM 21/3/2003GEOIMAGESem<strong>in</strong>ar outl<strong>in</strong>e• Introduc<strong>in</strong>g…Caulerpa taxifolia• Honours research– Current distribution <strong>in</strong> Moreton Bay– Distribution change 1998-2003– Experimental manipulations• Summary and implicationsOutl<strong>in</strong>e• Report cards = importantmanagement tool• 2003 pilot study of Patuxent andChoptank Rivers• Ecosystem health <strong>in</strong>dex approachcan be used• Additional <strong>in</strong>dicators need to beconsidered• Effective monitor<strong>in</strong>g programs canbe developed (e.g. Moreton Bay)RegionUpper PatuxentMiddle PatuxentLower PatuxentMouth PatuxentPatuxent OverallEHI0.2<strong>10</strong>.520.480.580.48Out l i ne• Global overview•MoretonBay/Chesapeake Baycomparison• Moreton Bay issues•Chesapeake Bay issues• Integration & Application Network<strong>in</strong>tegration application network<strong>in</strong>tegration application networkOutl<strong>in</strong>e• Land-sea <strong>in</strong>terfaces are regions of stronggradients and major human impacts• We have entered the ‘anthropocene’• Now is the time for a global scientific focuson environmental problem solv<strong>in</strong>g• Case studies of coastal managementdemonstrate solutions are possible• Key lessons and recommendations<strong>in</strong>tegration application networkOutl<strong>in</strong>e• Seagrass evolution• Life history traits• Balanc<strong>in</strong>g limitation and excess• Tropical vs. temperate<strong>in</strong>tegration application networkOutl<strong>in</strong>e• Thalassia as an <strong>in</strong>dicator forthe Caribbean• Use of δ 15 N• Nutrient sources to a dryCaribbean Lagoon, Yucatan,Mexico• Nutrient sources to a wet CaribbeanLagoon, Bocas del Toro, Panama• Comparison and conclusions
Methods slides: Visual elements candescribe the experimental approach<strong>in</strong>tegrationapplicationnetwork15 cm seagrasscoreZostera capricorni and light:Laboratory experimentsSimulated sediment productionShakeBulk Soil Add water SettleCollectClaysolutionCentrifugedOven driedMethods – C. taxifolia distribution• Repeated benthic surveys from 1998throughout Moreton Bay• Snorkelled transects estimated benthiccover and species compositionplastic-l<strong>in</strong>edl<strong>in</strong>edpotflow<strong>in</strong>g seawater tanksLight <strong>in</strong>tensities: <strong>10</strong>0%, 50%, 30%, 20%, 15%Duration: 63 dParameters: Growth, biomass, pigments,tissue nutrient content, δ 13 C+P +P +P +P +P +P +Predkandosolyellowkandosolredredoxickurasol chromosol hydrosol podosolSeven simulated clay sedimentsYellowkurosolSimulatedsediments(clay
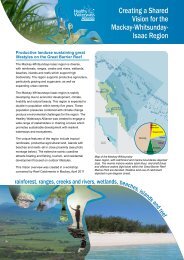
Results slides: Data-rich figures canprovide both detail and the big picture<strong>in</strong>tegrationapplication35%48%0%85%97%0%13%2%3%0%65%52%networkETR (μmol e - m -2 s -1 )Nutrients can <strong>in</strong>crease photosynthesisPad<strong>in</strong>aChlorodesmis5030402530201520<strong>10</strong><strong>10</strong>5000 500 <strong>10</strong>00 1500 2000 0 200 400 600 800 <strong>10</strong>00 1200 1400PAR (μmol quanta m -2 s -1 )PAR (μmol quanta m -2 s -1 )Unfertilised FertilisedUnfertilised FertilisedSediment Depth (mm)Vertical distribution <strong>in</strong> sedimentsOligotrophicAbundance (cells m -2 )0 50 <strong>10</strong>0 150 200 250 0 50 <strong>10</strong>0 150 200 2500<strong>10</strong>2030400<strong>10</strong>20304050Viruses x <strong>10</strong>9 50Viruses x <strong>10</strong>66606 60Bacteria x <strong>10</strong>Bacteria x <strong>10</strong>705<strong>10</strong> 70Cyanobacteria x <strong>10</strong>5Green Algae x805Diatoms x <strong>10</strong> 80Diatoms x <strong>10</strong>5905<strong>10</strong> 90D<strong>in</strong>oflagellates x <strong>10</strong>5Cyanobacteria x•Heterogeneity•Subsurface maxima - UV destruction at sediment surface•Microalgae - sediment surfaceDistribution of plant material alongthe turtle digestive tract4m5m6m7mSeagrassMangrove leavesMangrove propagulesPhytoplanktoncomposition• Diatoms predom<strong>in</strong>ate <strong>in</strong>Bay• Flagellates <strong>in</strong>hypereutrophic river site• More diversity <strong>in</strong>oligotrophic Bay sitesWater Column[Iron] (µM)12<strong>10</strong>86420Total water column iron3.27.94.73.42.3Sunda (1988)15-9-99 6-<strong>10</strong>-99 27-<strong>10</strong>-99 20-01-00 25-02-006.3• No <strong>in</strong>dication that Total Fe is responsiblefor stimulation of bloom1.6• Levels are comparable with those seen <strong>in</strong>other coastal systems0.51.4Jan 983.6273Increas<strong>in</strong>g seagrass area• Total water column [ Fe ] are comparableto levels seen <strong>in</strong> mullet ponds withreported Lyngbya blooms.<strong>in</strong>tegrationapplicationnetwork
Data summary slides: Conceptual diagramscan be used to synthesize dataPolar issues: Climate changeNutrient <strong>in</strong>puts to the west Yucatan Pen<strong>in</strong>sula<strong>in</strong>tegration application networkCoral reef responses to added nutrientsSome, but not all, coral reef organisms andprocesses affected by elevated nutrientsShrimp farm – Conceptual diagramZostera communityLocalized zone ofwastewater <strong>in</strong>fluenceDissolved NParticulate NElevated δ 15 NElevated [am<strong>in</strong>o acid]Elevated phytoplanktonbloom potentialLittle wastewater <strong>in</strong>fluenceLow particulate and dissolved NLow δ 15 NLow [am<strong>in</strong>o acid]Low phytoplankton bloom potential• Zostera mar<strong>in</strong>a<strong>in</strong>tegrationapplicationnetwork