Effect of Stator Winding Temperature on Modal Test Results IRMC ...
Effect of Stator Winding Temperature on Modal Test Results IRMC ...
Effect of Stator Winding Temperature on Modal Test Results IRMC ...

Create successful ePaper yourself
Turn your PDF publications into a flip-book with our unique Google optimized e-Paper software.
<strong>IRMC</strong> 2012<br />
<str<strong>on</strong>g>Effect</str<strong>on</strong>g> <str<strong>on</strong>g>of</str<strong>on</strong>g> <str<strong>on</strong>g>Stator</str<strong>on</strong>g> <str<strong>on</strong>g>Winding</str<strong>on</strong>g> <str<strong>on</strong>g>Temperature</str<strong>on</strong>g> <strong>on</strong> <strong>Modal</strong> <strong>Test</strong> <strong>Results</strong><br />
M. Sasic, B. Huang and J. Letal<br />
Iris Power – Qualitrol<br />
(Canada)<br />
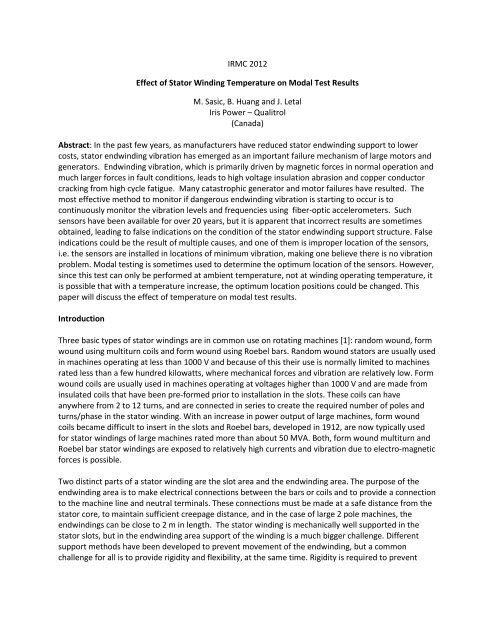
Abstract: In the past few years, as manufacturers have reduced stator endwinding support to lower<br />
costs, stator endwinding vibrati<strong>on</strong> has emerged as an important failure mechanism <str<strong>on</strong>g>of</str<strong>on</strong>g> large motors and<br />
generators. Endwinding vibrati<strong>on</strong>, which is primarily driven by magnetic forces in normal operati<strong>on</strong> and<br />
much larger forces in fault c<strong>on</strong>diti<strong>on</strong>s, leads to high voltage insulati<strong>on</strong> abrasi<strong>on</strong> and copper c<strong>on</strong>ductor<br />
cracking from high cycle fatigue. Many catastrophic generator and motor failures have resulted. The<br />
most effective method to m<strong>on</strong>itor if dangerous endwinding vibrati<strong>on</strong> is starting to occur is to<br />
c<strong>on</strong>tinuously m<strong>on</strong>itor the vibrati<strong>on</strong> levels and frequencies using fiber-optic accelerometers. Such<br />
sensors have been available for over 20 years, but it is apparent that incorrect results are sometimes<br />
obtained, leading to false indicati<strong>on</strong>s <strong>on</strong> the c<strong>on</strong>diti<strong>on</strong> <str<strong>on</strong>g>of</str<strong>on</strong>g> the stator endwinding support structure. False<br />
indicati<strong>on</strong>s could be the result <str<strong>on</strong>g>of</str<strong>on</strong>g> multiple causes, and <strong>on</strong>e <str<strong>on</strong>g>of</str<strong>on</strong>g> them is improper locati<strong>on</strong> <str<strong>on</strong>g>of</str<strong>on</strong>g> the sensors,<br />
i.e. the sensors are installed in locati<strong>on</strong>s <str<strong>on</strong>g>of</str<strong>on</strong>g> minimum vibrati<strong>on</strong>, making <strong>on</strong>e believe there is no vibrati<strong>on</strong><br />
problem. <strong>Modal</strong> testing is sometimes used to determine the optimum locati<strong>on</strong> <str<strong>on</strong>g>of</str<strong>on</strong>g> the sensors. However,<br />
since this test can <strong>on</strong>ly be performed at ambient temperature, not at winding operating temperature, it<br />
is possible that with a temperature increase, the optimum locati<strong>on</strong> positi<strong>on</strong>s could be changed. This<br />
paper will discuss the effect <str<strong>on</strong>g>of</str<strong>on</strong>g> temperature <strong>on</strong> modal test results.<br />
Introducti<strong>on</strong><br />
Three basic types <str<strong>on</strong>g>of</str<strong>on</strong>g> stator windings are in comm<strong>on</strong> use <strong>on</strong> rotating machines [1]: random wound, form<br />
wound using multiturn coils and form wound using Roebel bars. Random wound stators are usually used<br />
in machines operating at less than 1000 V and because <str<strong>on</strong>g>of</str<strong>on</strong>g> this their use is normally limited to machines<br />
rated less than a few hundred kilowatts, where mechanical forces and vibrati<strong>on</strong> are relatively low. Form<br />
wound coils are usually used in machines operating at voltages higher than 1000 V and are made from<br />
insulated coils that have been pre-formed prior to installati<strong>on</strong> in the slots. These coils can have<br />
anywhere from 2 to 12 turns, and are c<strong>on</strong>nected in series to create the required number <str<strong>on</strong>g>of</str<strong>on</strong>g> poles and<br />
turns/phase in the stator winding. With an increase in power output <str<strong>on</strong>g>of</str<strong>on</strong>g> large machines, form wound<br />
coils became difficult to insert in the slots and Roebel bars, developed in 1912, are now typically used<br />
for stator windings <str<strong>on</strong>g>of</str<strong>on</strong>g> large machines rated more than about 50 MVA. Both, form wound multiturn and<br />
Roebel bar stator windings are exposed to relatively high currents and vibrati<strong>on</strong> due to electro-magnetic<br />
forces is possible.<br />
Two distinct parts <str<strong>on</strong>g>of</str<strong>on</strong>g> a stator winding are the slot area and the endwinding area. The purpose <str<strong>on</strong>g>of</str<strong>on</strong>g> the<br />
endwinding area is to make electrical c<strong>on</strong>necti<strong>on</strong>s between the bars or coils and to provide a c<strong>on</strong>necti<strong>on</strong><br />
to the machine line and neutral terminals. These c<strong>on</strong>necti<strong>on</strong>s must be made at a safe distance from the<br />
stator core, to maintain sufficient creepage distance, and in the case <str<strong>on</strong>g>of</str<strong>on</strong>g> large 2 pole machines, the<br />
endwindings can be close to 2 m in length. The stator winding is mechanically well supported in the<br />
stator slots, but in the endwinding area support <str<strong>on</strong>g>of</str<strong>on</strong>g> the winding is a much bigger challenge. Different<br />
support methods have been developed to prevent movement <str<strong>on</strong>g>of</str<strong>on</strong>g> the endwinding, but a comm<strong>on</strong><br />
challenge for all is to provide rigidity and flexibility, at the same time. Rigidity is required to prevent
movement <str<strong>on</strong>g>of</str<strong>on</strong>g> the endwinding from normal operati<strong>on</strong> and fault c<strong>on</strong>diti<strong>on</strong> forces and flexibility is required<br />
to allow thermal expansi<strong>on</strong> in all directi<strong>on</strong>s <str<strong>on</strong>g>of</str<strong>on</strong>g> various parts <str<strong>on</strong>g>of</str<strong>on</strong>g> the endwinding due to thermal cycling.<br />
Endwinding Vibrati<strong>on</strong> in Rotating Machines<br />
Vibrati<strong>on</strong> is caused by forces that can be electrical or mechanical in origin. Generally, forces can be<br />
divided in steady state, load change and fault forces. Or, forces can be divided to forces acting <strong>on</strong> the<br />
stator core, individual stator bar/coil in the slot and in the endwinding, phase group <str<strong>on</strong>g>of</str<strong>on</strong>g> bars and<br />
complete endwinding. Based <strong>on</strong> frequency, endwindings can vibrate in two critical ranges, line<br />
frequency, usually produced by mechanical forces and twice line frequency, produced by<br />
electromagnetic forces from current carrying phase c<strong>on</strong>ductors.<br />
Mechanical vibrati<strong>on</strong> is the result <str<strong>on</strong>g>of</str<strong>on</strong>g> rotor rotati<strong>on</strong>: unbalanced or misaligned rotor, damaged bearings,<br />
and electrical problems <strong>on</strong> rotor such as shorted turns in generators and synchr<strong>on</strong>ous motors or broken<br />
bars in squirrel-cage inducti<strong>on</strong> motors [2].<br />
Electromagnetic forces between stator bars are created by current flowing through them.. In normal<br />
service these forces are relatively low and are c<strong>on</strong>tained by suitable end winding support structure.<br />
During large stress events, such as terminal short circuit or synchr<strong>on</strong>izati<strong>on</strong> errors, the current may rise<br />
to 10 times normal rated current and the resulting endwinding forces can be up to 100 times higher<br />
than the normal operating forces. In large turbo generators the forces in normal operati<strong>on</strong> can be as<br />
high as 100 lb/inch or 20,000 N/m <str<strong>on</strong>g>of</str<strong>on</strong>g> bar length, and may rise to more than 50 times those values in<br />
cases <str<strong>on</strong>g>of</str<strong>on</strong>g> severe system disturbances. Note that there are significant differences in forces between top<br />
and bottom bars are in the slot secti<strong>on</strong>, where the bars are at different levels <str<strong>on</strong>g>of</str<strong>on</strong>g> magnetic field. For EW<br />
the differential is not as large and also difficult to evaluate.<br />
Under normal operating c<strong>on</strong>diti<strong>on</strong>s, in most designs, vibrati<strong>on</strong> forces are c<strong>on</strong>trolled and kept at levels<br />
that are not harmful for stator winding. However, overstressing events and aging <str<strong>on</strong>g>of</str<strong>on</strong>g> the stator winding<br />
and its support systems can make it loose and cause a winding natural frequency to approach a forcing<br />
frequency (rotati<strong>on</strong>al speed or twice line frequency) and result in amplified deflecti<strong>on</strong> and relative<br />
moti<strong>on</strong> between comp<strong>on</strong>ents <str<strong>on</strong>g>of</str<strong>on</strong>g> the stator winding. This process can lead to mechanical and electrical<br />
failures.
Figure 1. Force pattern for 2 pole (left) and 4 pole (right) machines<br />
End-winding shape deformati<strong>on</strong> is caused by electromagnetic forces and modal shapes <str<strong>on</strong>g>of</str<strong>on</strong>g> such<br />
deformati<strong>on</strong>s may be different for 2 and 4 pole machines. Figure 1 indicates force patterns, <strong>on</strong> top, and<br />
positi<strong>on</strong>s <str<strong>on</strong>g>of</str<strong>on</strong>g> maximal displacement (red color) <strong>on</strong> bottom [3].<br />
A natural frequency is a frequency at which a structure will vibrate if deflected and then let go. Mass<br />
and stiffness have opposing effects <strong>on</strong> natural frequencies, with an increase in mass, the frequency will<br />
go down and with an increase in stiffness the natural frequency will go up. Therefore, the balance <str<strong>on</strong>g>of</str<strong>on</strong>g><br />
mass and stiffness is the most important criteria in proper design <str<strong>on</strong>g>of</str<strong>on</strong>g> any endwinding structure. Any<br />
complex structure will have multiple natural frequencies. In electric rotating machines the design goal is<br />
to avoid having natural frequencies <str<strong>on</strong>g>of</str<strong>on</strong>g> the structure close to the rotati<strong>on</strong>al frequency or twice the<br />
power supply frequency, e.g., for a 2 pole synchr<strong>on</strong>ous generator (50/100 Hz or 60/120 Hz). Res<strong>on</strong>ance<br />
is the tendency for a system to vibrate at greater amplitudes at some frequencies than at others and<br />
occurs when the natural frequencies <str<strong>on</strong>g>of</str<strong>on</strong>g> the structure are close the forcing frequencies. The resulting<br />
vibrati<strong>on</strong> levels can be very high and can cause rapid damage to the stator winding. In any machine, the<br />
vibrati<strong>on</strong> excitati<strong>on</strong> forces from its normal operati<strong>on</strong> should be well away from the natural frequencies<br />
<str<strong>on</strong>g>of</str<strong>on</strong>g> the structure to avoid res<strong>on</strong>ant resp<strong>on</strong>ses that can cause very high and destructive vibrati<strong>on</strong> levels.<br />
To determine the natural frequencies <str<strong>on</strong>g>of</str<strong>on</strong>g> a structure, an impact test or bump test is the most frequently<br />
used method. A bump test is a type <str<strong>on</strong>g>of</str<strong>on</strong>g> vibrati<strong>on</strong> test that is normally run <strong>on</strong> a n<strong>on</strong>-operating machine.<br />
The machine is instrumented with <strong>on</strong>e or more vibrati<strong>on</strong> transducers, and the stator endwinding is then<br />
impacted with a massive object such as a hammer. The machine will resp<strong>on</strong>d to the impact with a<br />
vibrati<strong>on</strong> and the signals from the transducers are recorded and fed into a spectrum analyzer. The<br />
resulting spectrum will c<strong>on</strong>tain peaks that corresp<strong>on</strong>d to the natural frequencies. The further step in<br />
analysis <str<strong>on</strong>g>of</str<strong>on</strong>g> a bump test results is modal analysis which is an attempt to identify modes in which the<br />
endwinding can be deformed. <strong>Modal</strong> analysis, for the purposes <str<strong>on</strong>g>of</str<strong>on</strong>g> this testing, refers to the measuring <str<strong>on</strong>g>of</str<strong>on</strong>g><br />
moti<strong>on</strong> at various points <str<strong>on</strong>g>of</str<strong>on</strong>g> a structure when it is excited by some driving force. The pattern <str<strong>on</strong>g>of</str<strong>on</strong>g> moti<strong>on</strong><br />
generally takes certain shapes which are related to the natural frequencies or natural moti<strong>on</strong> tendencies<br />
<str<strong>on</strong>g>of</str<strong>on</strong>g> the structure.<br />
Deflecti<strong>on</strong> Mode Shapes <str<strong>on</strong>g>of</str<strong>on</strong>g> Structure<br />
An endwinding structure can be modeled with a circular ring. Natural modes <str<strong>on</strong>g>of</str<strong>on</strong>g> a ring include breathing,<br />
translati<strong>on</strong>, and bending. When the structure takes certain shapes at similar frequencies to a force, the<br />
res<strong>on</strong>ant c<strong>on</strong>diti<strong>on</strong> amplifies the vibrati<strong>on</strong> <strong>on</strong> an endwinding. For a 2 pole machine the shape for twice<br />
supply frequency deflecti<strong>on</strong> is oval and a for a 4 pole machine the shape is a square shown in Figure 2.<br />
The points <str<strong>on</strong>g>of</str<strong>on</strong>g> minimum displacement are called nodes, and are located at the intersecti<strong>on</strong> <str<strong>on</strong>g>of</str<strong>on</strong>g> the circle<br />
(end winding in stati<strong>on</strong>ary situati<strong>on</strong>) and modal shape typical for that machine. There are 4 nodes in 2<br />
pole and 8 nodes in 4 pole machines. Because <str<strong>on</strong>g>of</str<strong>on</strong>g> this (higher number <str<strong>on</strong>g>of</str<strong>on</strong>g> nodes) and the fact that the<br />
displacement <str<strong>on</strong>g>of</str<strong>on</strong>g> the oval shape is much larger than that <str<strong>on</strong>g>of</str<strong>on</strong>g> the square shape, , 4 pole machines are much<br />
stiffer and generally have less problems related to endwinding vibrati<strong>on</strong>. The other reas<strong>on</strong> for higher<br />
likelihood <str<strong>on</strong>g>of</str<strong>on</strong>g> vibrati<strong>on</strong> in 2 pole machines is the length <str<strong>on</strong>g>of</str<strong>on</strong>g> endwinding, which is much shorter in 4 pole<br />
machines.
Figure 2. Oval (left) and Square (right) mode shapes<br />
The oval (2 pole) and square mode (4 pole) <str<strong>on</strong>g>of</str<strong>on</strong>g> an endwinding are not the <strong>on</strong>ly modes that can be excited<br />
by forces within the rotating machine. Other modes such as cantilever modes (the whole end-winding<br />
bouncing up and down) or breathing modes (expanding and shrinking diametrically) could also become<br />
res<strong>on</strong>ant if forces act <strong>on</strong> the winding in the critical directi<strong>on</strong>s and at the critical frequencies. However,<br />
the oval mode and square mode shape are the most critical for vibrati<strong>on</strong> analysis <str<strong>on</strong>g>of</str<strong>on</strong>g> the stator because<br />
they get naturally driven by the rotor forces if the res<strong>on</strong>ant frequencies are close to the rotor forcing<br />
frequencies. For reliable operati<strong>on</strong> <str<strong>on</strong>g>of</str<strong>on</strong>g> rotating machines, it is critical that natural frequencies for the<br />
mode shapes into which the endwinding can be deformed (see Figure 2) are far away from the driving<br />
frequencies (100 Hz or 120 Hz). To avoid res<strong>on</strong>ance, it is desirable to have natural frequencies <str<strong>on</strong>g>of</str<strong>on</strong>g> the<br />
oval (for 2 pole) or square shape (for 4 pole) higher than twice the network frequency by 15-20 Hz. It is<br />
well known that with the increase <str<strong>on</strong>g>of</str<strong>on</strong>g> temperature, the stiffness <str<strong>on</strong>g>of</str<strong>on</strong>g> any structure will reduce and natural<br />
frequencies will decrease. Since stiffness <str<strong>on</strong>g>of</str<strong>on</strong>g> the endwinding will decrease as the temperature increases,<br />
it is expected that natural frequencies in operati<strong>on</strong> will be lower than during the <str<strong>on</strong>g>of</str<strong>on</strong>g>f-line test, performed<br />
at ambient temperature. However, no published data exists <strong>on</strong> this relati<strong>on</strong>ship.<br />
Case Study<br />
To determine the natural frequency migrati<strong>on</strong> and mode shape changes at different stator winding<br />
temperatures <str<strong>on</strong>g>of</str<strong>on</strong>g> motor endwindings a 13.8 kV, 11.9 MW, 4 pole, 48 slots TEWAC motor (Figures 3 and 4<br />
)was tested at three different temperatures. <str<strong>on</strong>g>Temperature</str<strong>on</strong>g>s were recorded in the cold, warm and hot<br />
c<strong>on</strong>diti<strong>on</strong>s <strong>on</strong> the coil surface near the stator core. The n<strong>on</strong>-c<strong>on</strong>necti<strong>on</strong> end and the c<strong>on</strong>necti<strong>on</strong> end <str<strong>on</strong>g>of</str<strong>on</strong>g><br />
the motor were tested.<br />
Figure 3 – N<strong>on</strong>-C<strong>on</strong>necti<strong>on</strong> End<br />
Figure 4 – C<strong>on</strong>necti<strong>on</strong> End
Two tests were performed <strong>on</strong> this motor, Frequency Resp<strong>on</strong>se <strong>Test</strong> and <strong>Modal</strong> Analysis. For the<br />
Frequency Resp<strong>on</strong>se test, the accelerometer and the impact hammer were at the same locati<strong>on</strong> at 4<br />
points around the motor end winding. This test is used to determine natural frequencies which can be<br />
identified in the frequency resp<strong>on</strong>se functi<strong>on</strong> (FRF).<br />
For the <strong>Modal</strong> Analysis test, the accelerometer measuring resp<strong>on</strong>se was fixed at <strong>on</strong>e point and the<br />
impact hammer was used to generate force at 24 points around the end winding (every sec<strong>on</strong>d coil).<br />
Curve fitting s<str<strong>on</strong>g>of</str<strong>on</strong>g>tware was utilized to generate shape tables and analyze resulting mode shapes.<br />
In additi<strong>on</strong>, reciprocity was checked to validate the shapes <str<strong>on</strong>g>of</str<strong>on</strong>g> this deflecti<strong>on</strong> study. The reciprocity is<br />
established if the pr<str<strong>on</strong>g>of</str<strong>on</strong>g>ile <str<strong>on</strong>g>of</str<strong>on</strong>g> the signature when the impact hammer at point A and the accelerometer<br />
resp<strong>on</strong>se collected at point B is the same as when the hammer impact is at point B and the resp<strong>on</strong>se is<br />
collected at point A.<br />
<strong>Results</strong><br />
Local natural frequencies were identified with frequency resp<strong>on</strong>se testing at increasing temperature<br />
c<strong>on</strong>diti<strong>on</strong>s <strong>on</strong> the n<strong>on</strong>-c<strong>on</strong>necti<strong>on</strong> end (NCE) and the c<strong>on</strong>necti<strong>on</strong> end (CE) <str<strong>on</strong>g>of</str<strong>on</strong>g> the motor. The results<br />
indicate a general shift <str<strong>on</strong>g>of</str<strong>on</strong>g> decreasing frequency resp<strong>on</strong>se as temperature increases. Figures 5-7 are<br />
results from the same test point at three different temperatures. The upper part <str<strong>on</strong>g>of</str<strong>on</strong>g> each graph is an<br />
indicati<strong>on</strong> <str<strong>on</strong>g>of</str<strong>on</strong>g> phase and lower part is result <str<strong>on</strong>g>of</str<strong>on</strong>g> Fourier Transform, identifying natural frequencies <str<strong>on</strong>g>of</str<strong>on</strong>g> the<br />
test point. Three colors are indicators <str<strong>on</strong>g>of</str<strong>on</strong>g> movement in each <str<strong>on</strong>g>of</str<strong>on</strong>g> three axes, x, y and z.<br />
Frequency Resp<strong>on</strong>se H1(4524 B-xyz.x,8207 Ref.) - STS Measurement 1 (Bode Cursor Plot values - Phase/Magnitude) \ STS FFT An<br />
Frequency Resp<strong>on</strong>se H1(4524 B-xyz.y,8207 Ref.) - STS Measurement 1 (Bode X: 153.500 Plot - Phase/Magnitude) Hz<br />
\ STS FFT An<br />
Frequency Resp<strong>on</strong>se H1(4524 B-xyz.z,8207 Ref.) - STS Measurement 1 (Bode Y(Mg):0.142 Plot - Phase/Magnitude) (m/s^2)/N \ STS FFT An<br />
[(m/s^2)/N]<br />
Y(Mg):45.943m (m/s^2)/N<br />
Y(Mg):11.935m (m/s^2)/N<br />
100<br />
y(Ph):91.851 degrees<br />
0.14<br />
20<br />
y(Ph):80.560 degrees<br />
y(Ph):-105.539 degrees<br />
Markers<br />
0.1<br />
Marker1: 113.5Hz,0.153(m/s^2)/N<br />
60m<br />
Marker2: 128Hz,0.112(m/s^2)/N<br />
Marker3: 153.5Hz,0.142(m/s^2)/N<br />
20m<br />
Marker4: 189Hz,50.973m(m/s^2)/N<br />
0 20 40 60 80 100 120 140 160 180 200<br />
[Hz]<br />
Figure 5 - NCE Point 1 FRF Cold at 22°C
Frequency Resp<strong>on</strong>se H1(4524 B-xyz.x,8207 Ref.) - STS Measurement 1 (Bode Cursor Plot - values Phase/Magnitude) \ STS FFT An<br />
Frequency Resp<strong>on</strong>se H1(4524 B-xyz.y,8207 Ref.) - STS Measurement 1 (Bode X: 150.000 Plot - Phase/Magnitude) Hz<br />
\ STS FFT An<br />
Frequency Resp<strong>on</strong>se H1(4524 B-xyz.z,8207 Ref.) - STS Measurement 1 (Bode Y(Mg):0.119 Plot - Phase/Magnitude) (m/s^2)/N \ STS FFT An<br />
[(m/s^2)/N]<br />
Y(Mg):36.653m (m/s^2)/N<br />
Y(Mg):9.463m (m/s^2)/N<br />
100<br />
y(Ph):82.289 degrees<br />
0.14<br />
20<br />
y(Ph):94.672 degrees<br />
y(Ph):-55.355 degrees<br />
Markers<br />
0.1<br />
Marker1: 111Hz,0.14(m/s^2)/N<br />
60m<br />
Marker2: 125.5Hz,0.109(m/s^2)/N<br />
Marker3: 150Hz,0.119(m/s^2)/N<br />
20m<br />
Marker4: 185Hz,38.885m(m/s^2)/N<br />
0 20 40 60 80 100 120 140 160 180 200<br />
[Hz]<br />
Figure 6 - NCE Point 1 FRF Cold at 58°C<br />
<br />
Frequency Resp<strong>on</strong>se H1(4524 B-xyz.x,8207 Ref.) - STS Measurement 1 (Bode Cursor Plot - values Phase/Magnitude) \ STS FFT An<br />
Frequency Resp<strong>on</strong>se H1(4524 B-xyz.y,8207 Ref.) - STS Measurement 1 (Bode X: 174.000 Plot - Phase/Magnitude) Hz<br />
\ STS FFT An<br />
Frequency Resp<strong>on</strong>se H1(4524 B-xyz.z,8207 Ref.) - STS Measurement 1 (Bode Y(Mg):41.494m Plot - Phase/Magnitude) (m/s^2)/N \ STS FFT An<br />
[(m/s^2)/N]<br />
Y(Mg):18.631m (m/s^2)/N<br />
Y(Mg):12.140m (m/s^2)/N<br />
100<br />
y(Ph):127.302 degrees<br />
0.14<br />
20<br />
y(Ph):120.175 degrees<br />
y(Ph):-153.692 degrees<br />
Markers<br />
0.1<br />
Marker1: 99Hz,0.097(m/s^2)/N<br />
60m<br />
Marker2: 112.5Hz,61.41m(m/s^2)/N<br />
Marker3: 139.5Hz,62.874m(m/s^2)/N<br />
20m<br />
Marker4: 174Hz,41.494m(m/s^2)/N<br />
0 20 40 60 80 100 120 140 160 180 200<br />
[Hz]<br />
Figure 7 - NCE Point 1 FRF Hot at 90°C<br />
<br />
Mode shape tables were produced from the end winding data. The mode shape can be identified by<br />
comparing the animati<strong>on</strong> to the known ring mode shapes. The shape tables generated show how the<br />
endwinding dynamics change with temperature. Although <strong>on</strong>ly 2 mode shapes are the critical <strong>on</strong>es<br />
(n=2 and n=4) analysis <str<strong>on</strong>g>of</str<strong>on</strong>g> temperature effect <strong>on</strong> mode shape frequency was performed for other modes<br />
as well, see Tables 1 and 2.
Frequency (Hz)<br />
Mode<br />
Cold<br />
(22°C)<br />
Tables 1 and 2 – NCE and CE Mode Shape Tables<br />
N<strong>on</strong> C<strong>on</strong>necti<strong>on</strong> End<br />
Mode Shape Frequency (Hz)<br />
Warm<br />
(61°C)<br />
Hot<br />
(84-76°C)<br />
Mode<br />
C<strong>on</strong>necti<strong>on</strong> End<br />
Mode Shape Frequency (Hz)<br />
Cold Warm Hot<br />
(24°C) (60-58°C) (90-82°C)<br />
n=1 103.66 100.13 91.87 n=2 104.36 101.28 93.32<br />
n=2 114.25 111.12 103.59 n=3 122.03 118.26 110.93<br />
n=3 128.38 125.12 117.13 n=3 127.01 124.15 116.25<br />
n=3 139.80 136.44 130.39 n=4 162.16 155.96 148.60<br />
n=4 153.83 149.70 143.79 n=4 166.78 161.73 153.44<br />
n=5 190.72 185.40 179.11<br />
Due to a number <str<strong>on</strong>g>of</str<strong>on</strong>g> local res<strong>on</strong>ances <strong>on</strong> the c<strong>on</strong>necti<strong>on</strong> end, additi<strong>on</strong>al frequencies were present in the<br />
FR plots and the resulting mode shapes have increased complexity. Regardless, the results show that<br />
even though the NCE is a better structural ring compared to the CE, the frequency migrati<strong>on</strong> for the<br />
natural frequencies identified are similar at increasing temperatures. This effect is displayed in the figure<br />
below.<br />
190<br />
165<br />
140<br />
115<br />
90<br />
20 55 90<br />
<str<strong>on</strong>g>Temperature</str<strong>on</strong>g> (deg C)<br />
NCE n=5<br />
CE n=4-2<br />
CE n=4-1<br />
NCE n=4<br />
NCE n=3-2<br />
NCE n=3-1<br />
CE n=3-2<br />
CE n=3-1<br />
NCE n=2<br />
CE n=2<br />
NCE n=1<br />
Figure 8 – <str<strong>on</strong>g>Temperature</str<strong>on</strong>g> vs. Mode Shape Frequency Plot<br />
A correlati<strong>on</strong> factor was calculated between these mode shapes as an indicator <str<strong>on</strong>g>of</str<strong>on</strong>g> how closely they<br />
match each other. A high factor, close to 1 is a good match. Lower correlati<strong>on</strong> factors <strong>on</strong> the CE are a<br />
representati<strong>on</strong> <str<strong>on</strong>g>of</str<strong>on</strong>g> the additi<strong>on</strong>al local natural frequencies previously discussed.
Tables 3 and 4 – NCE and CE Mode Shape Correlati<strong>on</strong> Factors<br />
NCE Warm<br />
Correlati<strong>on</strong> Factor<br />
CE Warm<br />
Correlati<strong>on</strong> Factor<br />
Mode to Cold to Hot Mode to Cold to Hot<br />
n=1 0.961 0.901 n=2 0.942 0.911<br />
n=2 0.968 0.955 n=3 1 0.719 0.416<br />
n=3 1 0.984 0.951 n=3 2 0.717 0.612<br />
n=3 2 0.957 0.878 n=4 1 0.693 0.637<br />
n=4 0.950 0.897 n=4 2 0.866 0.816<br />
n=5 0.924 0.858<br />
This indicates that even though the mode shape frequencies measured were affected by the<br />
temperature <str<strong>on</strong>g>of</str<strong>on</strong>g> the end winding the mode shapes were not. This can visually be c<strong>on</strong>firmed with the<br />
plots below showing the n=2 mode <str<strong>on</strong>g>of</str<strong>on</strong>g> the n<strong>on</strong>-c<strong>on</strong>necti<strong>on</strong> end in the cold c<strong>on</strong>diti<strong>on</strong> superimposed <strong>on</strong><br />
the hot c<strong>on</strong>diti<strong>on</strong>.<br />
Figure 9 – NCE n=2 Mode Shape Positi<strong>on</strong> 1 Cold and Hot results
Figure 10 – NCE n=2 Mode Shape Positi<strong>on</strong> 2 Cold and Hot results<br />
The locati<strong>on</strong>s <str<strong>on</strong>g>of</str<strong>on</strong>g> the node points and corresp<strong>on</strong>ding anti-nodes where the maximum vibrati<strong>on</strong><br />
amplitudes occur <strong>on</strong> a circular ring were not affected by temperature. This phenomen<strong>on</strong> can be seen <strong>on</strong><br />
all the mode shapes identified <strong>on</strong> both ends <str<strong>on</strong>g>of</str<strong>on</strong>g> the motor.<br />
C<strong>on</strong>clusi<strong>on</strong>s<br />
Based <strong>on</strong> tests performed <strong>on</strong> a 13.8KV, 4 pole stator, the natural frequencies <str<strong>on</strong>g>of</str<strong>on</strong>g> the endwinding mode<br />
shapes decreased as temperature increased. In general, these frequencies decreased by 9-12 Hz as<br />
temperature increased from 22°C to 85°C. However, the characteristics <str<strong>on</strong>g>of</str<strong>on</strong>g> the mode shapes including<br />
anti-node locati<strong>on</strong>s remain stable across the range <str<strong>on</strong>g>of</str<strong>on</strong>g> temperatures.<br />
This informati<strong>on</strong> is important to establish proper locati<strong>on</strong> for installati<strong>on</strong> <str<strong>on</strong>g>of</str<strong>on</strong>g> endwinding vibrati<strong>on</strong><br />
sensors since the maximum deflecti<strong>on</strong> locati<strong>on</strong>s identified with modal analysis at ambient temperature<br />
did not change at stator winding operating temperature.<br />
Acknowledgement<br />
The experimental results were d<strong>on</strong>e with the help <str<strong>on</strong>g>of</str<strong>on</strong>g> Moti<strong>on</strong> Electric in Mississauga, Canada.<br />
References<br />
1. Electrical Insulati<strong>on</strong> for Rotating machines, Greg C. St<strong>on</strong>e, Edward A. Boulter, Ian Culbert,<br />
Hussein Dhirani, IEEE Press - Wiley 2004
2. An Analytical Approach to Solving Motor Vibrati<strong>on</strong> Problems, William R. Finley Mark M.<br />
Hodowanec Warren G. Holter, IEEE PCIC 1990, Paper No PCIC-99-20<br />
3. End-<str<strong>on</strong>g>Winding</str<strong>on</strong>g> Vibrati<strong>on</strong>s Caused by Steady-State Magnetic Forces in an Inducti<strong>on</strong> Machine,<br />
Ranran Lin, Antti Nestori Laiho, Ari Haavisto, and Antero Arkkio, IEEE TRANSACTIONS ON<br />
MAGNETICS, VOL. 46, NO. 7, JULY 2010