Full annual report of 2011-2012 - Mindtree
Full annual report of 2011-2012 - Mindtree
Full annual report of 2011-2012 - Mindtree

You also want an ePaper? Increase the reach of your titles
YUMPU automatically turns print PDFs into web optimized ePapers that Google loves.
5. Determination <strong>of</strong> fair values<br />
The Company's accounting policies and disclosures require the determination <strong>of</strong> fair value, for both financial and non-financial assets and<br />
liabilities. Fair values have been determined for measurement and/or disclosure purposes based on the following methods.<br />
(i) Property, plant and equipment<br />
The fair value <strong>of</strong> property, plant and equipment recognized as a result <strong>of</strong> a business combination is based on appraised market values<br />
and replacement cost determined by an external valuer.<br />
(ii) Intangible assets<br />
The fair value <strong>of</strong> intangible assets is based on the discounted cash flows expected to be derived from the use and eventual sale <strong>of</strong> the<br />
assets as determined by an external valuer.<br />
(iii) Investments in equity and debt securities and units <strong>of</strong> mutual funds<br />
The fair value <strong>of</strong> available-for-sale equity securities is determined using a valuation technique.<br />
In respect <strong>of</strong> investments in mutual funds, the fair values represent net asset value as stated by the issuers <strong>of</strong> these mutual fund units in<br />
the published statements. Net asset values represent the price at which the issuer will issue further units in the mutual fund and the<br />
price at which issuers will redeem such units from the investors. Accordingly, such net asset values are analogous to fair market value<br />
with respect to these investments, as transactions <strong>of</strong> these mutual funds are carried out at such prices between investors and the<br />
issuers <strong>of</strong> these units <strong>of</strong> mutual funds.<br />
(iv) Derivatives<br />
The fair value <strong>of</strong> forward exchange contracts is estimated by discounting the difference between the contractual forward price and the<br />
current forward price for the residual maturity <strong>of</strong> the contract using a risk-free interest rate (based on government bonds). The fair<br />
value <strong>of</strong> foreign currency option contracts is determined based on the appropriate valuation techniques, considering the terms <strong>of</strong> the<br />
contract.<br />
(v) Non-derivative financial liabilities<br />
Fair value, which is determined for disclosure purposes, is calculated based on the present value <strong>of</strong> future principal and interest cash<br />
flows, discounted at the market rate <strong>of</strong> interest at the <strong>report</strong>ing date.<br />
(vi) Share-based payment transactions<br />
The fair value <strong>of</strong> employee stock options is measured using the Black-Scholes valuation model. Measurement inputs include share price<br />
on grant date, exercise price <strong>of</strong> the instrument, expected volatility (based on weighted average historical volatility), expected life <strong>of</strong><br />
the instrument (based on historical experience), expected dividends, and the risk free interest rate (based on government bonds).<br />
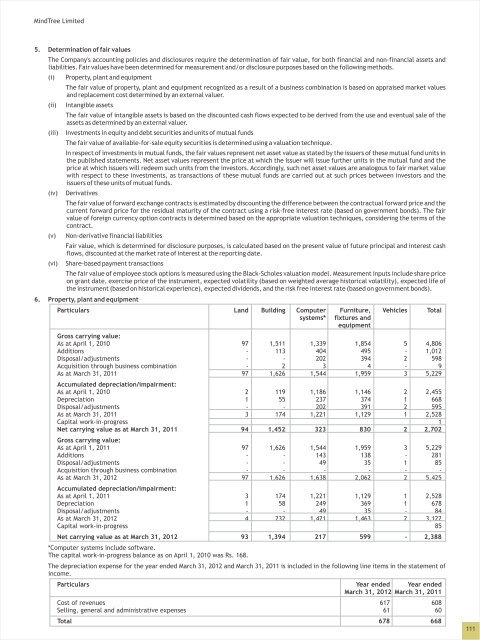
6. Property, plant and equipment<br />
Particulars Land Building Computer Furniture, Vehicles Total<br />
systems* fixtures and<br />
equipment<br />
Gross carrying value:<br />
As at April 1, 2010 97 1,511 1,339 1,854 5 4,806<br />
Additions - 113 404 495 - 1,012<br />
Disposal/adjustments - - 202 394 2 598<br />
Acquisition through business combination - 2 3 4 - 9<br />
As at March 31, <strong>2011</strong> 97 1,626 1,544 1,959 3 5,229<br />
Accumulated depreciation/impairment:<br />
As at April 1, 2010 2 119 1,186 1,146 2 2,455<br />
Depreciation 1 55 237 374 1 668<br />
Disposal/adjustments - - 202 391 2 595<br />
As at March 31, <strong>2011</strong> 3 174 1,221 1,129 1 2,528<br />
Capital work-in-progress 1<br />
Net carrying value as at March 31, <strong>2011</strong> 94 1,452 323 830 2 2,702<br />
Gross carrying value:<br />
As at April 1, <strong>2011</strong> 97 1,626 1,544 1,959 3 5,229<br />
Additions - - 143 138 - 281<br />
Disposal/adjustments - - 49 35 1 85<br />
Acquisition through business combination - - - - - -<br />
As at March 31, <strong>2012</strong> 97 1,626 1,638 2,062 2 5,425<br />
Accumulated depreciation/impairment:<br />
As at April 1, <strong>2011</strong> 3 174 1,221 1,129 1 2,528<br />
Depreciation 1 58 249 369 1 678<br />
Disposal/adjustments - - 49 35 - 84<br />
As at March 31, <strong>2012</strong> 4 232 1,421 1,463 2 3,122<br />
Capital work-in-progress 85<br />
Net carrying value as at March 31, <strong>2012</strong> 93 1,394 217 599 - 2,388<br />
*Computer systems include s<strong>of</strong>tware.<br />
The capital work-in-progress balance as on April 1, 2010 was Rs. 168.<br />
The depreciation expense for the year ended March 31, <strong>2012</strong> and March 31, <strong>2011</strong> is included in the following line items in the statement <strong>of</strong><br />
income.<br />
Particulars Year ended Year ended<br />
March 31, <strong>2012</strong> March 31, <strong>2011</strong><br />
Cost <strong>of</strong> revenues 617 608<br />
Selling, general and administrative expenses 61 60<br />
Total 678 668<br />
111