Full annual report of 2011-2012 - Mindtree
Full annual report of 2011-2012 - Mindtree
Full annual report of 2011-2012 - Mindtree

Create successful ePaper yourself
Turn your PDF publications into a flip-book with our unique Google optimized e-Paper software.
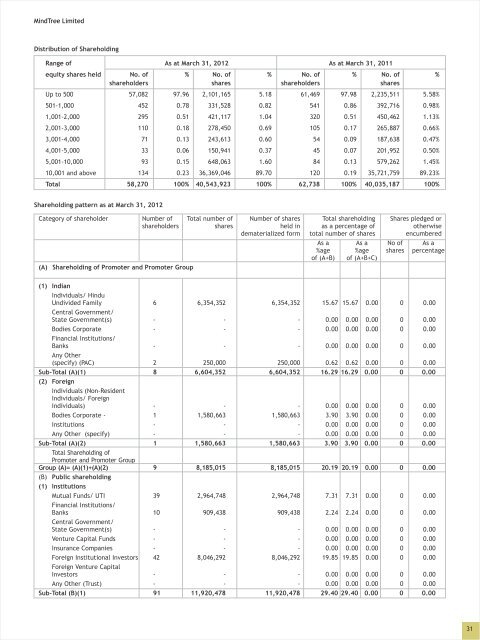
Distribution <strong>of</strong> Shareholding<br />
Range <strong>of</strong> As at March 31, <strong>2012</strong> As at March 31, <strong>2011</strong><br />
equity shares held No. <strong>of</strong> % No. <strong>of</strong> % No. <strong>of</strong> % No. <strong>of</strong> %<br />
shareholders shares shareholders shares<br />
Up to 500 57,082 97.96 2,101,165 5.18 61,469 97.98 2,235,511 5.58%<br />
501-1,000 452 0.78 331,528 0.82 541 0.86 392,716 0.98%<br />
1,001-2,000 295 0.51 421,117 1.04 320 0.51 450,462 1.13%<br />
2,001-3,000 110 0.18 278,450 0.69 105 0.17 265,887 0.66%<br />
3,001-4,000 71 0.13 243,613 0.60 54 0.09 187,638 0.47%<br />
4,001-5,000 33 0.06 150,941 0.37 45 0.07 201,952 0.50%<br />
5,001-10,000 93 0.15 648,063 1.60 84 0.13 579,262 1.45%<br />
10,001 and above 134 0.23 36,369,046 89.70 120 0.19 35,721,759 89.23%<br />
Total 58,270 100% 40,543,923 100% 62,738 100% 40,035,187 100%<br />
Shareholding pattern as at March 31, <strong>2012</strong><br />
Category <strong>of</strong> shareholder Number <strong>of</strong> Total number <strong>of</strong> Number <strong>of</strong> shares Total shareholding Shares pledged or<br />
shareholders shares held in as a percentage <strong>of</strong> otherwise<br />
dematerialized form total number <strong>of</strong> shares encumbered<br />
As a As a No <strong>of</strong> As a<br />
%age %age shares percentage<br />
<strong>of</strong> (A+B) <strong>of</strong> (A+B+C)<br />
(A) Shareholding <strong>of</strong> Promoter and Promoter Group<br />
(1) Indian<br />
Individuals/ Hindu<br />
Undivided Family 6 6,354,352 6,354,352 15.67 15.67 0.00 0 0.00<br />
Central Government/<br />
State Government(s) - - - 0.00 0.00 0.00 0 0.00<br />
Bodies Corporate - - - 0.00 0.00 0.00 0 0.00<br />
Financial Institutions/<br />
Banks - - - 0.00 0.00 0.00 0 0.00<br />
Any Other<br />
(specify) (PAC) 2 250,000 250,000 0.62 0.62 0.00 0 0.00<br />
Sub-Total (A)(1) 8 6,604,352 6,604,352 16.29 16.29 0.00 0 0.00<br />
(2) Foreign<br />
Individuals (Non-Resident<br />
Individuals/ Foreign<br />
Individuals) - - - 0.00 0.00 0.00 0 0.00<br />
Bodies Corporate - 1 1,580,663 1,580,663 3.90 3.90 0.00 0 0.00<br />
Institutions - - - 0.00 0.00 0.00 0 0.00<br />
Any Other (specify) - - - 0.00 0.00 0.00 0 0.00<br />
Sub-Total (A)(2) 1 1,580,663 1,580,663 3.90 3.90 0.00 0 0.00<br />
Total Shareholding <strong>of</strong><br />
Promoter and Promoter Group<br />
Group (A)= (A)(1)+(A)(2) 9 8,185,015 8,185,015 20.19 20.19 0.00 0 0.00<br />
(B) Public shareholding<br />
(1) Institutions<br />
Mutual Funds/ UTI 39 2,964,748 2,964,748 7.31 7.31 0.00 0 0.00<br />
Financial Institutions/<br />
Banks 10 909,438 909,438 2.24 2.24 0.00 0 0.00<br />
Central Government/<br />
State Government(s) - - - 0.00 0.00 0.00 0 0.00<br />
Venture Capital Funds - - - 0.00 0.00 0.00 0 0.00<br />
Insurance Companies - - - 0.00 0.00 0.00 0 0.00<br />
Foreign Institutional Investors 42 8,046,292 8,046,292 19.85 19.85 0.00 0 0.00<br />
Foreign Venture Capital<br />
Investors - - - 0.00 0.00 0.00 0 0.00<br />
Any Other (Trust) - - - 0.00 0.00 0.00 0 0.00<br />
Sub-Total (B)(1) 91 11,920,478 11,920,478 29.40 29.40 0.00 0 0.00<br />
31