Download this week's charts in PDF format - TTI Inc.
Download this week's charts in PDF format - TTI Inc.
Download this week's charts in PDF format - TTI Inc.

You also want an ePaper? Increase the reach of your titles
YUMPU automatically turns print PDFs into web optimized ePapers that Google loves.
20120720<br />
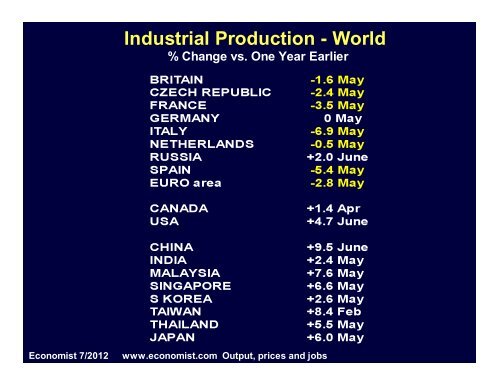
Industrial Production - World<br />
% Change vs. One Year Earlier<br />
Economist 7/2012 www.economist.com Output, prices and jobs
20120723<br />
Global Electronic Equipment Shipment Growth<br />
1.6 3/12 rate of growth <strong>in</strong> local currency Taiwan/Ch<strong>in</strong>a<br />
Europe<br />
Japan<br />
USA<br />
1.5<br />
0 Growth<br />
1.4<br />
1.3<br />
1.2<br />
1.1<br />
1<br />
0.9<br />
0.8<br />
0.7<br />
0.6<br />
Europe = Eurostat EU27 NACE C26 (computer, electronic & optical products)<br />
1 4 710 1 4 7 10 1 4 7 101 4 710 1 4 710 1 4 710 1 4 7 10 1 4 7 101 4 710 1 4 710 1 4 7 10 1 4 7 10 1 4 7<br />
00 01 02 03 04 05 06 07 08 09 10 11 12<br />
CALENDAR YEAR
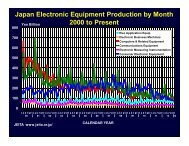
Japan Electronic Equipment Production by Month<br />
2000 to Present<br />
20120722<br />
800 Yen Billion Consumer Electronic Equipment<br />
700<br />
600<br />
Elec Application Equip<br />
Electronic Bus<strong>in</strong>ess Mach<strong>in</strong>es<br />
Computers & Related Equipment<br />
Communications Equipment<br />
Electronic Measur<strong>in</strong>g Instrumentation<br />
500<br />
400<br />
300<br />
200<br />
100<br />
0<br />
1 3 5 7 9111 3 5 7 9111 3 5 7 9111 3 5 7 9111 3 5 7 9111 3 5 7 9111 3 5 7 9111 3 5 7 9111 3 5 7 9111 3 5 7 9111 3 5 7 9111 3 5 7 9111 3 5<br />
00 01 02 03 04 05 06 07 08 09 10 11 12<br />
JEITA www.jeita.or.jp/<br />
CALENDAR YEAR
20120722<br />
Japan Electronic Equipment Production<br />
2000 to Present<br />
Elec Application Equip<br />
2000 Yen billion Electronic Bus<strong>in</strong>ess Mach<strong>in</strong>es<br />
-1%<br />
-6%<br />
+8%<br />
Consumer Electronic Equipment<br />
-4% -4%<br />
1500<br />
-6%<br />
-32% +6%<br />
-23%<br />
Computers & Related Equipment<br />
Communications Equipment<br />
Electronic Measur<strong>in</strong>g Instrumentation<br />
-1%<br />
1000<br />
500<br />
0<br />
1 3 5 7 9111 3 5 7 9111 3 5 7 9111 3 5 7 9111 3 5 7 9111 3 5 7 9111 3 5 7 9111 3 5 7 9111 3 5 7 9111 3 5 7 9111 3 5 7 9111 3 5 7 9111 3 5<br />
00 01 02 03 04 05 06 07 08 09 10 11 12<br />
JEITA www.jeita.or.jp/<br />
CALENDAR YEAR
20120722<br />
Japan PCB Shipments<br />
100<br />
Yen (billion)<br />
80<br />
60<br />
40<br />
20<br />
2010/2009<br />
+16%<br />
0<br />
1 1 1 1 1 1 1 1 1 1 1 1 1 1 1 1 1 1 1 1 1 1 1 1 1 1 1 1 1 1 1<br />
82 83 84 85 86 87 88 89 90 91 92 93 94 95 96 97 98 99 00 01 02 03 04 05 06 07 08 09 10 11 12<br />
www.jpca.org/kikaitoukei/kikai2012.xls<br />
CALENDAR YEAR
20120723<br />
1.6<br />
1.5<br />
1.4<br />
1.3<br />
1.2<br />
1.1<br />
1<br />
0.9<br />
0.8<br />
0.7<br />
0.6<br />
0.5<br />
3/12 rate of change<br />
Japan PCB Shipments<br />
0.4<br />
1 1 1 1 1 1 1 1 1 1 1 1 1 1 1 1 1 1 1 1 1 1 1 1 1 1 1 1 1<br />
84 85 86 87 88 89 90 91 92 93 94 95 96 97 98 99 00 01 02 03 04 05 06 07 08 09 10 11 12<br />
www.jpca.org/kikaitoukei/kikai2011.xls<br />
CALENDAR YEAR
20120722<br />
1.6<br />
1.5<br />
1.4<br />
1.3<br />
1.2<br />
1.1<br />
1<br />
0.9<br />
0.8<br />
0.7<br />
0.6<br />
Japanese Electronic Component & Device<br />
Production<br />
3/12 RATE OF CHANGE<br />
Zero Growth Devices Components<br />
0.5<br />
3 5 7 9111 3 5 7 9111 3 5 7 9111 3 5 7 9111 3 5 7 9111 3 5 7 9111 3 5 7 9111 3 5 7 9111 3 5 7 9111 3 5 7 9111 3 5 7 9111 3 5<br />
01 02 03 04 05 06 07 08 09 10 11 12<br />
CALENDAR YEAR<br />
JEITA www.jeita.or.jp/
20120723<br />
Regional PCB Shipment Growth<br />
1.9 3/12 rate of growth <strong>in</strong> local currency Europe<br />
Taiwan/Ch<strong>in</strong>a<br />
1.8<br />
1.7<br />
1.6<br />
1.5<br />
1.4<br />
1.3<br />
1.2<br />
1.1<br />
1<br />
0.9<br />
0.8<br />
0.7<br />
0.6<br />
0.5<br />
0.4<br />
1 4 7 101 4 710 1 4 710 1 4 7 10 1 4 7 10 1 4 7 101 4 710 1 4 7 10 1 4 7 10 1 4 7 101 4 710 1 4 710 1 4 7<br />
00 01 02 03 04 05 06 07 08 09 10 11 12<br />
CALENDAR YEAR<br />
Japan<br />
N America<br />
0 Growth<br />
Sources: IPC, JPCA, Taiwan/Ch<strong>in</strong>a composite; modified SIA chip shipments to approximate Europe
20120723<br />
World PCB Monthly Shipments<br />
Converted @ Constant 2010 Exchange Rates<br />
4 $ Billions N America Europe Japan ROA<br />
3<br />
2<br />
1<br />
0<br />
13579111357911135791113579111357911135791113579111357911135791113579111357911135791113579111357<br />
99 00 01 02 03 04 05 06 07 08 09 10 11 12<br />
Source: Custer Consult<strong>in</strong>g Group<br />
CALENDAR YEAR
20120723<br />
World PCB Monthly Shipments<br />
Converted @ Constant 2008 Exchange Rates<br />
6 $ Billion N America Europe Japan ROA ROW<br />
5<br />
4<br />
3<br />
2<br />
1<br />
0<br />
1357911135791113579111357911135791113579111357911135791113579111357911135791113579111357911135<br />
99 00 01 02 03 04 05 06 07 08 09 10 11 12<br />
Source: Custer Consult<strong>in</strong>g Group<br />
CALENDAR YEAR
20120723<br />
100%<br />
World PCB Monthly Shipments<br />
Converted @ Constant 2007 Exchange Rates<br />
80%<br />
N America Europe Japan ROA ROW<br />
60%<br />
40%<br />
20%<br />
0%<br />
1357911135791113579111357911135791113579111357911135791113579111357911135791113579111357911135<br />
99 00 01 02 03 04 05 06 07 08 09 10 11 12<br />
Source: Custer Consult<strong>in</strong>g Group<br />
CALENDAR YEAR
20120723<br />
World PCB Monthly Shipments (with forecast)<br />
Converted @ Constant 2010 Exchange Rates<br />
5 Thousands N America Europe Japan ROA<br />
4<br />
3<br />
2<br />
1<br />
0<br />
135791113579111357911135791113579111357911135791113579111357911135791113579111357911135791113579111<br />
99 00 01 02 03 04 05 06 07 08 09 10 11 12 13<br />
Source: Custer Consult<strong>in</strong>g Group<br />
CALENDAR YEAR
20120723<br />
60 $ Billion<br />
50<br />
40<br />
World PCB Shipments (with forecast)<br />
Converted @ Constant 2010 Exchange Rates<br />
Growth calculations:<br />
Europe = composite European SIA & local PCB<br />
assoc data<br />
Japan & N. America from JPCA & IPC data<br />
Taiwan/Ch<strong>in</strong>a:46 rigid & flex company<br />
composite<br />
Rest of Asia growth = Taiwan/Ch<strong>in</strong>a 44<br />
company composite<br />
+19%<br />
-14%<br />
-1%<br />
0%<br />
30<br />
20<br />
31.6 38.6 31.2 29.4 31.7 37.6 42.9 51.7 54.3 53.2 45.9 54.5<br />
1 3 5 7 9111 3 5 7 9111 3 5 7 9111 3 5 7 9111 3 5 7 9111 3 5 7 9111 3 5 7 9111 3 5 7 9111 3 5 7 9111 3 5 7 9111 3 5 7 9111 3 5 7 9111 3 5 7 9111 3 5 7 9111<br />
99 00 01 02 03 04 05 06 07 08 09 10 11 12 13<br />
53.8<br />
53.8<br />
CALENDAR YEAR<br />
Source: Custer Consult<strong>in</strong>g Group - 2010 base year expanded by monthly growth of N. American,<br />
European, Japanese & Taiwan/Ch<strong>in</strong>a monthly PCB shipments
20120723<br />
World Global PMI, Electronic Equipment, PCB &<br />
Semiconductor Shipments<br />
3/12 rate of change<br />
1.5<br />
PCB "0" Growth SIA<br />
El Equip Global PMI<br />
1.3<br />
1.1<br />
0.9<br />
0.7<br />
0.5<br />
3 6 9123 6 9123 6 9123 6 9123 6 9123 6 9123 6 9123 6 9123 6 9123 6 9123 6 9123 6 9123 6<br />
00 01 02 03 04 05 06 07 08 09 10 11 12<br />
CALENDAR YEAR<br />
Source: Custer Consult<strong>in</strong>g Group
20120723<br />
CCG Global PCB Lead<strong>in</strong>g Indicator<br />
vs Global PCB Shipments<br />
3/12 rate of change<br />
1.5<br />
PCB Shipments<br />
PCB Lead<strong>in</strong>g Indicator<br />
"0" Growth<br />
1.3<br />
1.1<br />
0.9<br />
0.7<br />
0.5<br />
1 2 3 4 5 6 7 8 9101 121 2 3 4 5 6 7 8 9101 121 2 3 4 5 6 7 8 9101 121 2 3 4 5 6 7 8 9101 121 2 3 4 5 6 7 8 9101 121 2 3 4 5 6 7 8 9101 121 2 3 4 5 6 7 8 9101 121 2 3 4 5 6 7<br />
05 06 07 08 09 10 11 12<br />
CALENDAR YEAR<br />
Source: Custer Consult<strong>in</strong>g Group
20020720<br />
N American Semiconductor Equipment Industry<br />
Book/Bill Ratio<br />
1.6 B/B (3 Month Avg) Production Equipment<br />
1.4<br />
Not Chips<br />
1.2<br />
1<br />
0.8<br />
0.6<br />
0.4<br />
1012 2 4 6 8 10122 4 6 8 1012 2 4 6 8 1012 2 4 6 8 10122 4 6 8 1012 2 4 6 8 1012 2 4 6 8 1012 2 4 6 8 1012 2 4 6 8 1012 2 4 6 8 10122 4 6 8 1012 2 4 6 8 1012 2 4 6<br />
99 00 01 02 03 04 05 06 07 08 09 10 11 12<br />
SOURCE Semiconductor Equipment and Materials International<br />
http://www.semi.org
20120720<br />
N American Semiconductor Equipment Industry<br />
Shipments & Orders<br />
3500 $M<br />
3000<br />
Shipments<br />
2500<br />
Orders<br />
2000<br />
1500<br />
1000<br />
500<br />
0<br />
1357911135791113579111357911135791113579111357911135791113579111357911135791113579111357<br />
00 01 02 03 04 05 06 07 08 09 10 11 12<br />
SOURCE Semiconductor Equipment and Materials International<br />
http://www.semi.org
20120722<br />
Major Capital Spenders Plann<strong>in</strong>g 2012<br />
$M<br />
2011 2012F 12/11 %<br />
Intel 10,764 12,500 16%<br />
Samsung 11,755 13,100 11%<br />
TSMC 7,333 8,250 13%<br />
Hynix 3,165 3,680 16%<br />
UMC 1,585 2,000 26%<br />
Rohm 385 685 78%<br />
Subtotal 34,987 40,215 15%<br />
Others 30,568 23,055 -25%<br />
WW Total 65,555 63,270 -3%<br />
IC Insights 7/12