Homework 7 - Department of Psychological Sciences
Homework 7 - Department of Psychological Sciences
Homework 7 - Department of Psychological Sciences

Create successful ePaper yourself
Turn your PDF publications into a flip-book with our unique Google optimized e-Paper software.
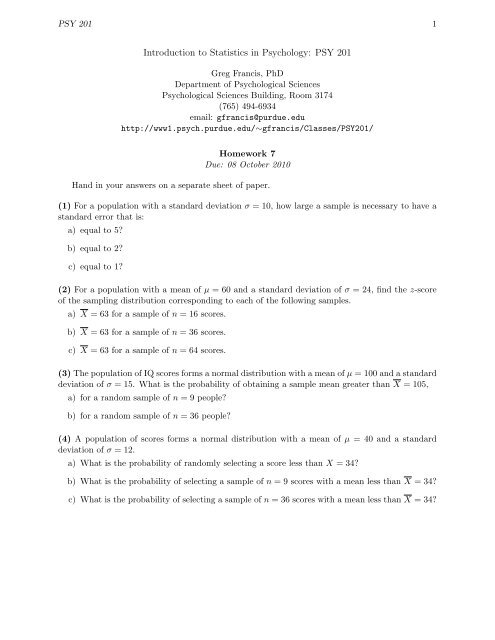
PSY 201 1<br />
Introduction to Statistics in Psychology: PSY 201<br />
Greg Francis, PhD<br />
<strong>Department</strong> <strong>of</strong> <strong>Psychological</strong> <strong>Sciences</strong><br />
<strong>Psychological</strong> <strong>Sciences</strong> Building, Room 3174<br />
(765) 494-6934<br />
email: gfrancis@purdue.edu<br />
http://www1.psych.purdue.edu/∼gfrancis/Classes/PSY201/<br />
<strong>Homework</strong> 7<br />
Due: 08 October 2010<br />
Hand in your answers on a separate sheet <strong>of</strong> paper.<br />
(1) For a population with a standard deviation σ = 10, how large a sample is necessary to have a<br />
standard error that is:<br />
a) equal to 5?<br />
b) equal to 2?<br />
c) equal to 1?<br />
(2) For a population with a mean <strong>of</strong> µ = 60 and a standard deviation <strong>of</strong> σ = 24, find the z-score<br />
<strong>of</strong> the sampling distribution corresponding to each <strong>of</strong> the following samples.<br />
a) X = 63 for a sample <strong>of</strong> n = 16 scores.<br />
b) X = 63 for a sample <strong>of</strong> n = 36 scores.<br />
c) X = 63 for a sample <strong>of</strong> n = 64 scores.<br />
(3) The population <strong>of</strong> IQ scores forms a normal distribution with a mean <strong>of</strong> µ = 100 and a standard<br />
deviation <strong>of</strong> σ = 15. What is the probability <strong>of</strong> obtaining a sample mean greater than X = 105,<br />
a) for a random sample <strong>of</strong> n = 9 people?<br />
b) for a random sample <strong>of</strong> n = 36 people?<br />
(4) A population <strong>of</strong> scores forms a normal distribution with a mean <strong>of</strong> µ = 40 and a standard<br />
deviation <strong>of</strong> σ = 12.<br />
a) What is the probability <strong>of</strong> randomly selecting a score less than X = 34?<br />
b) What is the probability <strong>of</strong> selecting a sample <strong>of</strong> n = 9 scores with a mean less than X = 34?<br />
c) What is the probability <strong>of</strong> selecting a sample <strong>of</strong> n = 36 scores with a mean less than X = 34?
PSY 201 2<br />
(5) People are selected to serve on juries by randomly picking names from the list <strong>of</strong> registered<br />
voters. The average age for registered voters in the county is µ = 39.7 years with a standard<br />
deviation <strong>of</strong> σ = 12.4. A statistician randomly selects a sample <strong>of</strong> n = 16 people who are currently<br />
serving on juries. The average age for individuals in the sample is X = 48.9 years.<br />
a) How likely is it to obtain a random sample <strong>of</strong> n = 16 jurors with an average age greater than<br />
or equal to 48.9?<br />
b) Is it reasonable to conclude that this set <strong>of</strong> n = 16 people is not a representative random<br />
sample <strong>of</strong> registered voters?<br />
(6) A normal-shaped distribution has µ = 80 and σ = 15.<br />
a) Sketch the distribution <strong>of</strong> sample means for samples <strong>of</strong> n = 25 scores from this population.<br />
b) What are the z-score values that form the boundaries <strong>of</strong> the middle 95% <strong>of</strong> the distribution<br />
<strong>of</strong> sample means?<br />
c) Compute the z-score for X=89 for a sample <strong>of</strong> n = 25 scores. Is this sample mean in the<br />
middle <strong>of</strong> the 95% <strong>of</strong> the distribution?<br />
d) Compute the z-score for X=84 for a sample <strong>of</strong> n = 25 scores. Is this sample mean in the<br />
middle <strong>of</strong> the 95% <strong>of</strong> the distribution?
![Exam 4 Study Guide[1]](https://img.yumpu.com/45196739/1/190x245/exam-4-study-guide1.jpg?quality=85)