

Annual report - Putnam Investments
Annual report - Putnam Investments
Annual report - Putnam Investments

Create successful ePaper yourself
Turn your PDF publications into a flip-book with our unique Google optimized e-Paper software.
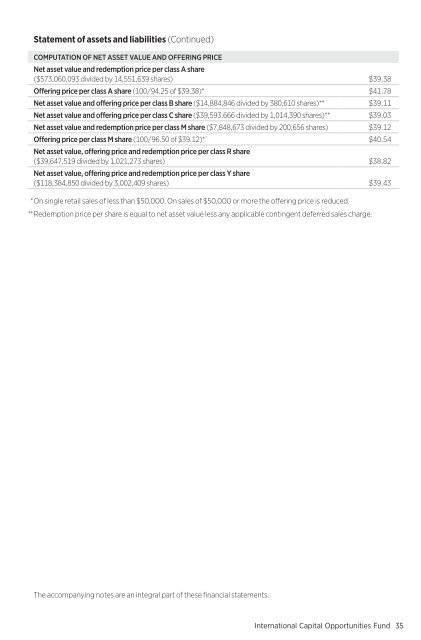
Statement of assets and liabilities (Continued)<br />
COMPUTATION OF NET ASSET VALUE AND OFFERING PRICE<br />
Net asset value and redemption price per class A share<br />
($573,060,093 divided by 14,551,639 shares) $39.38<br />
Offering price per class A share (100/94.25 of $39.38)* $41.78<br />
Net asset value and offering price per class B share ($14,884,846 divided by 380,610 shares)** $39.11<br />
Net asset value and offering price per class C share ($39,593,666 divided by 1,014,390 shares)** $39.03<br />
Net asset value and redemption price per class M share ($7,848,673 divided by 200,656 shares) $39.12<br />
Offering price per class M share (100/96.50 of $39.12)*` $40.54<br />
Net asset value, offering price and redemption price per class R share<br />
($39,647,519 divided by 1,021,273 shares) $38.82<br />
Net asset value, offering price and redemption price per class Y share<br />
($118,384,850 divided by 3,002,409 shares) $39.43<br />
*On single retail sales of less than $50,000. On sales of $50,000 or more the offering price is reduced.<br />
**Redemption price per share is equal to net asset value less any applicable contingent deferred sales charge.<br />
The accompanying notes are an integral part of these financial statements.<br />
International Capital Opportunities Fund35


